High Performance Liquid Chromatography with UV fluorescence detection


 after")

: Ratio of the number of molecules")
 and")


 allowing for obtaining both types of")


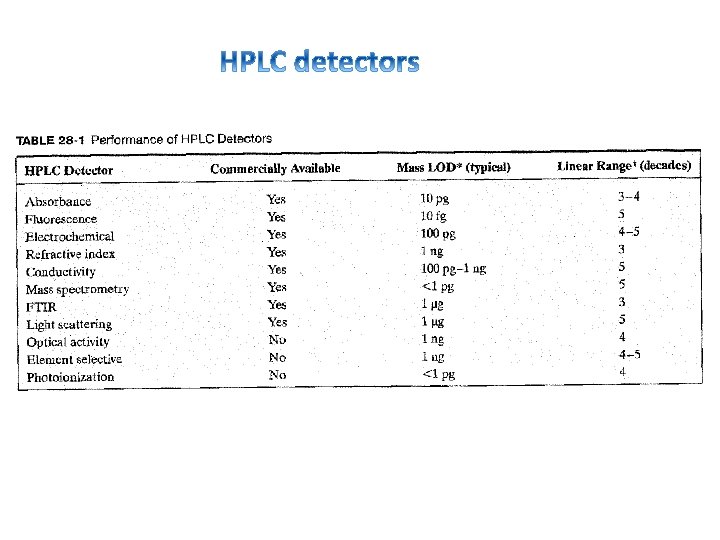
 Concentration detection limit (molar) Advantages Absorption 10 -13 to")


- Slides: 47
High Performance Liquid Chromatography with UV & fluorescence detection
HPLC system
Normal phase
Reversed phase
The injector: Rheodyne. TM
http: //kinesis. co. uk/knowledgebase/rheodyne-dual-mode-sample-injectors/
The column
Monomeric vs. polymeric C 18 bonding. Use of trifunctional bonding reagent results in a more complex multilayered C 18 bonded phase. http: //www. seaviewsci. com/vydacpubs/NL 01 SPR. html
R = CH 3 R = C 8 H 17 R = C 18 H 37
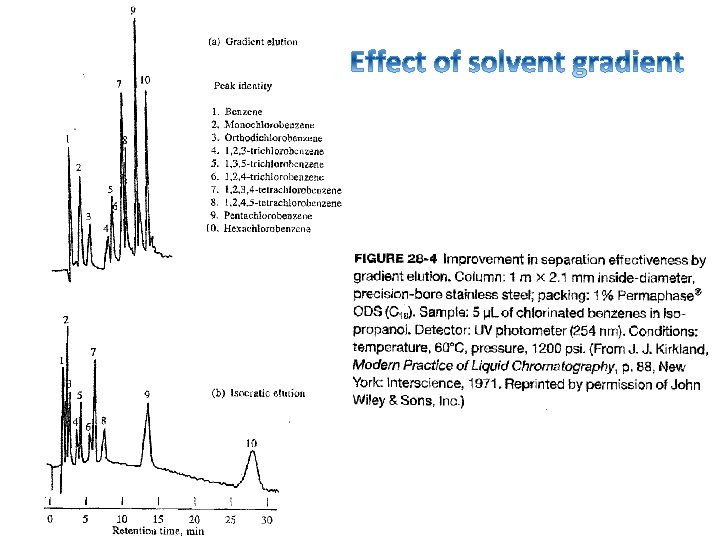
http: //www. chromacademy. com/chromatography-HPLC-Gradient-Elution-Baseline-Drift. html
Example of UV detection: PACs on reversed phase λ = 254 nm http: //www. restek. com/Technical-Resources/Technical-Library/Environmental/env_A 027
UV absorption spectra of PACs https: //www 2. chemistry. msu. edu/faculty/reusch/Virt. Txt. Jml/Spectrpy/UV-Vis/spectrum. htm
Fluorescence detection/spectrophotometry
l Fluorescence: radiation emitted from atoms or molecules rapidly (τ <10 -5 s) after the time of photoexcitation. Resonance fluorescence: when λe = λa Nonresonance fluorescence: when λe > λa
Absorption Spectroscopy Fluorescence Spectroscopy Emission Spectroscopy Skoog et al. , 2007
UV-Vis Fluorescence of Molecules Quantum yield ( ): Ratio of the number of molecules that luminescence to the total number of excited molecules. Determined by the relative rate constants (kx) of deactivation processes: f: fluorescence i: intersystem crossing ec: external conversion ic: internal conversion pd: predissociation d: dissociation
C P F Both absorption and fluorescence are dependent on light path (b) and molar absorptivity (ε) Fluorescence depends on quantum yield ( ) and incident light P 0 k’ = constant depending on geometry and instrument used. 21
Some variables affecting fluorescence Ø Excitation wavelength λ 250 nm Ø Transition types (fluor. ) π* π transition > π* n transition > σ* σ transition Ø Molecular structure • • Usually aromatic compounds increases with number of rings and degree of condensation Increase in rigid structures Increase for chelating agents when bound to metal. Ø Temperature: increased fluor. at lower T. Ø p. H: p. H dependent for compounds with acid-base dissociations
UV-Vis Fluorescence Spectrophotometers Components similar to UV/Vis absorption spectrophotometer, but the detector is located with a 90⁰ angle from the incident light beam Newer portable fluorimeters Ø Source beam split into reference and sample beams, allowing to correct for source fluctuations. Ø Wavelength selections are by filters – limited range analysis; incapable of scanning measurement. Ø Simple, rugged, low cost, compact, portable
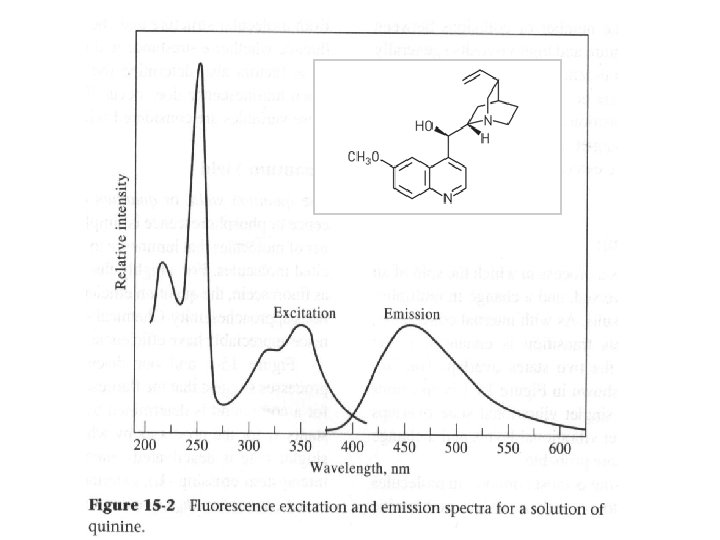
UV-Vis fluorescence spectra from grating instruments l 1 Ø Excitation Spectrum measure fluorescence at a fixed λ while varying the excitation wavelength. Ø Emission Spectrum measure fluorescence over a range of wavelengths using a fixed excitation λ. Ø Total fluorescence Spectrum measure fluorescence over a range of emission and excitation wavelengths
“Grating” Spectrofluorimeter Ø Two grating monochromators (excitation, emission) allowing for obtaining both types of spectra Ø The emission spectra are often instrument dependent (radiation source, transducer, monochromators) and thus not necessarily comparable.
To collect excitation spectrum
To collect fluorescence spectrum
Method Mass detection limit (moles) Concentration detection limit (molar) Advantages Absorption 10 -13 to 10 -16 10 -5 to 10 -8 Universal fluorescence 10 -15 to 10 -17 10 -7 to 10 -9 Sensitive
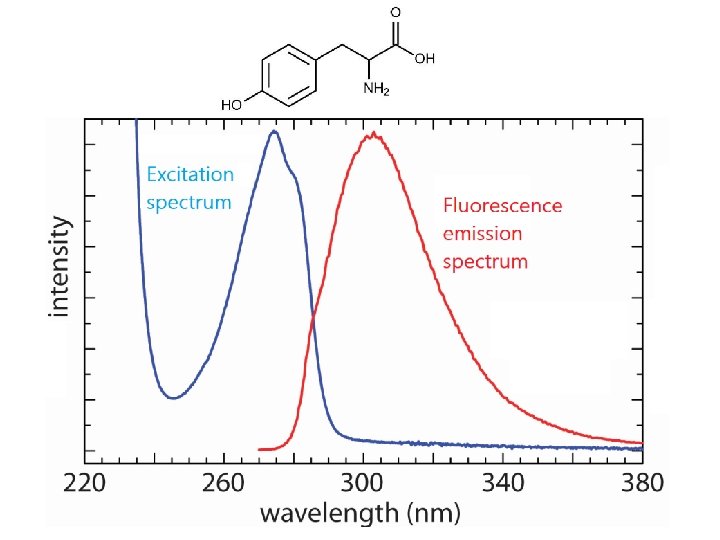
HPLC-Fluorescence • Roughly about 15% of all compounds produce natural fluorescence.
Molecules that fluoresce naturally fluorene fluoresceine tryptophan 2 -aminobenzamide
Polycyclic aromatics: UV-vis abs. UV abs. 254 nm http: //www. dionex. com/en-us/ webdocs/115260 -AN-1085 -HPLCPAHs-Tap-Water-AN 70923 -EN. pdf
Polycyclic aromatics: Fluor. http: //www. dionex. com/en-us/ webdocs/115260 -AN-1085 -HPLCPAHs-Tap-Water-AN 70923 -EN. pdf
http: //www. dionex. com/en-us/webdocs/115260 -AN-1085 -HPLC-PAHs-Tap-Water-AN 70923 -EN. pdf
Molecules that fluoresce naturally http: //zeiss-campus. magnet. fsu. edu/articles/probes/fpintroduction. html
Molecules that need a fluorophore for HPLC Carbohydrates The fluorophore selectively binds to a specific region or functional group on the target molecule and can be attached chemically. Amino acids Metal ions DNA Zn 2+
Carbohydrates: tagging with 2 -aminobenzamide or 2 -aminobenzoic acid Exc. 330 nm; Det. 420 nm
Analysis of monosaccharides tagged with 2 -aminobenzoic acid Column: amino HILIC http: //glycotools. qa-bio. com/Monosaccharide-Kit
Amino acids: tagging with dansyl chloride Exc. 350 nm; Det. 520 nm
Amino acids: tagging with ninhydrin Exc: 300 nm Fluo: 570 nm http: //classroom. sdmesa. edu/eschmid/Lab 4 -Biol 210. htm
Analysis of amino acids tagged with nihydrin Column: normal phase
Zn 2+ : chelating with 8 -hydroxyquinoline Exc. 320 nm; Det. 550 nm
• For solid or liquid samples • Different types of stationary phases available (normal and reversed phases) • Fraction collection possible for sample purification • UV and fluorescence detectors may be used separately or lined up • UV: different compound have different ε so no direct quantitation • Fluor: each compound has different combination of λexc and λem • Non-absorbent and non-fluorescent compounds must be derivatized • Fluor. more sensitive than UV-vis in general
1. Given the three compounds shown here to be separated by reversed phase HPLC: 1 2 3 • What would be their elution order? Justify.
2. What are the excitation and fluorescence spectra of organic molecules and how are they obtained using a spectrofluorimeter? 3. Comment on the use of dansyl chloride reagent for high performance liquid chromatography. a) What kind of compounds is it useful for and how does it enhance detection? b) In terms of quantitative analysis by HPLC, what is the main advantage obtained from the use of dansyl chloride?
4. From the following chromatogram obtained with a 30 cm column, determine: -The capacity constant for the compound eluting at 6 min. -The resolution -The number and height of theoretical plates The first peak is from a compound that is not retained at all on the column.