High Performance Data Analytics and a Java Grande


 • Application: Survey")


 Multiple users performing interactive queries and updates on")


 i. iii. iv. v. vii. Search/Query Local")
 i. Pleasingly Parallel – as")


 Search and query (b) Maximum Likelihood,")
 SQL, (ii) NOSQL based, (iii) Other Enterprise data")


 • On the")


 Map Only Input (b) Classic Map. Reduce (c)")
 • Generalizes Iterative Map. Reduce • Combine MPI and")


 Map. Reduce 1400 1200 Hadoop All. Reduce Hadoop Map. Reduce 1000")


 HPC-ABDS Hourglass 120 Software Projects System Abstractions/standards • Data format")


 K-Means Clustering Harp v. s. Hadoop on Madrid")

 Annealing Find minimum at high temperature when trivial Small change")
 and/or")
 problems • (Non-metric) problems use O(N 2) (i, j) the")
 k runs over clusters; i, j")


 running with")


_2(4) 12579")

 HPC with “Commodity Big data” (Google to")
- Slides: 74
High Performance Data Analytics and a Java Grande Run Time Rice University April 18 2014 Geoffrey Fox gcf@indiana. edu http: //www. infomall. org School of Informatics and Computing Digital Science Center Indiana University Bloomington
Abstract • There is perhaps a broad consensus as to important issues in practical parallel computing as applied to large scale simulations; this is reflected in supercomputer architectures, algorithms, libraries, languages, compilers and best practice for application development. • However the same is not so true for data intensive even though commercially clouds devote many more resources to data analytics than supercomputers devote to simulations. • Here we use a sample of over 50 big data applications to identify characteristics of data intensive applications and to deduce needed runtime and architectures. • We propose a big data version of the famous Berkeley dwarfs and NAS parallel benchmarks. • Our analysis builds on the Apache software stack that is well used in modern cloud computing. • We give some examples including clustering, deep-learning and multidimensional scaling. • One suggestion from this work is value of a high performance Java (Grande) runtime that supports simulations and big data
NIST Big Data Use Cases
NIST Requirements and Use Case Subgroup • • Part of NIST Big Data Public Working Group (NBD-PWG) June-September 2013 http: //bigdatawg. nist. gov/ Leaders of activity – Wo Chang, NIST – Robert Marcus, ET-Strategies – Chaitanya Baru, UC San Diego • Also Reference Architecture, Taxonomy, Secuty&Privacx, Roadmap groups The focus is to form a community of interest from industry, academia, and government, with the goal of developing a consensus list of Big Data requirements across all stakeholders. This includes gathering and understanding various use cases from diversified application domains. Tasks • Gather use case input from all stakeholders • Derive Big Data requirements from each use case. • Analyze/prioritize a list of challenging general requirements that may delay or prevent adoption of Big Data deployment • Develop a set of general patterns capturing the “essence” of use cases (doing) • Work with Reference Architecture to validate requirements and explicitly implement some patterns based on use cases 4
Big Data Definition • More consensus on Data Science definition that of Big Data • Big Data refers to digital data volume, velocity and/or variety that: • Enable novel approaches to frontier questions previously inaccessible or impractical using current or conventional methods; and/or • Exceed the storage capacity or analysis capability of current or conventional methods and systems; and • Differentiates by storing and analyzing population data and not sample sizes. • Needs management requiring scalability across coupled horizontal resources • Everybody says their data is big (!) Perhaps how it is used is most important 12/26/13 5
What is Data Science? • I was impressed by number of NIST working group members who were self declared data scientists • I was also impressed by universal adoption by participants of Apache technologies – see later • Mc. Kinsey says there are lots of jobs (1. 65 M by 2018 in USA) but that’s not enough! Is this a field – what is it and what is its core? • The emergence of the 4 th or data driven paradigm of science illustrates significance - http: //research. microsoft. com/enus/collaboration/fourthparadigm/ • Discovery is guided by data rather than by a model • The End of (traditional) science http: //www. wired. com/wired/issue/1607 is famous here • Another example is recommender systems in Netflix, ecommerce etc. where pure data (user ratings of movies or products) allows an empirical prediction of what users like
http: //www. wired. com/wired/issue/16 -07 September 2008
Data Science Definition • Data Science is the extraction of actionable knowledge directly from data through a process of discovery, hypothesis, and analytical hypothesis analysis. • A Data Scientist is a practitioner who has sufficient knowledge of the overlapping regimes of expertise in business needs, domain knowledge, analytical skills and programming expertise to manage the end-to-end scientific method process through each stage in the big data lifecycle. 12/26/13 8
• • • Use Case Template 26 fields completed for 51 areas Government Operation: 4 Commercial: 8 Defense: 3 Healthcare and Life Sciences: 10 Deep Learning and Social Media: 6 The Ecosystem for Research: 4 Astronomy and Physics: 5 Earth, Environmental and Polar Science: 10 Energy: 1 9
51 Detailed Use Cases: Contributed July-September 2013 • • • Covers goals, data features such as 3 V’s, software, hardware 26 Features for each use case http: //bigdatawg. nist. gov/usecases. php https: //bigdatacoursespring 2014. appspot. com/course (Section 5) Biased to science Government Operation(4): National Archives and Records Administration, Census Bureau Commercial(8): Finance in Cloud, Cloud Backup, Mendeley (Citations), Netflix, Web Search, Digital Materials, Cargo shipping (as in UPS) Defense(3): Sensors, Image surveillance, Situation Assessment Healthcare and Life Sciences(10): Medical records, Graph and Probabilistic analysis, Pathology, Bioimaging, Genomics, Epidemiology, People Activity models, Biodiversity Deep Learning and Social Media(6): Driving Car, Geolocate images/cameras, Twitter, Crowd Sourcing, Network Science, NIST benchmark datasets The Ecosystem for Research(4): Metadata, Collaboration, Language Translation, Light source experiments Astronomy and Physics(5): Sky Surveys including comparison to simulation, Large Hadron Collider at CERN, Belle Accelerator II in Japan Earth, Environmental and Polar Science(10): Radar Scattering in Atmosphere, Earthquake, Ocean, Earth Observation, Ice sheet Radar scattering, Earth radar mapping, Climate simulation datasets, Atmospheric turbulence identification, Subsurface Biogeochemistry (microbes to watersheds), Ameri. Flux and FLUXNET gas sensors 10 Energy(1): Smart grid
Part of Property Summary Table 11
Governme nt 3: Census Bureau Statistical Survey Response Improvement (Adaptive Design) • Application: Survey costs are increasing as survey response declines. The goal of this work is to use advanced “recommendation system techniques” that are open and scientifically objective, using data mashed up from several sources and historical survey para-data (administrative data about the survey) to drive operational processes in an effort to increase quality and reduce the cost of field surveys. • Current Approach: About a petabyte of data coming from surveys and other government administrative sources. Data can be streamed with approximately 150 million records transmitted as field data streamed continuously, during the decennial census. All data must be both confidential and secure. All processes must be auditable for security and confidentiality as required by various legal statutes. Data quality should be high and statistically checked for accuracy and reliability throughout the collection process. Use Hadoop, Spark, Hive, R, SAS, Mahout, Allegrograph, My. SQL, Oracle, Storm, Big. Memory, Cassandra, Pig software. • Futures: Analytics needs to be developed which give statistical estimations that provide more detail, on a more near real time basis for less cost. The reliability of estimated statistics from such “mashed up” sources still must be evaluated. 12/26/13 12
Deep Learning Social Networking 26: Large-scale Deep Learning • Application: Large models (e. g. , neural networks with more neurons and connections) combined with large datasets are increasingly the top performers in benchmark tasks for vision, speech, and Natural Language Processing. One needs to train a deep neural network from a large (>>1 TB) corpus of data (typically imagery, video, audio, or text). Such training procedures often require customization of the neural network architecture, learning criteria, and dataset pre-processing. In addition to the computational expense demanded by the learning algorithms, the need for rapid prototyping and ease of development is extremely high. • Current Approach: The largest applications so far are to image recognition and scientific studies of unsupervised learning with 10 million images and up to 11 billion parameters on a 64 GPU HPC Infiniband cluster. Both supervised (using existing classified images) and unsupervised applications • Futures: Large datasets of 100 TB or more may be necessary in order to exploit the representational power Classified of the larger models. Training a self-driving car could OUT take 100 million images at megapixel resolution. Deep Learning shares many characteristics with the broader field of machine learning. The paramount requirements are high computational throughput for mostly dense linear algebra operations, and extremely high productivity for researcher exploration. One needs IN integration of high performance libraries with high level (python) prototyping environments 12/26/13 13
Research Ecosystem 35: Light source beamlines • Application: Samples are exposed to X-rays from light sources in a variety of configurations depending on the experiment. Detectors (essentially high-speed digital cameras) collect the data. The data are then analyzed to reconstruct a view of the sample or process being studied. • Current Approach: A variety of commercial and open source software is used for data analysis – examples including Octopus for Tomographic Reconstruction, Avizo (http: //vsg 3 d. com) and FIJI (a distribution of Image. J) for Visualization and Analysis. Data transfer is accomplished using physical transport of portable media (severely limits performance) or using high-performance Grid. FTP, managed by Globus Online or workflow systems such as SPADE. • Futures: Camera resolution is continually increasing. Data transfer to large-scale computing facilities is becoming necessary because of the computational power required to conduct the analysis on time scales useful to the experiment. Large number of beamlines (e. g. 39 at LBNL ALS) means that total data load is likely to increase significantly and require a generalized infrastructure for analyzing gigabytes per second of data from many beamline detectors at multiple facilities. 12/26/13 14
10 Suggested Generic Use Cases 1) Multiple users performing interactive queries and updates on a database with basic availability and eventual consistency (BASE) 2) Perform real time analytics on data source streams and notify users when specified events occur 3) Move data from external data sources into a highly horizontally scalable data store, transform it using highly horizontally scalable processing (e. g. Map-Reduce), and return it to the horizontally scalable data store (ELT) 4) Perform batch analytics on the data in a highly horizontally scalable data store using highly horizontally scalable processing (e. g Map. Reduce) with a user-friendly interface (e. g. SQL like) 5) Perform interactive analytics on data in analytics-optimized database 6) Visualize data extracted from horizontally scalable Big Data store 7) Move data from a highly horizontally scalable data store into a traditional Enterprise Data Warehouse 8) Extract, process, and move data from data stores to archives 9) Combine data from Cloud databases and on premise data stores for analytics, data mining, and/or machine learning 10) Orchestrate multiple sequential and parallel data transformations and/or analytic processing using a workflow manager
10 Security & Privacy Use Cases • • • Consumer Digital Media Usage Nielsen Homescan Web Traffic Analytics Health Information Exchange Personal Genetic Privacy Pharma Clinic Trial Data Sharing Cyber-security Aviation Industry Military - Unmanned Vehicle sensor data Education - “Common Core” Student Performance Reporting • Need to integrate 10 “generic” and 10 “security & privacy” with 51 “full use cases”
Big Data Patterns – the Ogres
Would like to capture “essence of these use cases” “small” kernels, mini-apps Or Classify applications into patterns Do it from HPC background not database view point e. g. focus on cases with detailed analytics Section 5 of my class https: //bigdatacoursespring 2014. appspot. com/preview classifies 51 use cases with ogre facets
What are “mini-Applications” • Use for benchmarks of computers and software (is my parallel compiler any good? ) • In parallel computing, this is well established – Linpack for measuring performance to rank machines in Top 500 (changing? ) – NAS Parallel Benchmarks (originally a pencil and paper specification to allow optimal implementations; then MPI library) – Other specialized Benchmark sets keep changing and used to guide procurements • Last 2 NSF hardware solicitations had NO preset benchmarks – perhaps as no agreement on key applications for clouds and data intensive applications – Berkeley dwarfs capture different structures that any approach to parallel computing must address – Templates used to capture parallel computing patterns • Also database benchmarks like TPC
HPC Benchmark Classics • Linpack or HPL: Parallel LU factorization for solution of linear equations • NPB version 1: Mainly classic HPC solver kernels – MG: Multigrid – CG: Conjugate Gradient – FT: Fast Fourier Transform – IS: Integer sort – EP: Embarrassingly Parallel – BT: Block Tridiagonal – SP: Scalar Pentadiagonal – LU: Lower-Upper symmetric Gauss Seidel
• • • • 13 Berkeley Dwarfs Dense Linear Algebra First 6 of these correspond to Sparse Linear Algebra Colella’s original. Monte Carlo dropped Spectral Methods N-body methods are a subset of N-Body Methods Particle in Colella Structured Grids Unstructured Grids Note a little inconsistent in that Map. Reduce is a programming Map. Reduce model and spectral method is a Combinational Logic numerical method Graph Traversal Need multiple facets! Dynamic Programming Backtrack and Branch-and-Bound Graphical Models Finite State Machines
Distributed Computing Meta. Patterns I Jha, Cole, Katz, Parashar, Rana, Weissman
Core Analytics Facet of Ogres (micro. Pattern) i. iii. iv. v. vii. Search/Query Local Machine Learning – pleasingly parallel Summarizing statistics Recommender Systems (Collaborative Filtering) Global Outlier Detection (i. ORCA) Optimization Clustering (many methods), LDA (Latent Dirichlet Allocation) or variants like PLSI (Probabilistic Latent Semantic Indexing), viii. SVM and Linear Classifiers (Bayes, Random Forests), ix. Page. Rank, (Find leading eigenvector of sparse matrix) Matrix x. SVD (Singular Value Decomposition), Algebra xi. Learning Neural Networks (Deep Learning), xii. MDS (Multidimensional Scaling), xiii. Graph Structure Algorithms (seen in search of RDF Triple stores), xiv. Network Dynamics - Graph simulation Algorithms (epidemiology)
Problem Architecture Facet of Ogres (Meta or Macro. Pattern) i. Pleasingly Parallel – as in Blast, Protein docking, some (bio-)imagery ii. Local Analytics or Machine Learning – ML or filtering pleasingly parallel as in bio-imagery, radar images (really just pleasingly parallel but sophisticated local analytics) iii. Global Analytics or Machine Learning seen in LDA, Clustering etc. with parallel ML over nodes of system iv. SPMD (Single Program Multiple Data) v. Bulk Synchronous Processing: well defined computecommunication phases vi. Fusion: Knowledge discovery often involves fusion of multiple methods. vii. Workflow (often used in fusion)
Healthcare Life Sciences 18: Computational Bioimaging • Application: Data delivered from bioimaging is increasingly automated, higher resolution, and multi-modal. This has created a data analysis bottleneck that, if resolved, can advance the biosciences discovery through Big Data techniques. • Current Approach: The current piecemeal analysis approach does not scale to situation where a single scan on emerging machines is 32 TB and medical diagnostic imaging is annually around 70 PB even excluding cardiology. One needs a web-based one-stop-shop for high performance, high throughput image processing for producers and consumers of models built on bio-imaging data. • Futures: Goal is to solve that bottleneck with extreme scale computing with community-focused science gateways to support the application of massive data analysis toward massive imaging data sets. Workflow components include data acquisition, storage, enhancement, minimizing noise, segmentation of regions of interest, crowd-based selection and extraction of features, and object classification, and organization, and search. Use Image. J, OMERO, Vol. Rover, advanced segmentation and feature detection software. Largely Local Machine Learning 12/26/13 25
Deep Learning Social Networking 27: Organizing large-scale, unstructured collections of consumer photos I • Application: Produce 3 D reconstructions of scenes using collections of millions to billions of consumer images, where neither the scene structure nor the camera positions are known a priori. Use resulting 3 d models to allow efficient browsing of large-scale photo collections by geographic position. Geolocate new images by matching to 3 d models. Perform object recognition on each image. 3 d reconstruction posed as a robust non-linear least squares optimization problem where observed relations between images are constraints and unknowns are 6 -d camera pose of each image and 3 -d position of each point in the scene. • Current Approach: Hadoop cluster with 480 cores processing data of initial applications. Note over 500 billion images on Facebook and over 5 billion on Flickr with over 500 million images added to social media sites each day. 12/26/13 Global Machine Learning after Initial Local steps 26
Deep Learning Social Networking 27: Organizing large-scale, unstructured collections of consumer photos II • Futures: Need many analytics including feature extraction, feature matching, and large-scale probabilistic inference, which appear in many or most computer vision and image processing problems, including recognition, stereo resolution, and image denoising. Need to visualize large-scale 3 -d reconstructions, and navigate large-scale collections of images that have been aligned to maps. 12/26/13 Global Machine Learning after Initial Local steps 27
This Facet of Ogres has Features • These core analytics/kernels can be classified by features like • (a) Flops per byte; • (b) Communication Interconnect requirements; • (c) Is application (graph) constant or dynamic • (d) Most applications consist of a set of interconnected entities; is this regular as a set of pixels or is it a complicated irregular graph • (d) Is communication BSP or Asynchronous; in latter case shared memory may be attractive • (e) Are algorithms Iterative or not? • (f) Are data points in metric or non-metric spaces
Application Class Facet of Ogres • • (a) Search and query (b) Maximum Likelihood, (c) 2 minimizations, (d) Expectation Maximization (often Steepest descent) (e) Global Optimization (Variational Bayes) (f) Agents, as in epidemiology (swarm approaches) (g) GIS (Geographical Information Systems). • Not as essential
Data Source Facet of Ogres (i) SQL, (ii) NOSQL based, (iii) Other Enterprise data systems (10 examples from Bob Marcus) (iv) Set of Files (as managed in i. RODS), (v) Internet of Things, (vi) Streaming and (vii) HPC simulations. Before data gets to compute system, there is often an initial data gathering phase which is characterized by a block size and timing. Block size varies from month (Remote Sensing, Seismic) to day (genomic) to seconds or lower (Real time control, streaming) • There are storage/compute system styles: Shared, Dedicated, Permanent, Transient • Other characteristics are need for permanent auxiliary/comparison datasets and these could be interdisciplinary implying nontrivial data movement/replication • •
Lessons / Insights • Ogres classify Big Data applications by multiple facets – each with several exemplars and features – Guide to breadth and depth of Big Data – Does your architecture/software support all the ogres? • Add database exemplars • In parallel computing, the simple analytic kernels dominate mindshare even though agreed limited
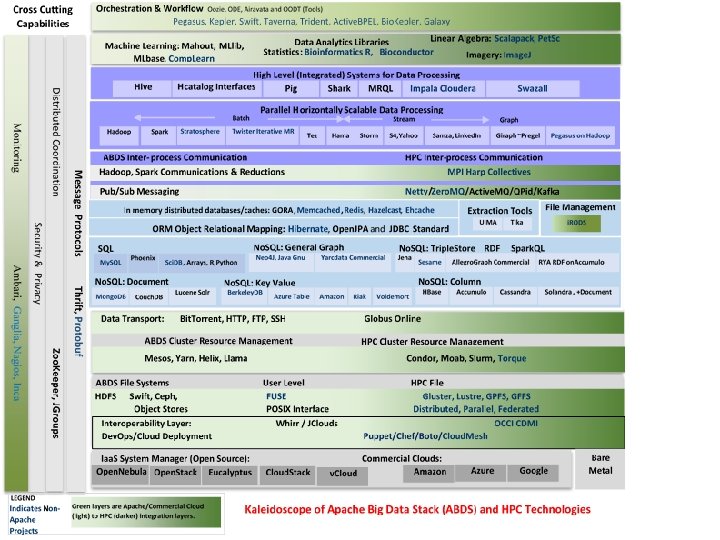
HPC-ABDS Integrating High Performance Computing with Apache Big Data Stack
• • HPC-ABDS ~120 Capabilities >40 Apache Green layers have strong HPC Integration opportunities • Goal • Functionality of ABDS • Performance of HPC
• • Broad Layers in HPC-ABDS Workflow-Orchestration Application and Analytics High level Programming Basic Programming model and runtime – SPMD, Streaming, Map. Reduce, MPI • Inter process communication – Collectives, point to point, publish-subscribe • • • In memory databases/caches Object-relational mapping SQL and No. SQL, File management Data Transport Cluster Resource Management (Yarn, Slurm, SGE) File systems(HDFS, Lustre …) Dev. Ops (Puppet, Chef …) Iaa. S Management from HPC to hypervisors (Open. Stack) Cross Cutting – – Message Protocols Distributed Coordination Security & Privacy Monitoring
Getting High Performance on Data Analytics (e. g. Mahout, R …) • On the systems side, we have two principles – The Apache Big Data Stack with ~120 projects has important broad functionality with a vital large support organization – HPC including MPI has striking success in delivering high performance with however a fragile sustainability model • There are key systems abstractions which are levels in HPC-ABDS software stack where Apache approach needs careful integration with HPC – Resource management – Storage – Programming model -- horizontal scaling parallelism – Collective and Point to Point communication – Support of iteration – Data interface (not just key-value) • In application areas, we define application abstractions to support – Graphs/network – Geospatial – Genes – Images etc.
Iterative Map. Reduce
Mahout and Hadoop MR – Slow due to Map. Reduce Python slow as Scripting Spark Iterative Map. Reduce, non optimal communication Harp Hadoop plug in with ~MPI collectives MPI fastest as C not Java Increasing Communication Identical Computation
4 Forms of Map. Reduce (a) Map Only Input (b) Classic Map. Reduce (c) Iterative Map. Reduce Input Iterations map map (d) Loosely Synchronous Pij reduce Output BLAST Analysis High Energy Physics Expectation maximization Classic MPI Parametric sweep (HEP) Histograms Clustering e. g. Kmeans PDE Solvers and Pleasingly Parallel Distributed search Linear Algebra, Page Rank particle dynamics Domain of Map. Reduce and Iterative Extensions MPI Science Clouds Giraph MPI is Map followed by Point to Point or Collective Communication 39 – as in style c) plus d)
Map Collective Model (Judy Qiu) • Generalizes Iterative Map. Reduce • Combine MPI and Map. Reduce ideas • Implement collectives optimally on Infiniband, Azure, Amazon …… Iterate Input map Initial Collective Step Generalized Reduce Final Collective Step Initial work on Twister (2008, 2010 -2013) and Twister 4 Azure (201113) being moved to Harp with a explicit communication layer 40
Vocabulary from clustering 7 million features into a million clusters Tested on IU Polar Grid with 1 Gbps Ethernet connection Pipelined Broadcasting with Topology-Awareness
Using Optimal “Collective” Operations • Twister 4 Azure Iterative Map. Reduce with enhanced collectives – Map-All. Reduce primitive and Map. Reduce-Merge. Broadcast. • Strong Scaling on Kmeans for up to 256 cores on Azure
Collectives improve traditional Map. Reduce • This is Kmeans running within basic Hadoop but with optimal All. Reduce collective operations • Running on Infiniband Linux Cluster
Kmeans and (Iterative) Map. Reduce 1400 1200 Hadoop All. Reduce Hadoop Map. Reduce 1000 Time (s) Twister 4 Azure All. Reduce 800 Twister 4 Azure Broadcast 600 Twister 4 Azure 400 200 HDInsight (Azure. Hadoop) 0 32 x 32 M 64 x 64 M 128 x 128 M Num. Cores X Num. Data Points 256 x 256 M • Shaded areas are computing only where Hadoop on HPC cluster fastest • Areas above shading are overheads where T 4 A smallest and T 4 A with All. Reduce collective has lowest overhead • Note even on Azure Java (Orange) faster than T 4 A C# for compute 44
Implementing HPC-ABDS
Major Analytics Architectures in Use Cases • Pleasingly Parallel including local machine learning as in parallel over images and apply image processing to each image -Hadoop • Search including collaborative filtering and motif finding implemented using classic Map. Reduce (Hadoop) or non iterative Giraph • Iterative Map. Reduce using Collective Communication (clustering) – Hadoop with Harp, Spark …. . • Iterative Giraph (Map. Reduce) with point to point communication (most graph algorithms such as maximum clique, connected component, finding diameter, community detection) – Vary in difficulty of finding partitioning (classic parallel load balancing) • Shared memory thread based (event driven) graph algorithms (shortest path, Betweenness centrality)
HPC ABDS System (Middleware) HPC-ABDS Hourglass 120 Software Projects System Abstractions/standards • Data format • Storage • • HPC Yarn for Resource management Horizontally scalable parallel programming model Collective and Point to Point communication Support of iteration (in memory databases) Application Abstractions/standards Graphs, Networks, Images, Geospatial …. High performance Applications SPIDAL (Scalable Parallel Interoperable Data Analytics Library) or High performance Mahout, R, Matlab …. .
Integrating Yarn with HPC
Harp Design Parallelism Model Map. Reduce Model Architecture Map-Collective Model Application M Map-Collective Applications M M M Collective Communication Shuffle R Map. Reduce Applications R Harp Framework Resource Manager Map. Reduce V 2 YARN
Features of Harp Hadoop Plug in • Hadoop Plugin (on Hadoop 1. 2. 1 and Hadoop 2. 2. 0) • Hierarchical data abstraction on arrays, key-values and graphs for easy programming expressiveness. • Collective communication model to support various communication operations on the data abstractions. • Caching with buffer management for memory allocation required from computation and communication • BSP style parallelism • Fault tolerance with check-pointing
Performance on Madrid Cluster (8 nodes) K-Means Clustering Harp v. s. Hadoop on Madrid Increasing 1600 Identical Computation 1400 Communication Execution Time (s) 1200 1000 800 600 400 200 0 100 m 500 Hadoop 24 cores 10 m 5 k 1 m 50 k Problem Size Harp 24 cores Hadoop 48 cores Harp 48 cores Hadoop 96 cores Harp 96 cores Note compute same in each case as product of centers times points identical
3 Classes of Parallel Datamining Problems • • • The classic Map. Reduce problems The Search in Information Retrieval k nearest neighbor (Collaborative Filtering) And optimize giant objective function by nifty Steepest Descent with iteration and expectation maximization k means Clustering (often for classification) Deterministic Annealing (DA) Clustering for metric spaces DA Clustering for non metric spaces Multi dimensional scaling for non metric spaces (with or without DA) Generative Topographic Mapping with or without DA (metric space approach to dimension reduction) Gaussian mixtures (with or without DA) Topic/Latent factor determination using Latent Dirichlet Allocation by variational Bayes or PLSI (Probabilistic Latent Semantic Indexing) Deep Learning by Stochastic Gradient Descent
• • (Deterministic) Annealing Find minimum at high temperature when trivial Small change avoiding local minima as lower temperature Typically gets better answers than standard libraries- R and Mahout And can be parallelized and put on GPU’s etc. 53
Features of these parallel problems • Parallelism over items (documents, points, gene sequences) and/or parameters to be determined (clusters, network weights) • Nothing like sparseness as seen simulation problems – Deep learning is local blocks but each block dominated by full matrix algorithms • Clustering sees dynamic locality/sparseness as good algorithms only look at points near a cluster center – This needs dynamic load balancing familiar from geometrically heterogeneous simulation problems – Such algorithms not studied much – Graph algorithms need static load balancing
Features of these (blue/green) problems • (Non-metric) problems use O(N 2) (i, j) the distance between points i and j for N points. This implies longer compute times and lots of storage (distributed over nodes) – Often no sparsity here • Need to calculate gradients, new parameter values – Matrix multiplication – Broadcasts and (all)reductions • Some methods also look at second derivative matrix and need to solve linear equations and/or find eigenvectors – I always use conjugate gradient to convert O(N 3) to a # iterations O(N 2) • Stochastic Gradient Descent not so easy to parallelize as only uses a few points at a time – Deep learning parallel over pixels of images; not images
DA-PWC EM Steps (E is red, M Black) k runs over clusters; i, j points; <Mi(k)> is probability that point I in cluster k 1) A(k) = - 0. 5 i=1 N j=1 N (i, j) <Mi(k)> <Mj(k)> / <C(k)>2 2) Bi(k) = j=1 N (i, j) <Mj(k)> / <C(k)> i points (distributed) k clusters (replicated) 3) i(k) = (Bi(k) + A(k)) 4) <Mi(k)> = exp( - i(k)/T )/ k=1 K exp(- i(k)/T) 5) C(k) = i=1 N <Mi(k)> • Iterate to converge variables at fixed T; iteratively decrease T from Parallelize by distributing points across processes Steps 1 global sum (reduction) Step 1, 2, 5 local sum if <Mi(k)> broadcast 56
Illustrations of Results and Performance
• Start at T= “ ” with 1 Cluster • Decrease T, Clusters emerge at instabilities 58
59
60
Analysis of Mass Spectrometry data to find peptides by clustering peaks in 2 D The brownish triangles are “sponge” peaks outside any cluster. The colored hexagons are peaks inside clusters with the white hexagons being cluster center determined by algorithm Fragment of 30, 000 Clusters 241605 Points 61
Cluster Count v. Temperature for 2 Runs 60000 50000 40000 DA 2 D Cluster Count DAVS(2) 30000 20000 Start Sponge DAVS(2) Sponge Reaches final value 10000 Add Close Cluster Check 1, 00 E+06 1, 00 E+05 1, 00 E+04 1, 00 E+03 1, 00 E+02 1, 00 E+01 1, 00 E+00 Temperature 1, 00 E-01 1, 00 E-02 0 1, 00 E-03 • All start with one cluster at far left • T=1 special as measurement errors divided out • DA 2 D counts clusters with 1 member as clusters. DAVS(2) does not
Speedups for several runs on Madrid using C# and MPI. NET from sequential through 128 way parallelism defined as product of number of threads per process and number of MPI processes. We look at different choices for MPI processes which are either inside nodes or on separate nodes. For example 16 -way parallelism shows 3 choices with thread count 1: 16 processes on one node (the fastest), 2 processes on 8 nodes and 8 processes on 2 nodes 63
Clusters v. Regions Lymphocytes 4 D Pathology 54 D • In Lymphocytes clusters are distinct • In Pathology, clusters divide space into regions and sophisticated methods like deterministic annealing are probably unnecessary 64
Protein Universe Browser for COG Sequences with a few illustrative biologically identified clusters 65
Full 446 K Clustered
Summarize a million Fungi Sequences Spherical Phylogram Visualization RAx. ML result visualized to right. Spherical Phylogram from new MDS method visualized in Plot. Viz
Features of these problems • 55 K lines of C# (becoming Java) running with MPI. Net and 20 K lines of Java running on Twister • Convert all to Java with Harp+Hadoop or Open. MPI (? MPJ) plus Habanero Java – Kmeans, Elkans method – Vector DA Clustering – Non metric (PW pairwise) DA clustering – Levenberg Marquardt 2 or ML solver – MDS as 2 – MDS as Weighted DA SMACOF – Lots of auxiliary routines such as Smith-Waterman and Needleman Wunsch gene alignment • Less well tested – GTM, PLSI, SVM, LDA, Page. Rank, outlier detection
DAVS Performance • Charge 2 Proteomics 241605 points 5, 5 MPI. NET 5 OMPI-nightly 25 OMPI-trunk Time (hours) 20 15 4, 5 4 MPI. NET 5 OMPInightly OMPI-trunk 4, 5 3, 5 4 3 3, 5 2, 5 3 Speedup MPI. NET Time (hours) 30 2 2, 5 10 1, 5 2 1 5 1, 5 0 1 x 1 x 1 x 2 x 1 1 x 1 x 4 x 1 1 x 1 x 8 1 x 2 x 4 1 x 4 x 2 Tx. Px. N Pure MPI Times 4/1/2013 0 2 x 1 x 8 4 x 1 x 8 8 x 1 x 8 1 x 2 x 8 4 x 2 x 8 1 x 4 x 8 2 x 4 x 8 1 x 8 x 8 Tx. Px. N MPI with Threads 1 1 x 1 x 2 x 1 1 x 1 x 4 x 1 1 x 1 x 8 1 x 2 x 4 1 x 4 x 2 Tx. Px. N Pure MPI Speedup 69
Performance of MPI Kernel Operations Pure Java as in Fast. MPJ slower than Java interfacing to C version of MPI
1 x 1 1 x 6 2 x 1 x 8 4 x 1 x 4 8 x 2 x 2 1 x 2 x 8 2 x 2 x 4 4 x 4 x 2 1 x 4 x 4 2 x 8 x 2 1 1 x x 2 1 x 1 x 32 2 x 1 1 x 6 4 x 1 x 8 8 2 x x 4 1 x 1 2 x 6 2 x 2 x 8 4 x 4 x 4 1 x 4 x 8 2 x 8 x 4 1 1 x x 4 2 x 1 x 32 4 x 1 1 x 6 8 x 2 x 8 1 x 2 x 32 2 x 1 2 x 6 4 4 x x 8 1 x 1 4 x 6 2 x 8 x 8 1 1 x x 8 4 x 1 x 32 8 x 2 x 16 2 x 2 x 32 4 x 4 x 16 1 x 4 x 32 2 x 8 x 16 1 x 1 x 16 8 x 2 x 32 4 x 4 x 32 2 x 8 x 32 1 x Time (hours) DAPWC Performance 0, 8 • Parallelism 16 0, 7 4/1/2013 Region 5(10)_2(4) 12579 Points 4 Clusters - OMPI-1. 7. 5 rc 5 Performance 0, 6 0, 5 0, 4 0, 3 0, 2 0, 1 0 Tx. Px. N 71
DAPWC Performance • Speedup on a relatively small problem 121 101 Region 5(10)_2(4) 12579 Points 4 Clusters - OMPI-1. 7. 5 rc 5 Speedup 61 Speedup 81 41 1 1 x 1 x 2 x 1 x 1 x 4 1 x 2 x 2 1 x 4 x 1 2 x 1 x 2 2 x 2 x 1 4 x 1 x 1 x 8 1 x 2 x 4 1 x 4 x 2 1 x 8 x 1 2 x 1 x 4 2 x 2 x 2 2 x 4 x 1 x 2 4 x 2 x 1 8 x 1 x 1 x 16 1 x 2 x 8 1 x 4 x 4 1 x 8 x 2 2 x 1 x 8 2 x 2 x 4 x 2 4 x 1 x 4 4 x 2 x 2 8 x 1 x 2 1 x 1 x 32 1 x 2 x 16 1 x 4 x 8 1 x 8 x 4 2 x 1 x 16 2 x 2 x 8 2 x 4 x 4 4 x 1 x 8 4 x 2 x 4 8 x 1 x 4 1 x 2 x 32 1 x 4 x 16 1 x 8 x 8 2 x 1 x 32 2 x 2 x 16 2 x 4 x 8 4 x 1 x 16 4 x 2 x 8 8 x 1 x 8 1 x 4 x 32 1 x 8 x 16 2 x 2 x 32 2 x 4 x 16 4 x 1 x 32 4 x 2 x 16 8 x 1 x 16 1 x 8 x 32 2 x 4 x 32 4 x 2 x 32 8 x 1 x 32 21 Tx. Px. N • Performance with threads is better than DAVS, but (T=8)x 1 x. N is peculiar as doesn’t use CPU’s on processor • Fast. MPJ failed as before • MPI. NET and OMPI-nightly runs are yet to be done 4/1/2013 SALSA Presentation 72
WDA SMACOF on Harp Big Red 2 Parallel Efficiency Based On 8 Nodes and 256 Cores Parallel Efficiency (Based On 8 Nodes and 256 Cores) 1, 2 1 0, 8 0, 6 0, 4 0, 2 0 0 20 40 60 80 Number of Nodes (8, 16, 32, 64, 128) 4096 partitions (32 cores per node) 100 120 140
Lessons / Insights • Integrate (don’t compete) HPC with “Commodity Big data” (Google to Amazon to Enterprise Data Analytics) – i. e. improve Mahout; don’t compete with it – Use Hadoop plug-ins rather than replacing Hadoop – Enhanced Apache Big Data Stack HPC-ABDS has 120 members – please improve list! • Data intensive algorithms do not have the well developed high performance libraries familiar from HPC • Not really any agreement on methodologies as typically use sequential low performance systems • Strong case for high performance Java (Grande) run time supporting all forms of parallelism – Also need more suitable computers!