High Performance Computing and Applications CISC 811 Dr









![Call Graph/Tree [thacker@phobos CISC 878]$ gprof --graph. /1000_intel gmon. out Call graph (explanation follows) Call Graph/Tree [thacker@phobos CISC 878]$ gprof --graph. /1000_intel gmon. out Call graph (explanation follows)](https://slidetodoc.com/presentation_image/d1b75dde4e620ab1010938a58ffc9da8/image-84.jpg)
- Slides: 98

High Performance Computing and Applications – CISC 811 Dr Rob Thacker Dept of Physics (308 A) thacker@physics

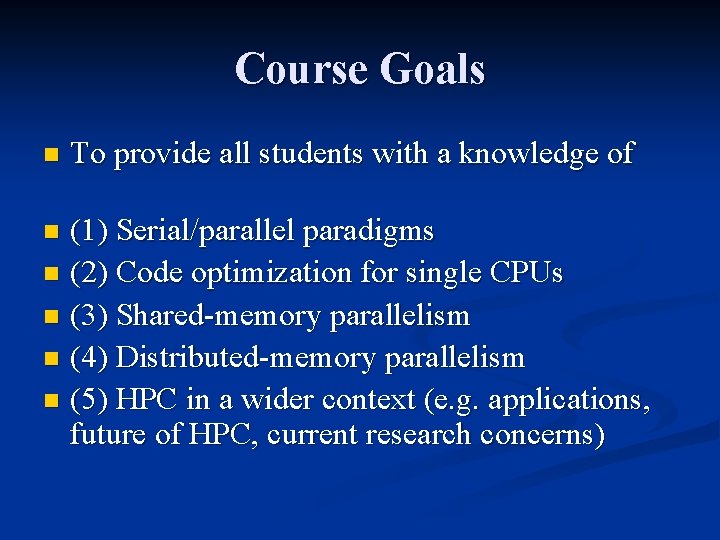
Course Goals n To provide all students with a knowledge of (1) Serial/parallel paradigms n (2) Code optimization for single CPUs n (3) Shared-memory parallelism n (4) Distributed-memory parallelism n (5) HPC in a wider context (e. g. applications, future of HPC, current research concerns) n


Course Website www. astro. queensu. ca/~thacker/new/teaching/ 811/ n Course outline + any news n Lecture notes will be posted there in ppt format n Homeworks and relevant source code will also be posted there n

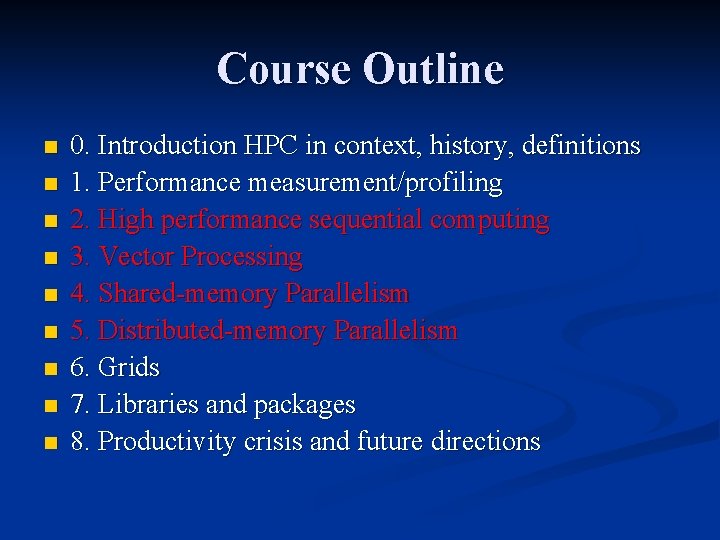
Course Outline n n n n n 0. Introduction HPC in context, history, definitions 1. Performance measurement/profiling 2. High performance sequential computing 3. Vector Processing 4. Shared-memory Parallelism 5. Distributed-memory Parallelism 6. Grids 7. Libraries and packages 8. Productivity crisis and future directions

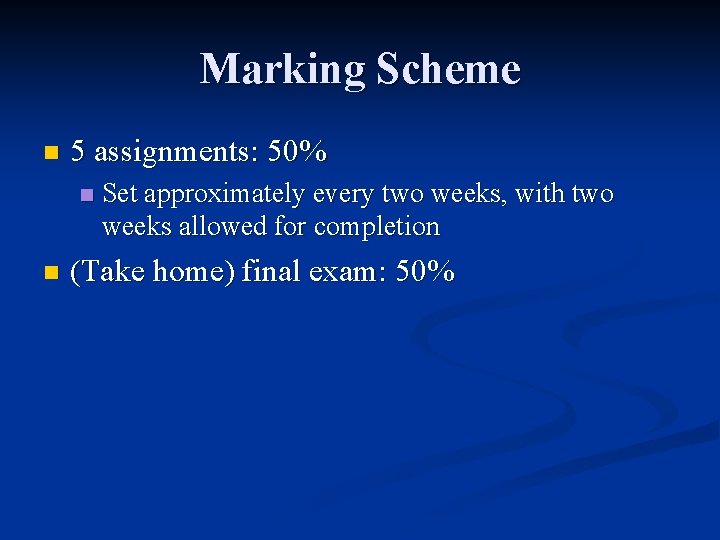
Marking Scheme n 5 assignments: 50% n n Set approximately every two weeks, with two weeks allowed for completion (Take home) final exam: 50%

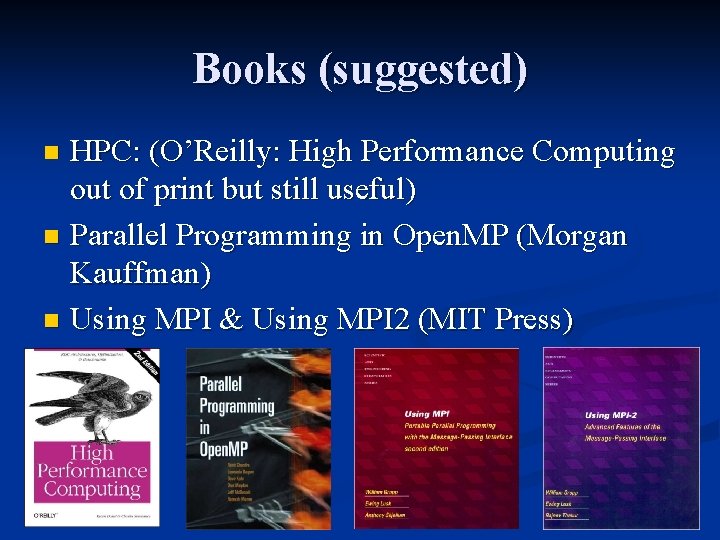
Books (suggested) HPC: (O’Reilly: High Performance Computing out of print but still useful) n Parallel Programming in Open. MP (Morgan Kauffman) n Using MPI & Using MPI 2 (MIT Press) n

Ideal Student n n n Interested application programming Background in C/Fortran Moderate programming experience (you know what a makefile is!) There will be theory in the course, but it is targeted towards the development of practical skills and knowledge (this isn’t a course on algorithms) Reasonable understanding of vector calculus necessary for examples

Today’s Lecture Part 1: Introduction - HPC in context, relevance, history and the top 500 list (plus the national picture) n Part 2: Benchmarking – Architecture recap, benchmarking approaches, suites n Part 3: Serial code performance measurement (PC sampling, hardware counters) n

Introduction: HPC in context Take a few minutes to look at the impact of HPC on modern society n How we measure the `fastest’ computers n Also look at the history of HPC and the current national picture n Why look at this? - lots of confusion about HPC - Vendors actively rely on lack of knowledge in user base - lies, damn lies, and benchmarks… - Much to be learnt from history of the subject

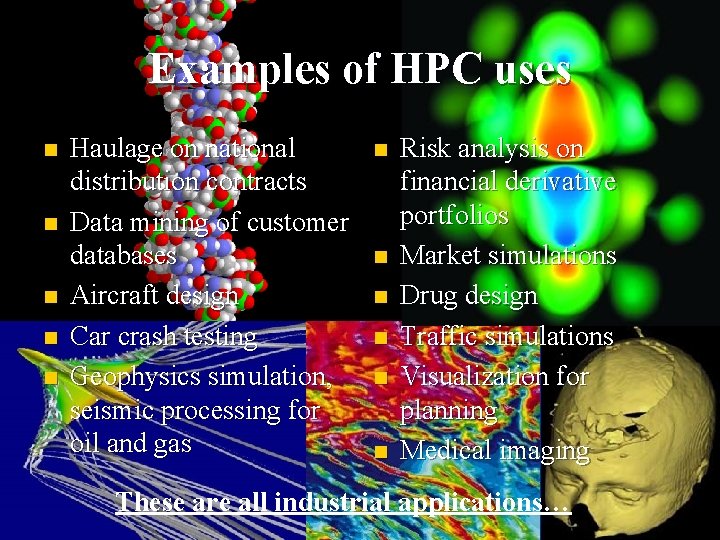
Examples of HPC uses n n n Haulage on national distribution contracts Data mining of customer databases Aircraft design Car crash testing Geophysics simulation, seismic processing for oil and gas n n n Risk analysis on financial derivative portfolios Market simulations Drug design Traffic simulations Visualization for planning Medical imaging These are all industrial applications…

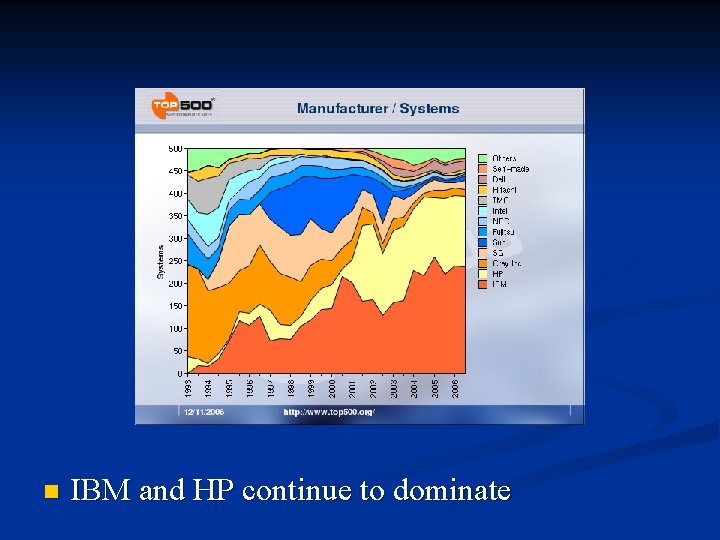
Gauging Relevance: The Top 500 Semi-annual listing of the top 500 most powerful computers on the planet n Used by vendors, granting agencies and academics n Speed estimated on the basis of one linear algebra benchmark: solution of dense linear system n HPL library provides portable implementation – we’ll look at this later n

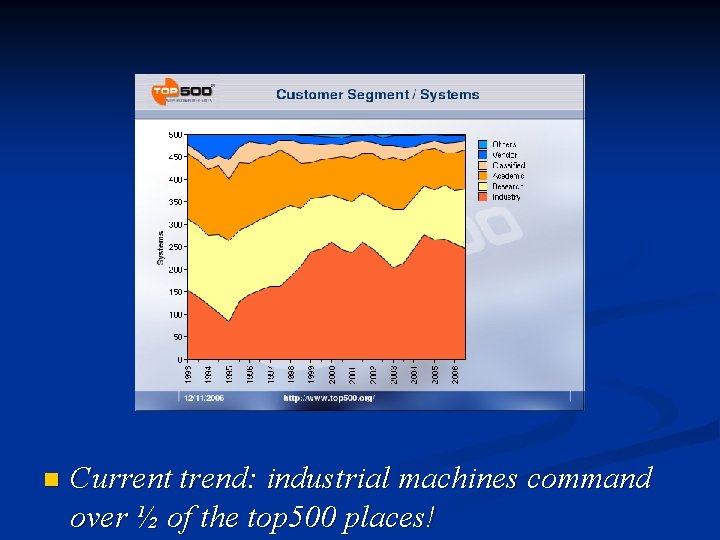
n Current trend: industrial machines command over ½ of the top 500 places!

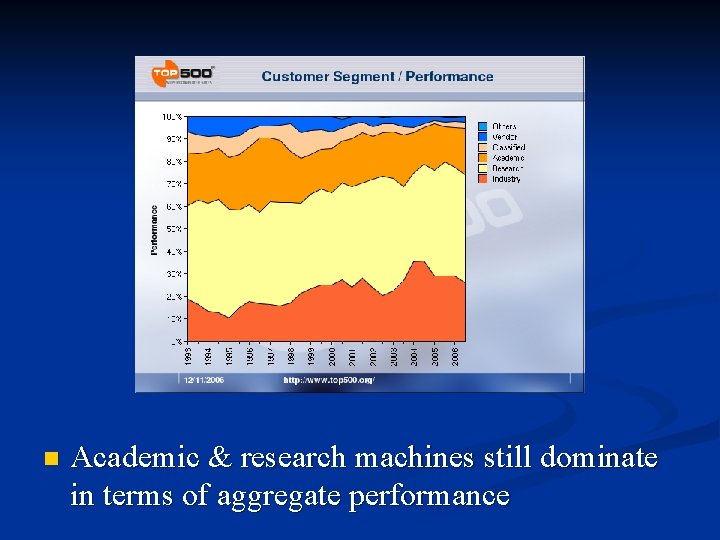
n Academic & research machines still dominate in terms of aggregate performance

n IBM and HP continue to dominate

Summary: HPC and Industry n HPC will become more important to industry n “Canadian Advanced Technology Alliance” published a report in 2005 acknowledging the shortage of HPC skills n Future looks bright for people with an HPC background!

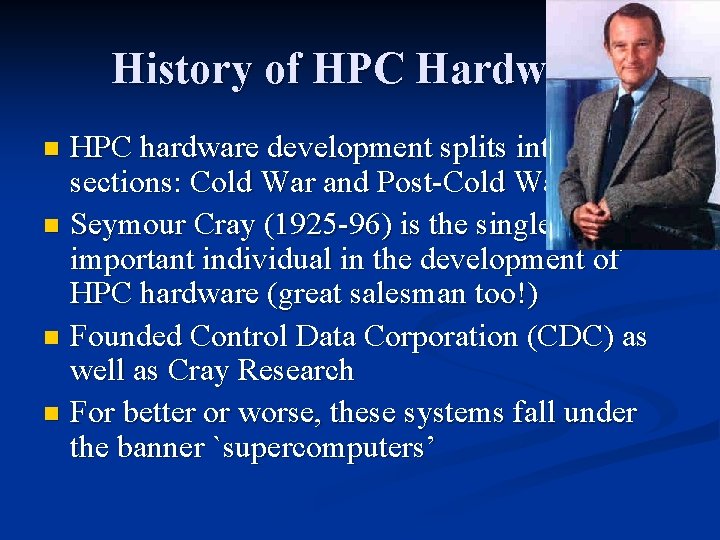
History of HPC Hardware HPC hardware development splits into two sections: Cold War and Post-Cold War n Seymour Cray (1925 -96) is the single most important individual in the development of HPC hardware (great salesman too!) n Founded Control Data Corporation (CDC) as well as Cray Research n For better or worse, these systems fall under the banner `supercomputers’ n

Segue: What is a supercomputer? No clear definition n Standards evolve over time n User perspective: 1000 more memory than desktop, 1000 times faster n Physical perspective: Weighs in excess of 10 tons, consumes hundreds of k. W or MW n Economic perspective: Costs in excess of several million dollars n

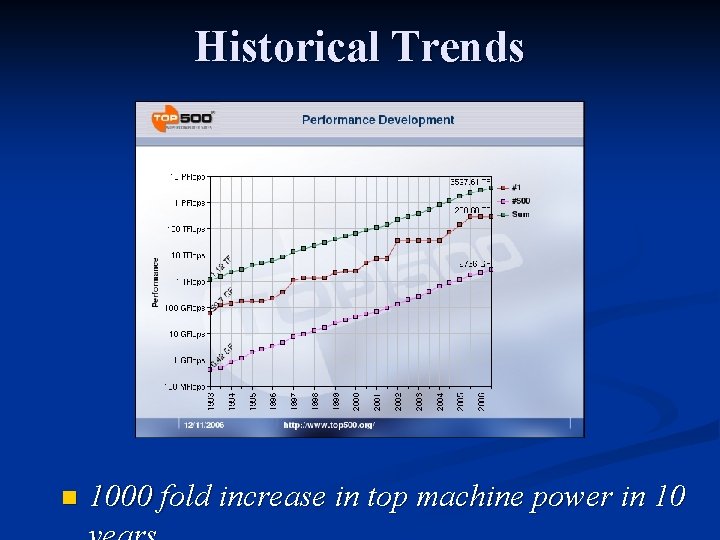
Historical Trends n 1000 fold increase in top machine power in 10

Cold War Era n US government funding supported a great number of hardware producers n Also fostered research into alternative architectures n Encouraged people to think!

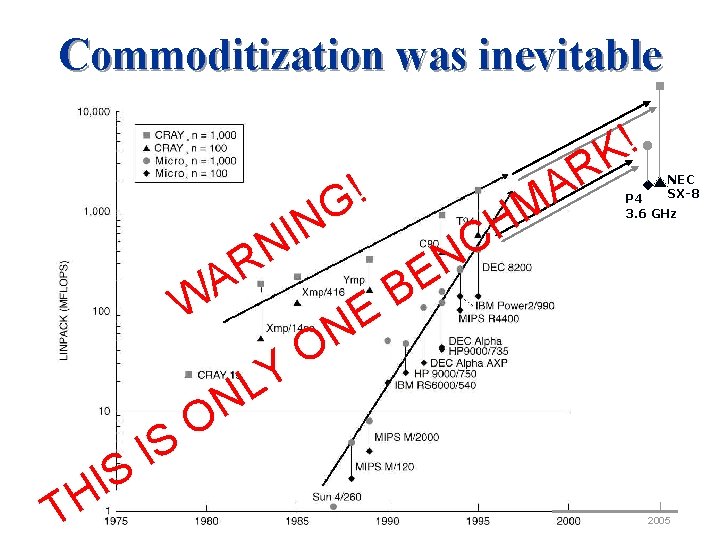
Post-Cold War Era Shrinking research budgets n Amalgamation n Vector systems become specialized n Parallel-Scalar processors become the mode n Architecture/processor research appears largely dormant n

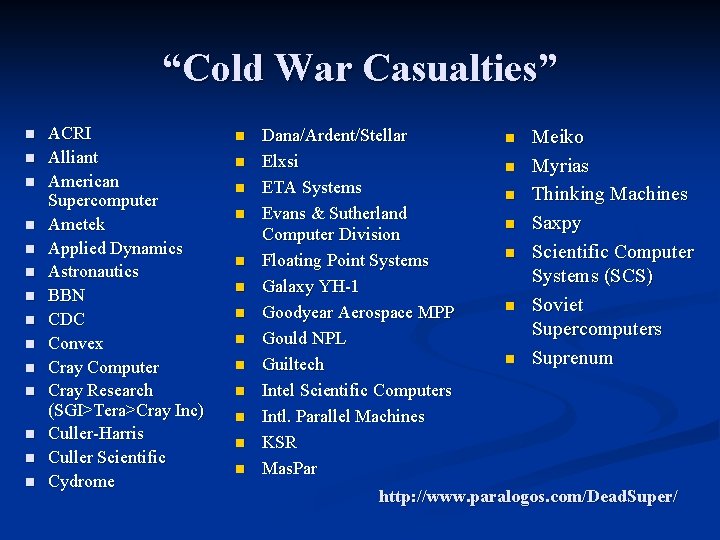
“Cold War Casualties” n n n n ACRI Alliant American Supercomputer Ametek Applied Dynamics Astronautics BBN CDC Convex Cray Computer Cray Research (SGI>Tera>Cray Inc) Culler-Harris Culler Scientific Cydrome n n n n Dana/Ardent/Stellar Elxsi ETA Systems Evans & Sutherland Computer Division Floating Point Systems Galaxy YH-1 Goodyear Aerospace MPP Gould NPL Guiltech Intel Scientific Computers Intl. Parallel Machines KSR Mas. Par n n n n Meiko Myrias Thinking Machines Saxpy Scientific Computer Systems (SCS) Soviet Supercomputers Suprenum http: //www. paralogos. com/Dead. Super/

Commoditization was inevitable ! K ! G N I N W T S I H IS R A Y L N E N O M H C N R A NEC SX-8 P 4 3. 6 GHz E B O 2005

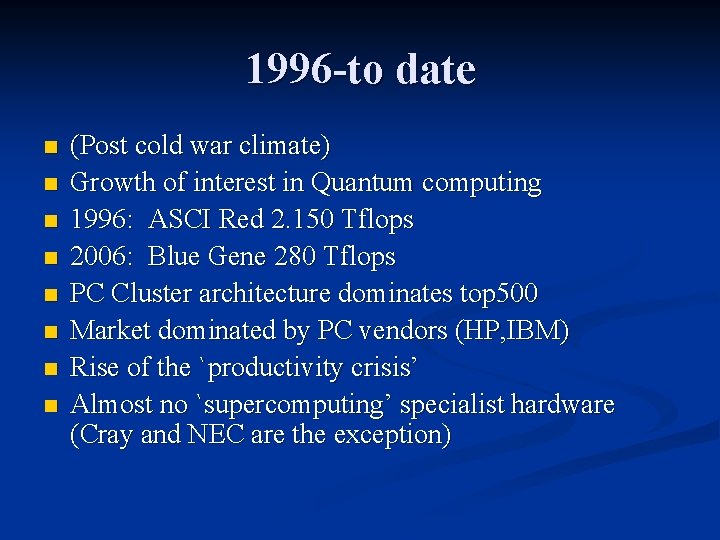
1996 -to date n n n n (Post cold war climate) Growth of interest in Quantum computing 1996: ASCI Red 2. 150 Tflops 2006: Blue Gene 280 Tflops PC Cluster architecture dominates top 500 Market dominated by PC vendors (HP, IBM) Rise of the `productivity crisis’ Almost no `supercomputing’ specialist hardware (Cray and NEC are the exception)

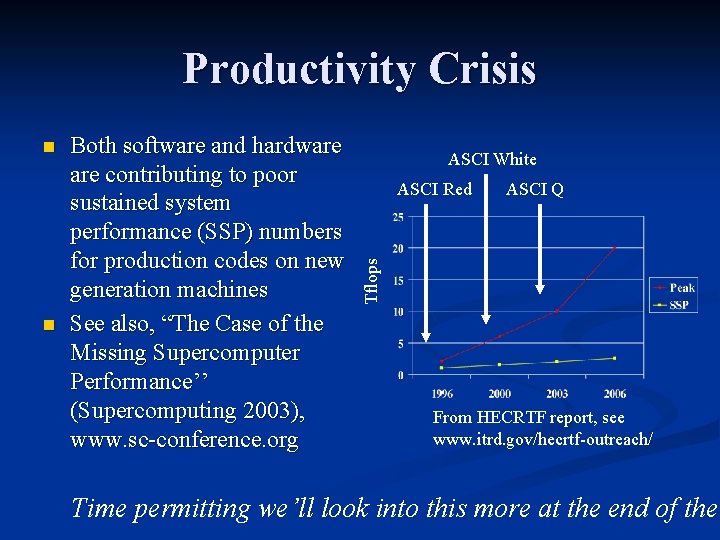
Productivity Crisis n Both software and hardware contributing to poor sustained system performance (SSP) numbers for production codes on new generation machines See also, “The Case of the Missing Supercomputer Performance’’ (Supercomputing 2003), www. sc-conference. org ASCI White ASCI Red ASCI Q Tflops n From HECRTF report, see www. itrd. gov/hecrtf-outreach/ Time permitting we’ll look into this more at the end of the

Lies, damn lies, and benchmarks Is gauging the speed of a computer on one program really relevant? n The HPL benchmark has very regular data access and disguises problems that may be inherent in machine designs n Starting to create a real problem for procurement: top 500 position attracts cachet even if a machine is not particularly easy to use n

The future The success of the Earth simulator has driven all of this discussion n n Debate about whether using commodity components is a false economy High-End Computing Revitalization Task Force report to US government More significant investment in new architectures? Future may see the rise of new machine designs All depends on the users though, if we focus too strongly on top 500 numbers we won’t get the machines we want (and need!)

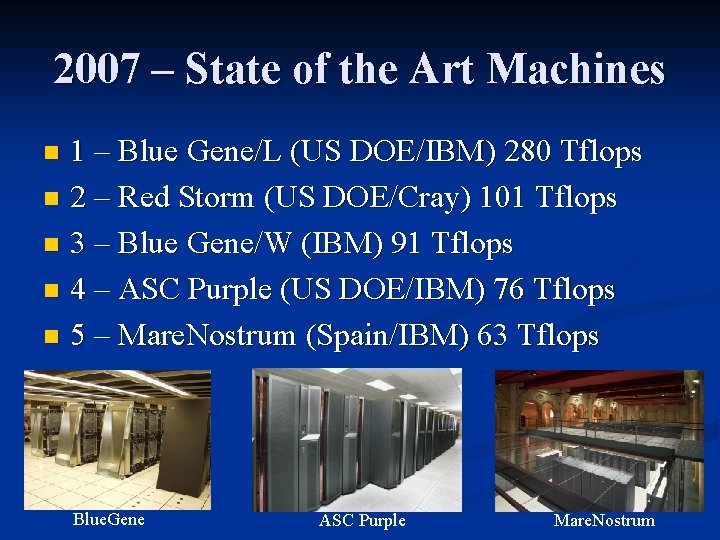
2007 – State of the Art Machines 1 – Blue Gene/L (US DOE/IBM) 280 Tflops n 2 – Red Storm (US DOE/Cray) 101 Tflops n 3 – Blue Gene/W (IBM) 91 Tflops n 4 – ASC Purple (US DOE/IBM) 76 Tflops n 5 – Mare. Nostrum (Spain/IBM) 63 Tflops n Blue. Gene ASC Purple Mare. Nostrum

National Picture n Since 2000, over 240 million dollars has been invested in academic HPC in Canada WESTGRID CLUMEQ RQCHP ACENET HPCVL SHARCNET

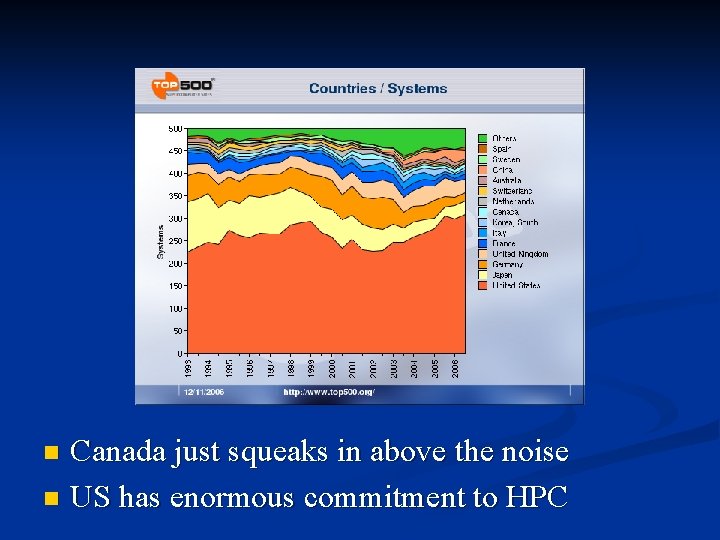
Canada just squeaks in above the noise n US has enormous commitment to HPC n

http: //www. c 3. ca C 3. ca The Canadian Computational Colaboratory (C 3) oversees allocation of funds and ‘represents’ HPC researchers across the country n 20% of cycles at all consortia are supposed to be devoted to external users n In Ontario agreements between HPCVL and SHARCNET will hopefully allow all Ontario based researchers to use both facilities (different hardware orientations with the two) n C 3 represents you – make yourself hea

LRP for HPC & the National Platforms Fund n Long range plan for HPC in Canada n n Used to lobby government on funding decisions for HPC n n http: //www. c 3. ca/LRP Canada Foundation for Innovation recently approved the “National Platforms Fund” - 88 million for the next 3 years Take a look – this plan directly affects your future n Key issue – we need funding for people and hardware

Summary Lecture 1 HPC is becoming a fundamental driver in the modern economy n Top 500 gives a list of the performance on a simple linear algebra benchmark n n n Not a good measure of overall machine performance National picture for Canada is good in terms of investment but we are lacking HQP

Part 2: Benchmarking CPU architecture recap n Why is benchmarking important n “Theory of benchmarking” n STREAM n LINPACK (& HPL) n SPEC n HPC Challenge Suite n

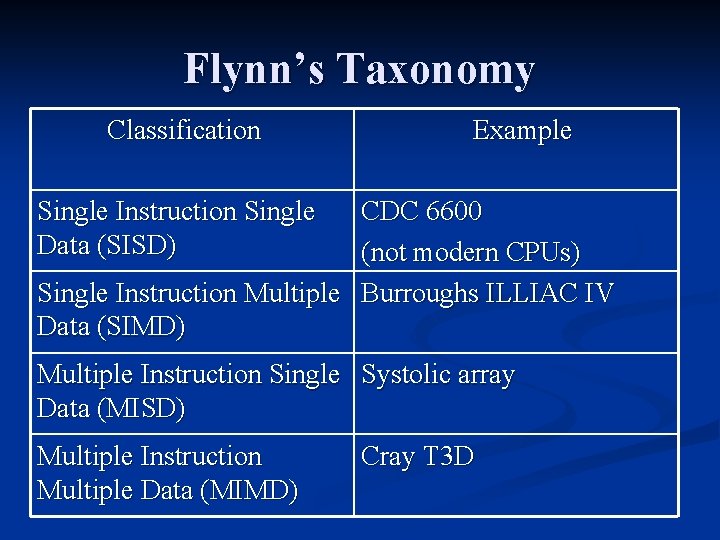
Flynn’s Taxonomy Classification Example Single Instruction Single Data (SISD) CDC 6600 (not modern CPUs) Single Instruction Multiple Burroughs ILLIAC IV Data (SIMD) Multiple Instruction Single Systolic array Data (MISD) Multiple Instruction Multiple Data (MIMD) Cray T 3 D

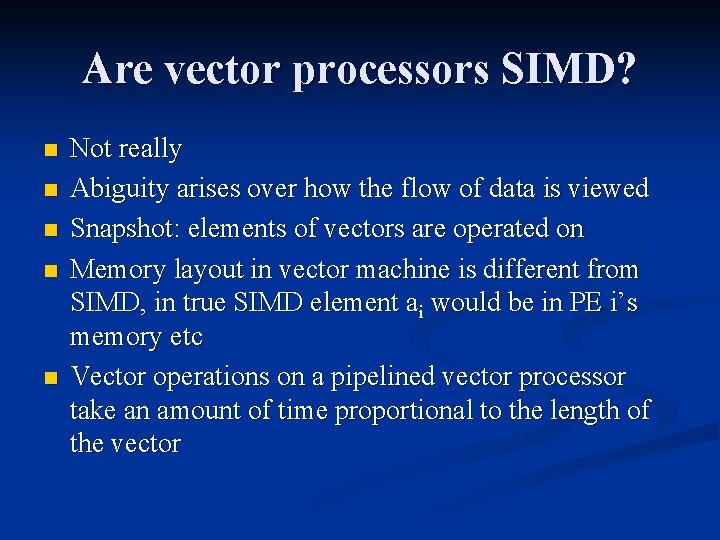
Are vector processors SIMD? n n n Not really Abiguity arises over how the flow of data is viewed Snapshot: elements of vectors are operated on Memory layout in vector machine is different from SIMD, in true SIMD element ai would be in PE i’s memory etc Vector operations on a pipelined vector processor take an amount of time proportional to the length of the vector

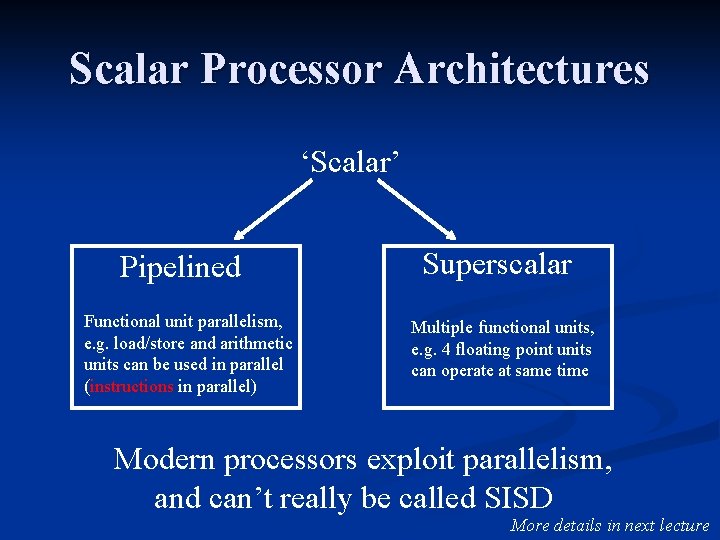
Scalar Processor Architectures ‘Scalar’ Pipelined Functional unit parallelism, e. g. load/store and arithmetic units can be used in parallel (instructions in parallel) Superscalar Multiple functional units, e. g. 4 floating point units can operate at same time Modern processors exploit parallelism, and can’t really be called SISD More details in next lecture

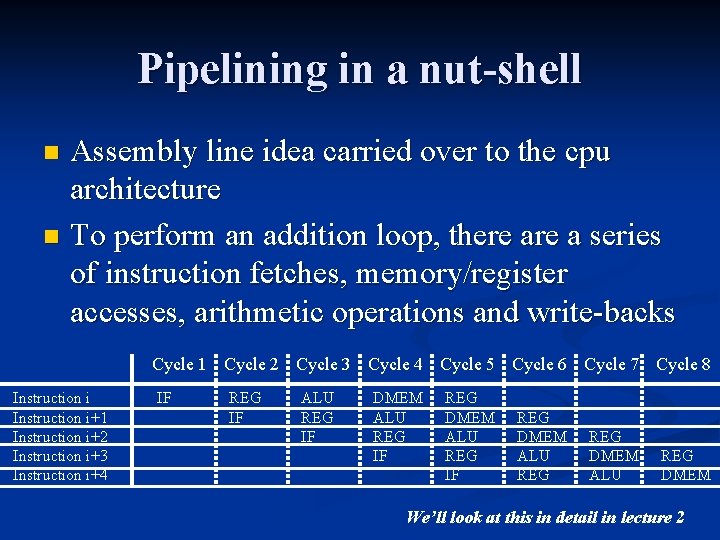
Pipelining in a nut-shell Assembly line idea carried over to the cpu architecture n To perform an addition loop, there a series of instruction fetches, memory/register accesses, arithmetic operations and write-backs n Cycle 1 Cycle 2 Cycle 3 Cycle 4 Cycle 5 Cycle 6 Cycle 7 Cycle 8 Instruction i+1 Instruction i+2 Instruction i+3 Instruction i+4 IF REG IF ALU REG IF DMEM ALU REG IF REG DMEM ALU REG DMEM We’ll look at this in detail in lecture 2

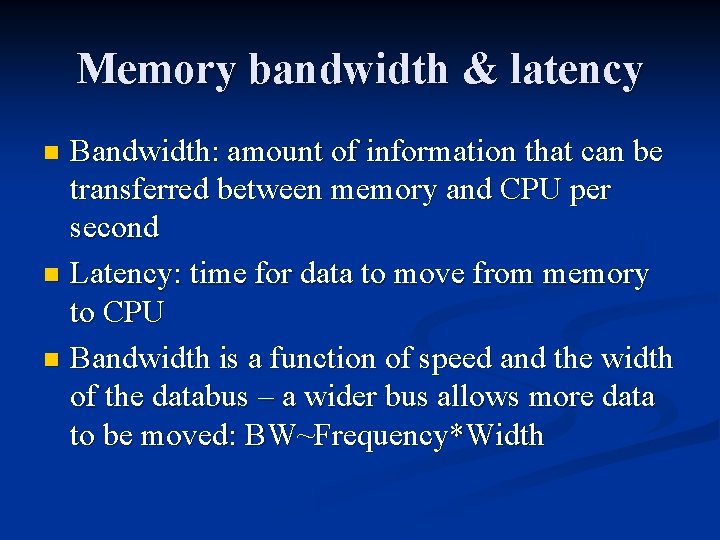
Memory bandwidth & latency Bandwidth: amount of information that can be transferred between memory and CPU per second n Latency: time for data to move from memory to CPU n Bandwidth is a function of speed and the width of the databus – a wider bus allows more data to be moved: BW~Frequency*Width n

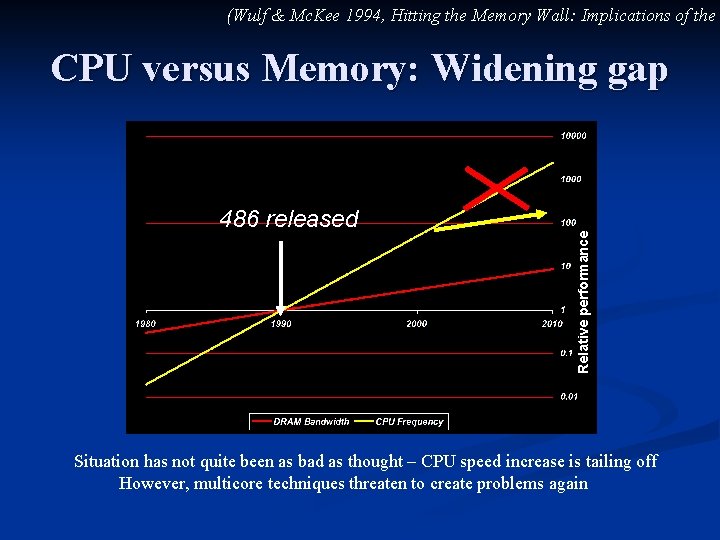
(Wulf & Mc. Kee 1994, Hitting the Memory Wall: Implications of the 486 released Relative performance CPU versus Memory: Widening gap Situation has not quite been as bad as thought – CPU speed increase is tailing off However, multicore techniques threaten to create problems again

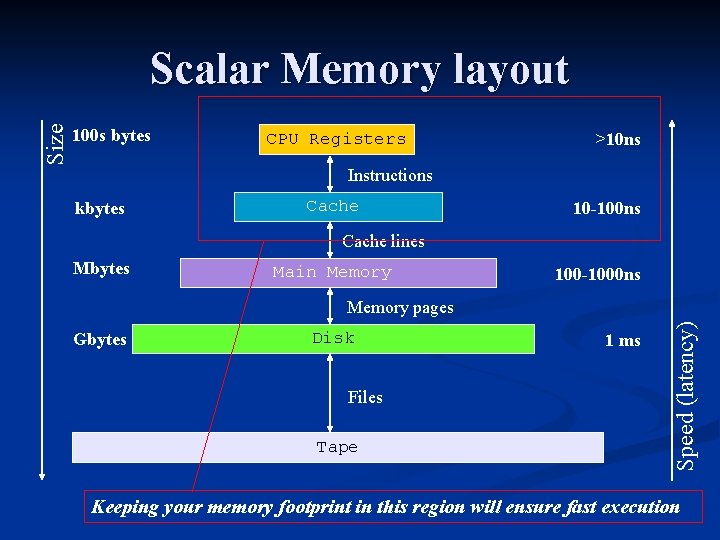
100 s bytes CPU Registers >10 ns Instructions kbytes Cache 10 -100 ns Cache lines Mbytes Main Memory 100 -1000 ns Memory pages Gbytes Disk Files Tape 1 ms Speed (latency) Size Scalar Memory layout Keeping your memory footprint in this region will ensure fast execution

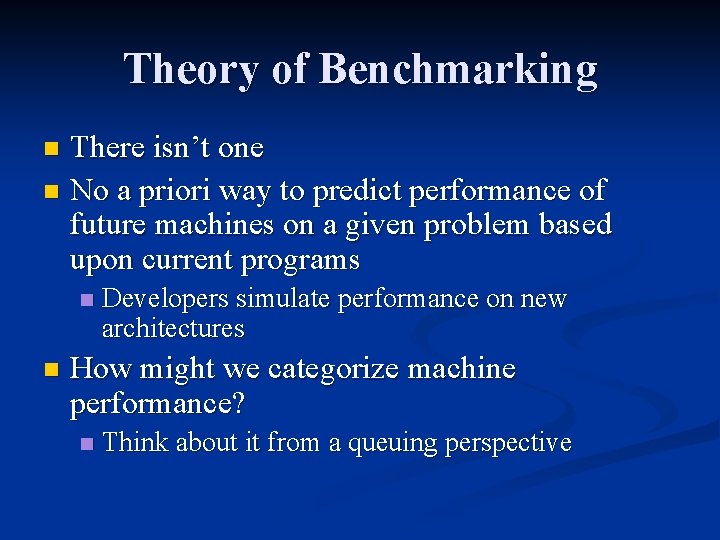
Theory of Benchmarking There isn’t one n No a priori way to predict performance of future machines on a given problem based upon current programs n n n Developers simulate performance on new architectures How might we categorize machine performance? n Think about it from a queuing perspective

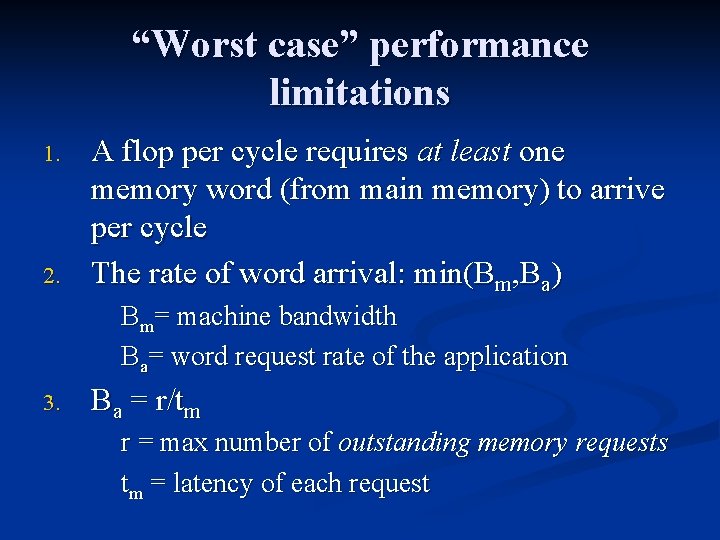
“Worst case” performance limitations 1. 2. A flop per cycle requires at least one memory word (from main memory) to arrive per cycle The rate of word arrival: min(Bm, Ba) Bm= machine bandwidth Ba= word request rate of the application 3. Ba = r/tm r = max number of outstanding memory requests tm = latency of each request

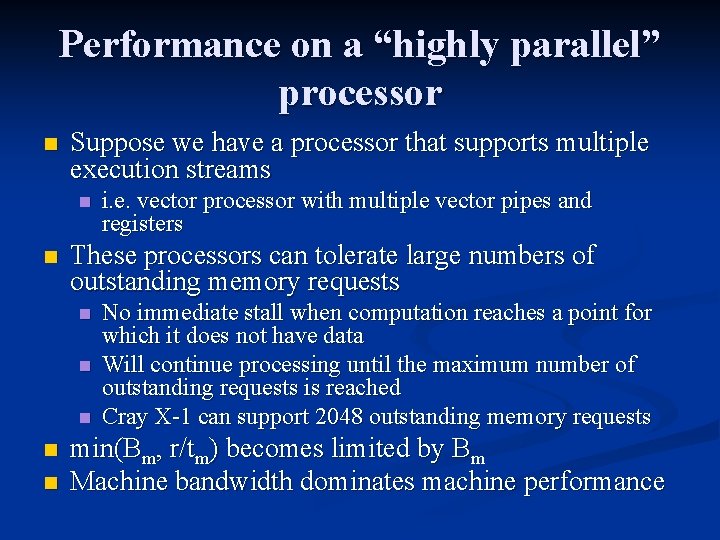
Performance on a “highly parallel” processor n Suppose we have a processor that supports multiple execution streams n n These processors can tolerate large numbers of outstanding memory requests n n n i. e. vector processor with multiple vector pipes and registers No immediate stall when computation reaches a point for which it does not have data Will continue processing until the maximum number of outstanding requests is reached Cray X-1 can support 2048 outstanding memory requests min(Bm, r/tm) becomes limited by Bm Machine bandwidth dominates machine performance

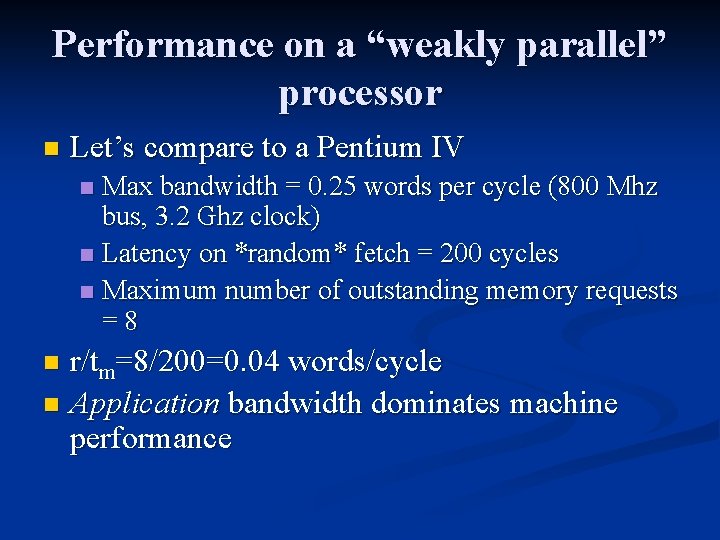
Performance on a “weakly parallel” processor n Let’s compare to a Pentium IV Max bandwidth = 0. 25 words per cycle (800 Mhz bus, 3. 2 Ghz clock) n Latency on *random* fetch = 200 cycles n Maximum number of outstanding memory requests =8 n r/tm=8/200=0. 04 words/cycle n Application bandwidth dominates machine performance n

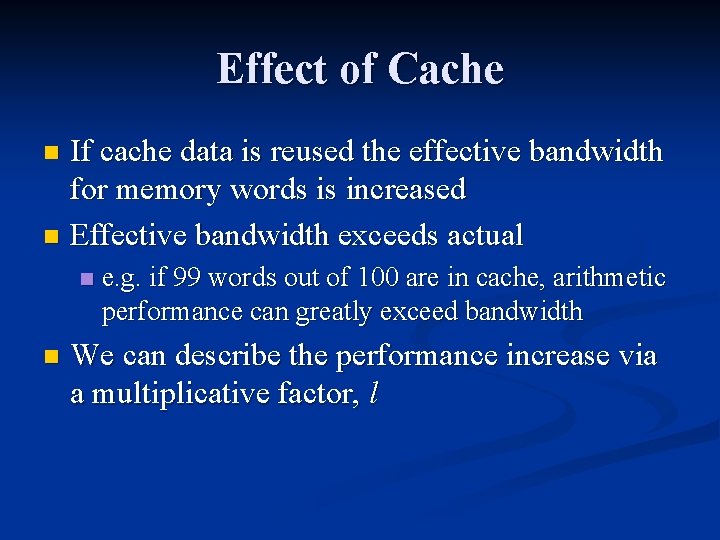
Effect of Cache If cache data is reused the effective bandwidth for memory words is increased n Effective bandwidth exceeds actual n n n e. g. if 99 words out of 100 are in cache, arithmetic performance can greatly exceed bandwidth We can describe the performance increase via a multiplicative factor, l

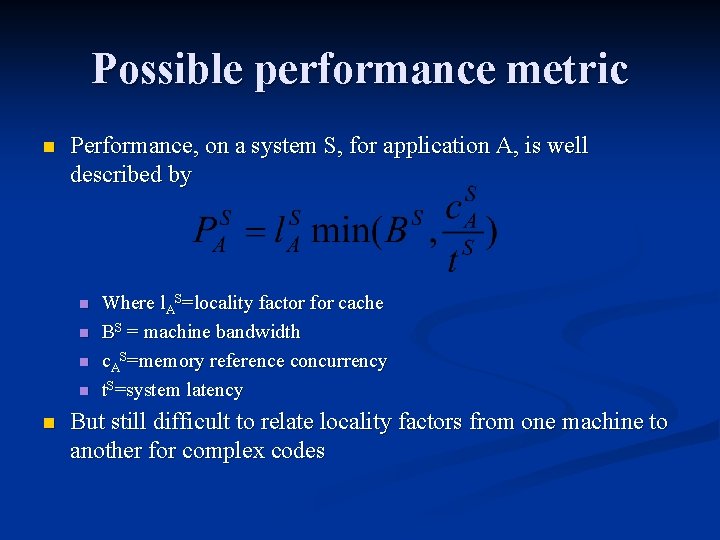
Possible performance metric n Performance, on a system S, for application A, is well described by n n n Where l. AS=locality factor for cache BS = machine bandwidth c. AS=memory reference concurrency t. S=system latency But still difficult to relate locality factors from one machine to another for complex codes

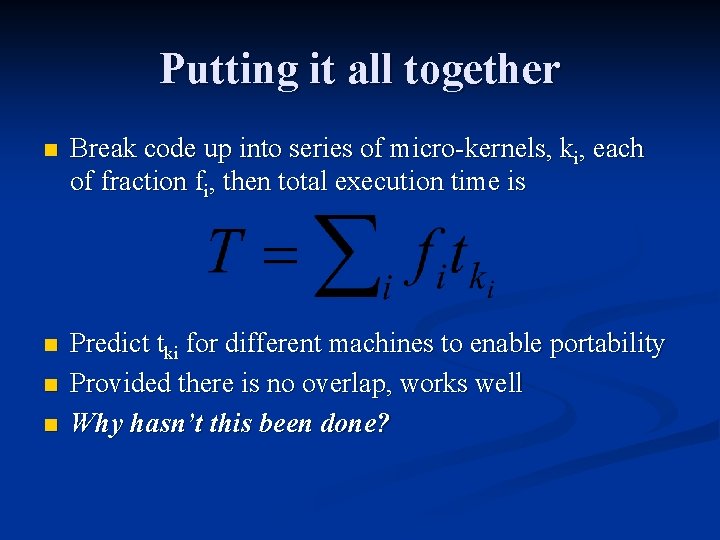
Putting it all together n Break code up into series of micro-kernels, ki, each of fraction fi, then total execution time is n Predict tki for different machines to enable portability Provided there is no overlap, works well Why hasn’t this been done? n n

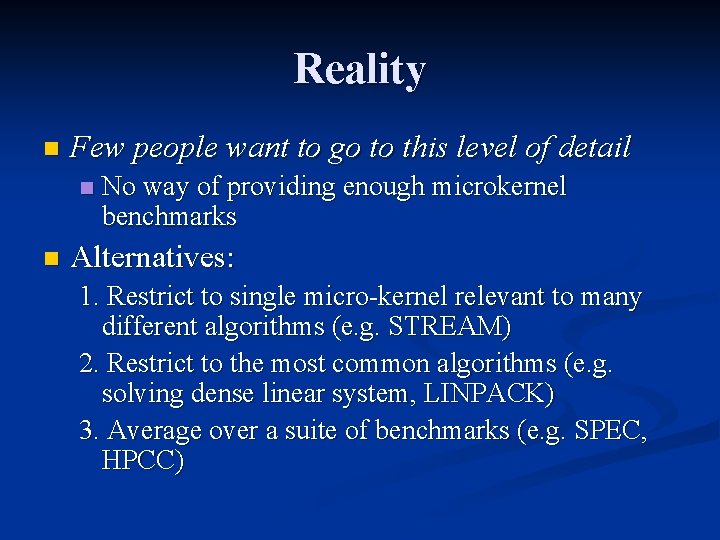
Reality n Few people want to go to this level of detail n n No way of providing enough microkernel benchmarks Alternatives: 1. Restrict to single micro-kernel relevant to many different algorithms (e. g. STREAM) 2. Restrict to the most common algorithms (e. g. solving dense linear system, LINPACK) 3. Average over a suite of benchmarks (e. g. SPEC, HPCC)

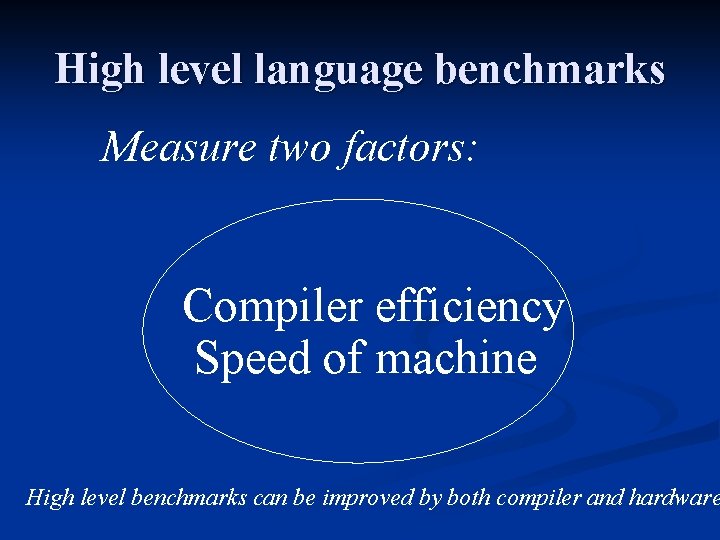
High level language benchmarks Measure two factors: Compiler efficiency Speed of machine High level benchmarks can be improved by both compiler and hardware

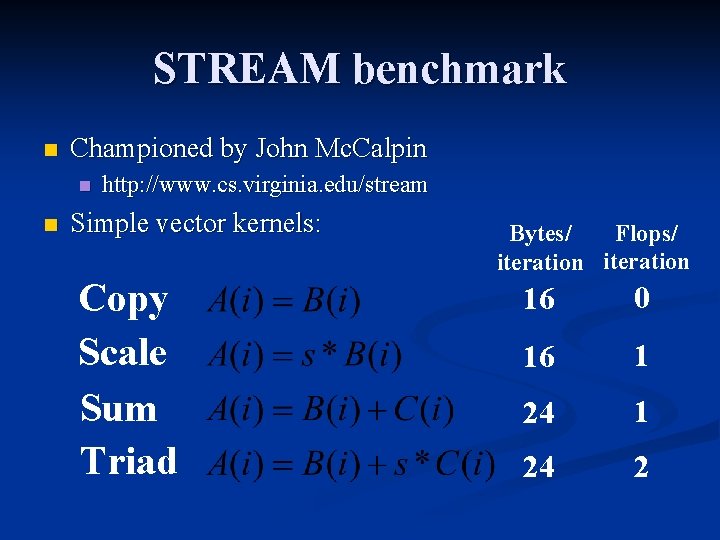
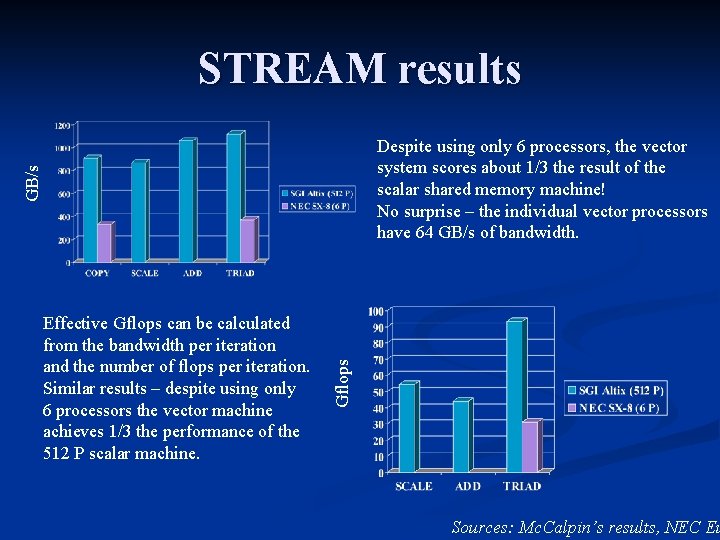
STREAM benchmark n Championed by John Mc. Calpin n n http: //www. cs. virginia. edu/stream Simple vector kernels: Copy Scale Sum Triad Flops/ Bytes/ iteration 16 0 16 1 24 2

STREAM results Effective Gflops can be calculated from the bandwidth per iteration and the number of flops per iteration. Similar results – despite using only 6 processors the vector machine achieves 1/3 the performance of the 512 P scalar machine. Gflops GB/s Despite using only 6 processors, the vector system scores about 1/3 the result of the scalar shared memory machine! No surprise – the individual vector processors have 64 GB/s of bandwidth. Sources: Mc. Calpin’s results, NEC Eu

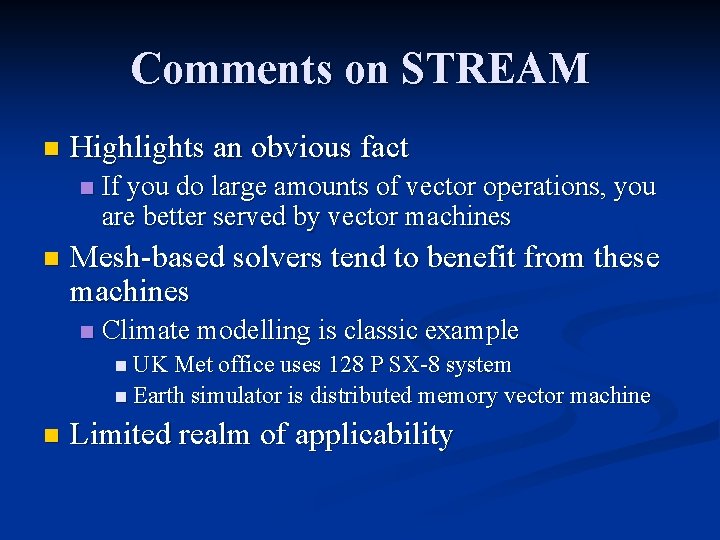
Comments on STREAM n Highlights an obvious fact n n If you do large amounts of vector operations, you are better served by vector machines Mesh-based solvers tend to benefit from these machines n Climate modelling is classic example n UK Met office uses 128 P SX-8 system n Earth simulator is distributed memory vector machine n Limited realm of applicability

LINPACK n Very popular benchmark, dating back to late 70’s Very useful historical guide to machine performance n Top 500 benchmark n n Championed by Jack Dongarra www. netlib. org/linpack n www. netlib. org/benchmark/performance. ps n n Single CPU, shared memory parallel and distributed memory parallel versions (“HPL”)

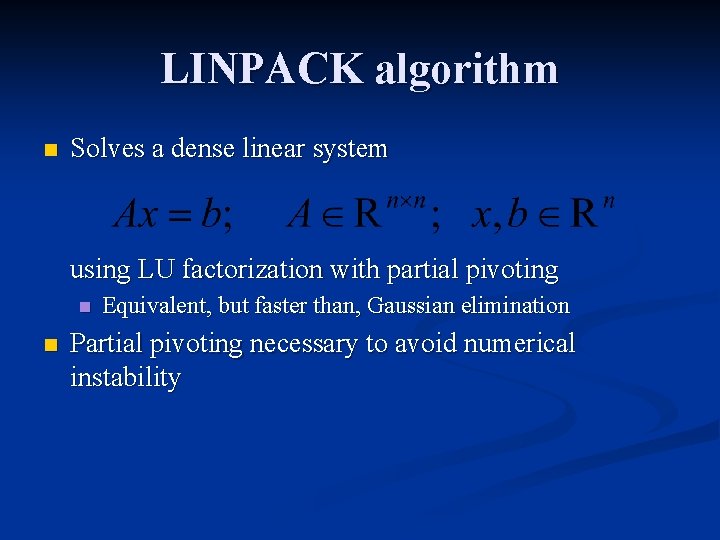
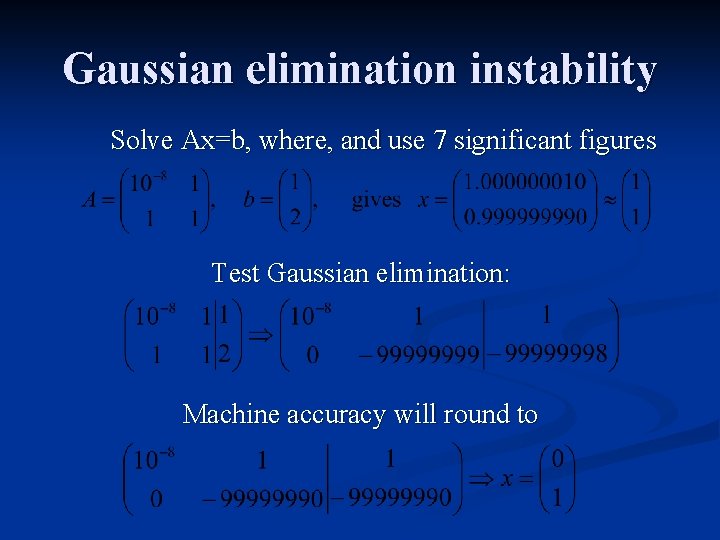
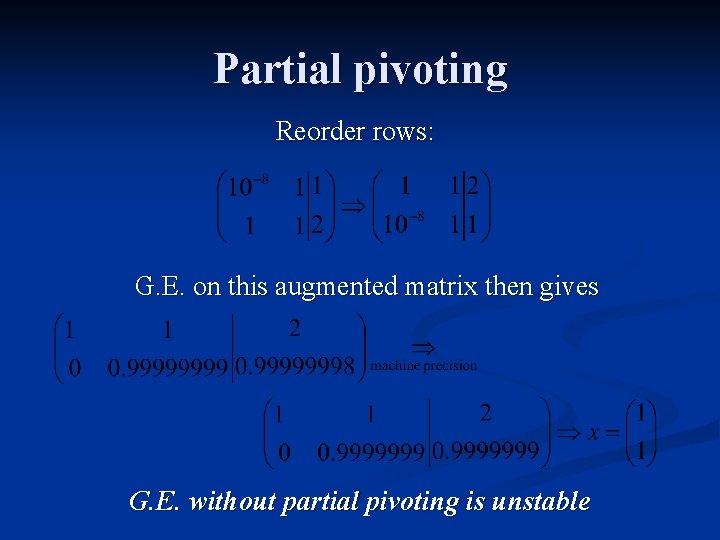
LINPACK algorithm n Solves a dense linear system using LU factorization with partial pivoting n n Equivalent, but faster than, Gaussian elimination Partial pivoting necessary to avoid numerical instability

Gaussian elimination instability Solve Ax=b, where, and use 7 significant figures Test Gaussian elimination: Machine accuracy will round to

LU factorization n n For non-singular matrix, for which all upper left submatrices are non-singular, there exists a decomposition A=LU Solving Ax=b then amounts to solving L(Ux)=Ly=b, then Ux=y n Get y by forward substituion n The get x by back substitution

Partial pivoting Reorder rows: G. E. on this augmented matrix then gives G. E. without partial pivoting is unstable

Forming the LU matrices e. g. for i=1, a 1 j=u 1 j, while for i=2, a 21=l 21 u 11, a 2 j=l 21 u 1 j+u 2 j In general See Numerical Recipes for Crout’s algorith

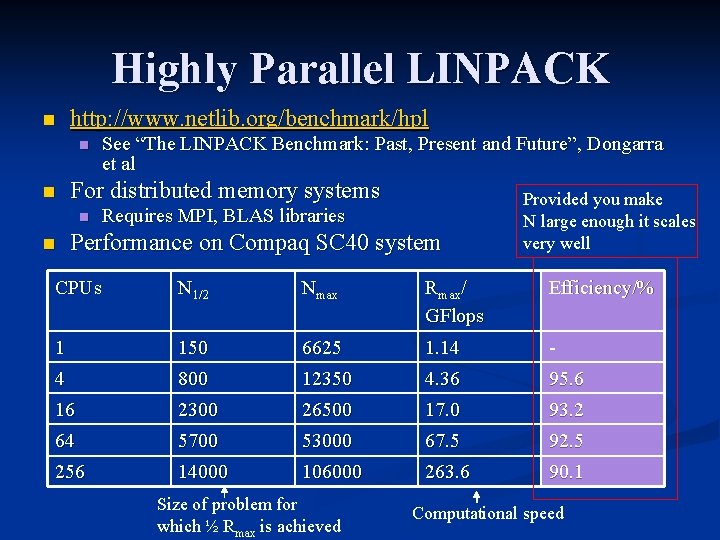
Highly Parallel LINPACK n http: //www. netlib. org/benchmark/hpl n n For distributed memory systems n n See “The LINPACK Benchmark: Past, Present and Future”, Dongarra et al Requires MPI, BLAS libraries Performance on Compaq SC 40 system Provided you make N large enough it scales very well CPUs N 1/2 Nmax Rmax/ GFlops Efficiency/% 1 150 6625 1. 14 - 4 800 12350 4. 36 95. 6 16 2300 26500 17. 0 93. 2 64 5700 53000 67. 5 92. 5 256 14000 106000 263. 6 90. 1 Size of problem for which ½ Rmax is achieved Computational speed

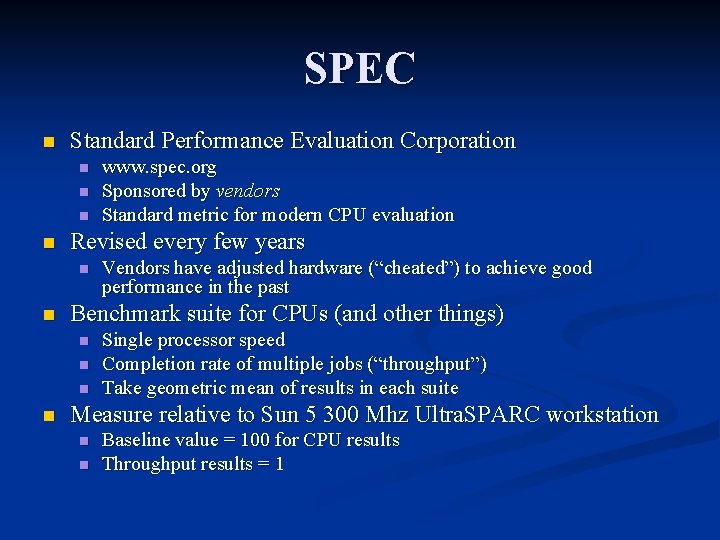
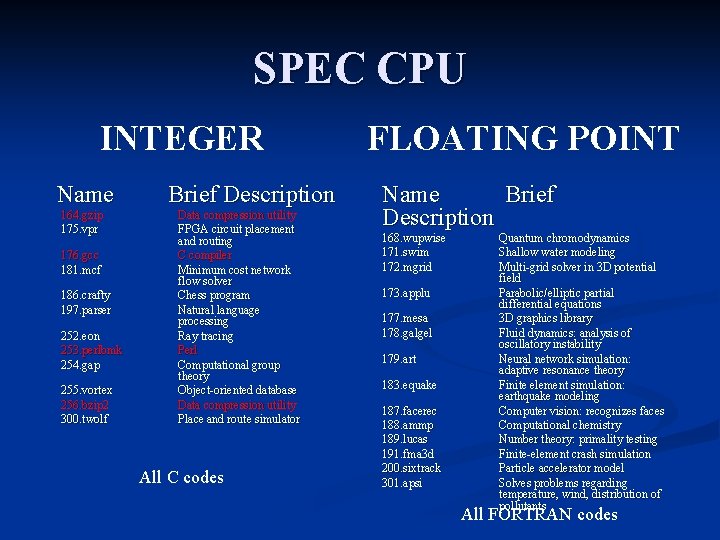
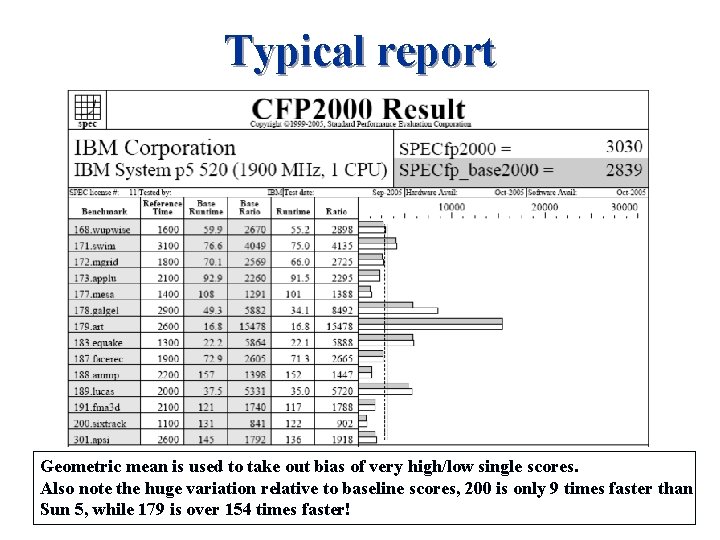
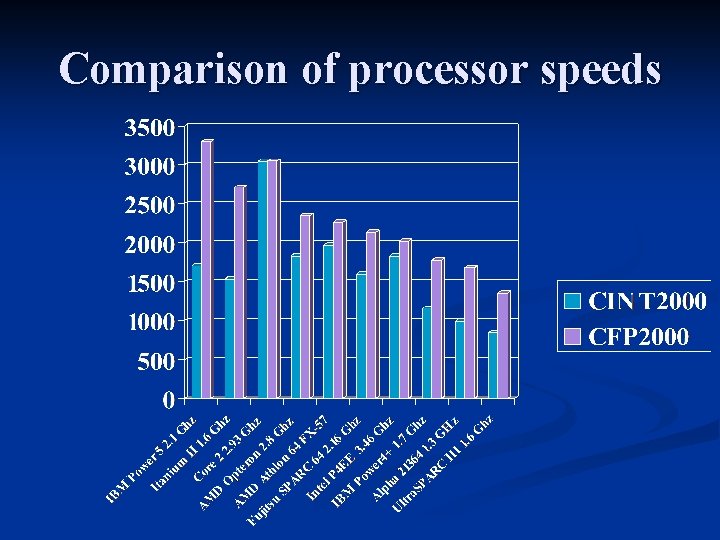
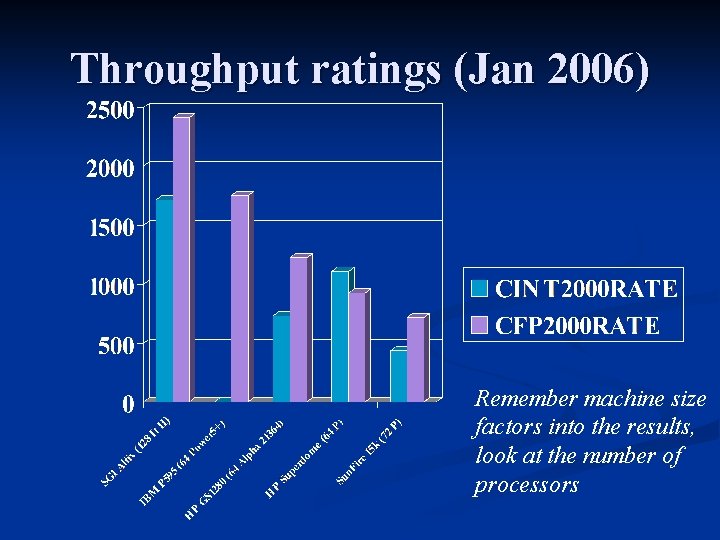
SPEC n Standard Performance Evaluation Corporation n n Revised every few years n n Vendors have adjusted hardware (“cheated”) to achieve good performance in the past Benchmark suite for CPUs (and other things) n n www. spec. org Sponsored by vendors Standard metric for modern CPU evaluation Single processor speed Completion rate of multiple jobs (“throughput”) Take geometric mean of results in each suite Measure relative to Sun 5 300 Mhz Ultra. SPARC workstation n n Baseline value = 100 for CPU results Throughput results = 1

SPEC CPU INTEGER Name 164. gzip 175. vpr 176. gcc 181. mcf 186. crafty 197. parser 252. eon 253. perlbmk 254. gap 255. vortex 256. bzip 2 300. twolf Brief Description Data compression utility FPGA circuit placement and routing C compiler Minimum cost network flow solver Chess program Natural language processing Ray tracing Perl Computational group theory Object-oriented database Data compression utility Place and route simulator All C codes FLOATING POINT Name Brief Description 168. wupwise 171. swim 172. mgrid 173. applu 177. mesa 178. galgel 179. art 183. equake 187. facerec 188. ammp 189. lucas 191. fma 3 d 200. sixtrack 301. apsi Quantum chromodynamics Shallow water modeling Multi-grid solver in 3 D potential field Parabolic/elliptic partial differential equations 3 D graphics library Fluid dynamics: analysis of oscillatory instability Neural network simulation: adaptive resonance theory Finite element simulation: earthquake modeling Computer vision: recognizes faces Computational chemistry Number theory: primality testing Finite-element crash simulation Particle accelerator model Solves problems regarding temperature, wind, distribution of pollutants All FORTRAN codes

Typical report Geometric mean is used to take out bias of very high/low single scores. Also note the huge variation relative to baseline scores, 200 is only 9 times faster than Sun 5, while 179 is over 154 times faster!

Comparison of processor speeds

Throughput ratings (Jan 2006) Remember machine size factors into the results, look at the number of processors

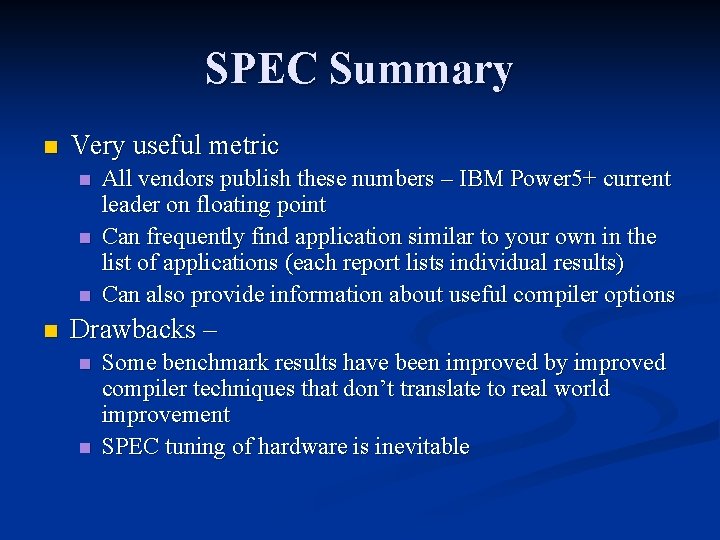
SPEC Summary n Very useful metric n n All vendors publish these numbers – IBM Power 5+ current leader on floating point Can frequently find application similar to your own in the list of applications (each report lists individual results) Can also provide information about useful compiler options Drawbacks – n n Some benchmark results have been improved by improved compiler techniques that don’t translate to real world improvement SPEC tuning of hardware is inevitable

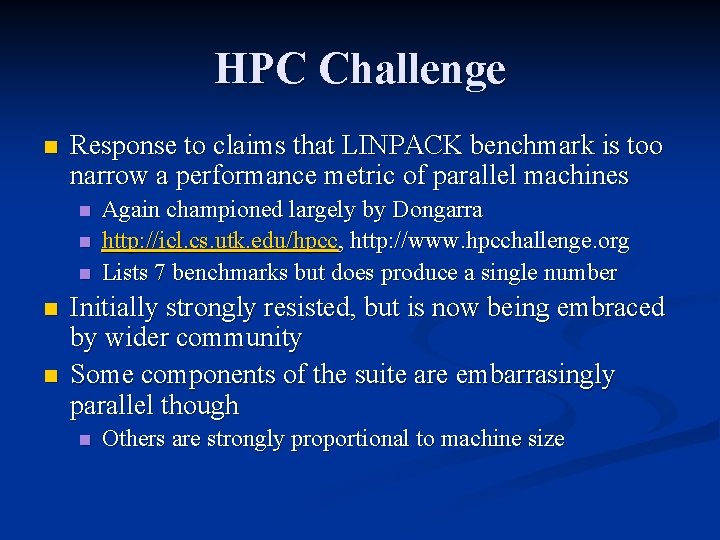
HPC Challenge n Response to claims that LINPACK benchmark is too narrow a performance metric of parallel machines n n n Again championed largely by Dongarra http: //icl. cs. utk. edu/hpcc, http: //www. hpcchallenge. org Lists 7 benchmarks but does produce a single number Initially strongly resisted, but is now being embraced by wider community Some components of the suite are embarrasingly parallel though n Others are strongly proportional to machine size

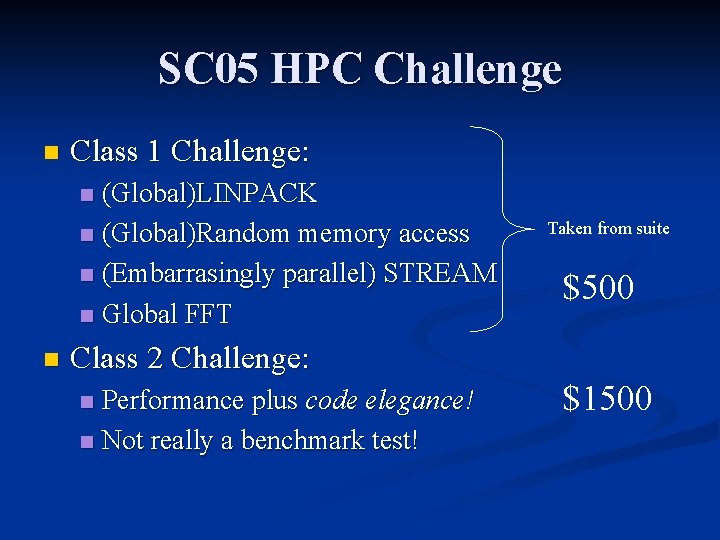
SC 05 HPC Challenge n Class 1 Challenge: (Global)LINPACK n (Global)Random memory access n (Embarrasingly parallel) STREAM n Global FFT n n Taken from suite $500 Class 2 Challenge: Performance plus code elegance! n Not really a benchmark test! n $1500

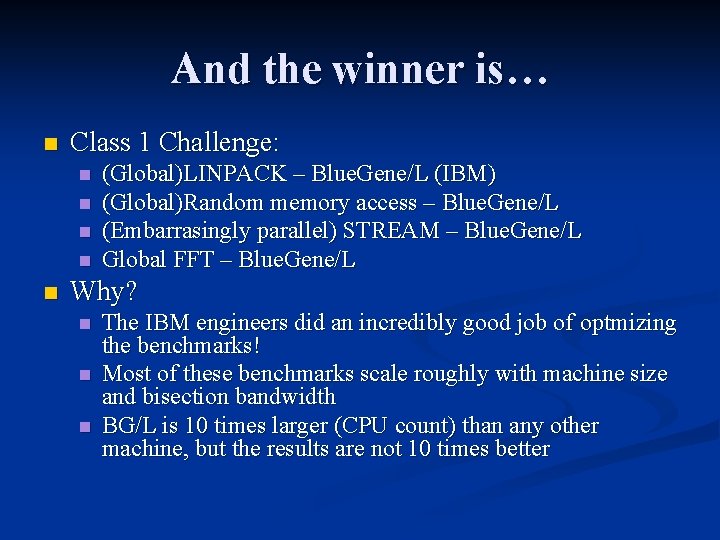
And the winner is… n Class 1 Challenge: n n n (Global)LINPACK – Blue. Gene/L (IBM) (Global)Random memory access – Blue. Gene/L (Embarrasingly parallel) STREAM – Blue. Gene/L Global FFT – Blue. Gene/L Why? n n n The IBM engineers did an incredibly good job of optmizing the benchmarks! Most of these benchmarks scale roughly with machine size and bisection bandwidth BG/L is 10 times larger (CPU count) than any other machine, but the results are not 10 times better

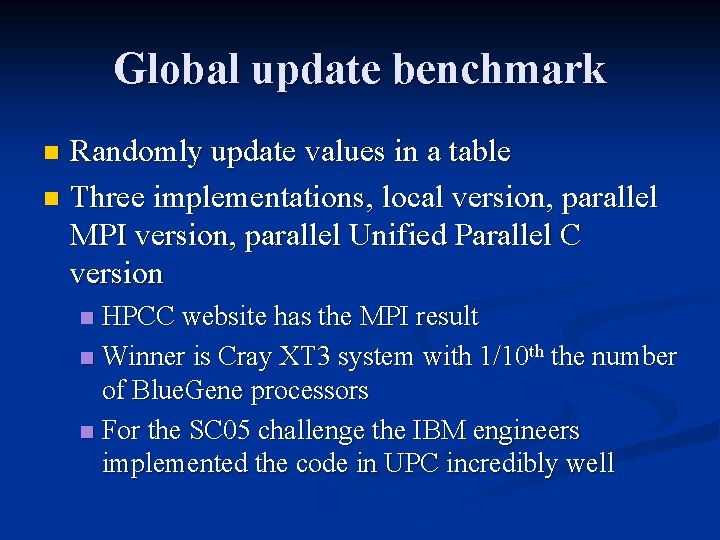
Global update benchmark Randomly update values in a table n Three implementations, local version, parallel MPI version, parallel Unified Parallel C version n HPCC website has the MPI result n Winner is Cray XT 3 system with 1/10 th the number of Blue. Gene processors n For the SC 05 challenge the IBM engineers implemented the code in UPC incredibly well n

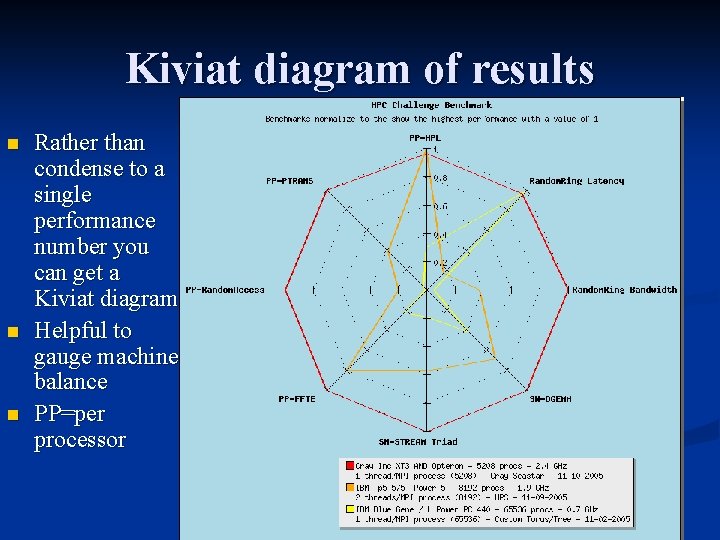
Kiviat diagram of results n n n Rather than condense to a single performance number you can get a Kiviat diagram Helpful to gauge machine balance PP=per processor

Summary Lecture 2 n No simple theory of performance n n CPU speed is reasonably well gauged by SPEC n n Large variations in performance for individual benchmarks though STREAM and LINPACK are more specialist applications n n Microkernels, applications and suites Do not make judgement solely on the basis of these HPC Challenge on the rise, but unlikely to take over from LINPACK for top 500

“Premature optimization is the root of all evil. ” (Donald Knuth) Part 3 Profiling and performance measurement n Why profile? n Can elucidate call tree quickly and efficiently if you are using legacy code n Will quickly find code ‘hotspots’ where most of the execution time is spent n May uncover hidden ‘bugs’ n Many programs follow the 80: 20 rule – 80% of execution time is spent in 20% of the code n

Profiling in wider context If you write proposals for supercomputing centres you will need to demonstrate: n 1. you understand the total time taken by your program, and how that time is allocated within the program during execution n 2. you understand the parallel scaling properties of the code you are using (look at this later) n

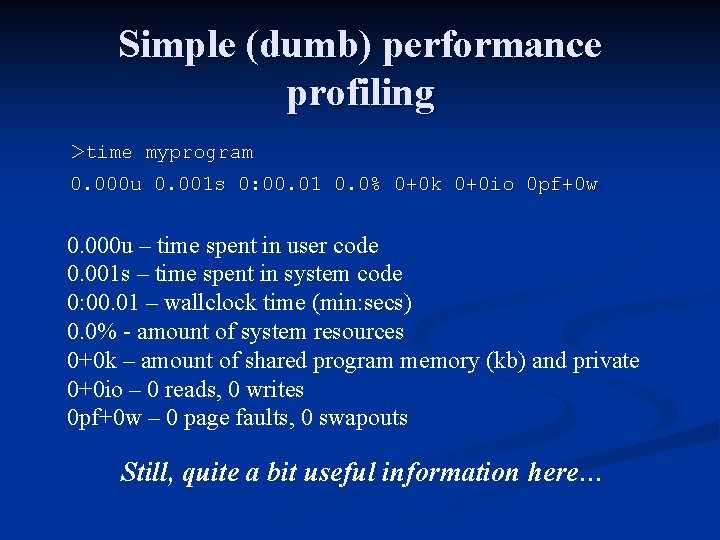
Simple (dumb) performance profiling >time myprogram 0. 000 u 0. 001 s 0: 00. 01 0. 0% 0+0 k 0+0 io 0 pf+0 w 0. 000 u – time spent in user code 0. 001 s – time spent in system code 0: 00. 01 – wallclock time (min: secs) 0. 0% - amount of system resources 0+0 k – amount of shared program memory (kb) and private 0+0 io – 0 reads, 0 writes 0 pf+0 w – 0 page faults, 0 swapouts Still, quite a bit useful information here…

Beyond time Overall run times useful – but need to go beyond this (avoid myopia) n Especially relevant given the unpredictability of performance for modern architectures: may have different relative execution times for parts of the code on different machines n

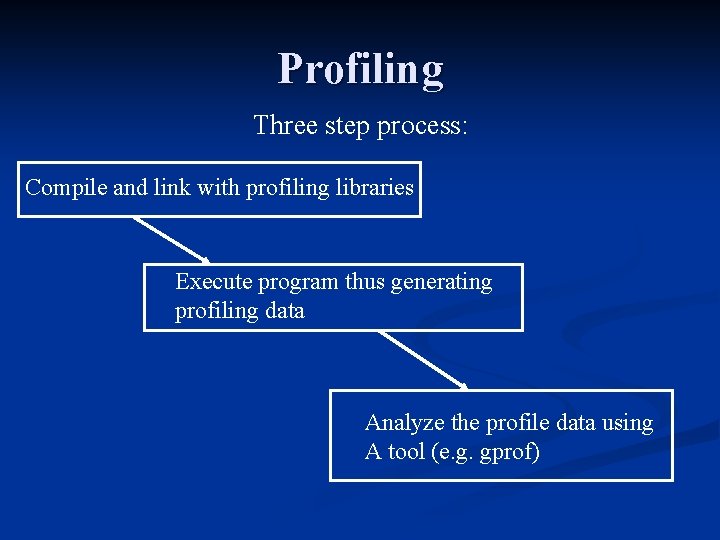
Profiling Three step process: Compile and link with profiling libraries Execute program thus generating profiling data Analyze the profile data using A tool (e. g. gprof)

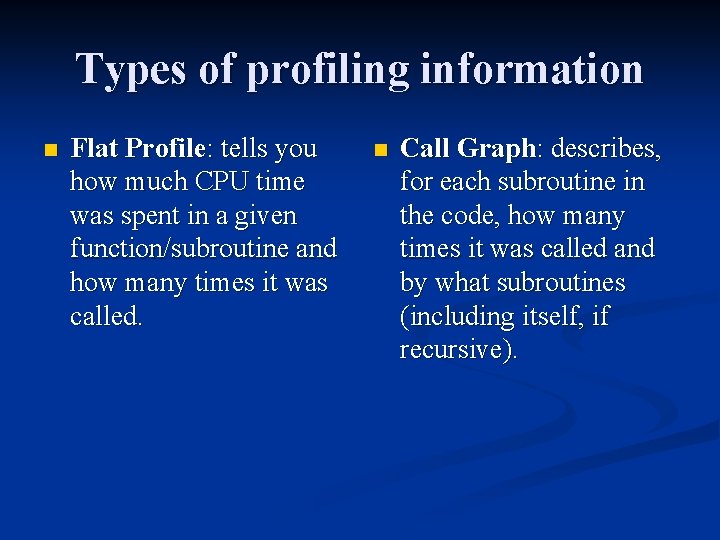
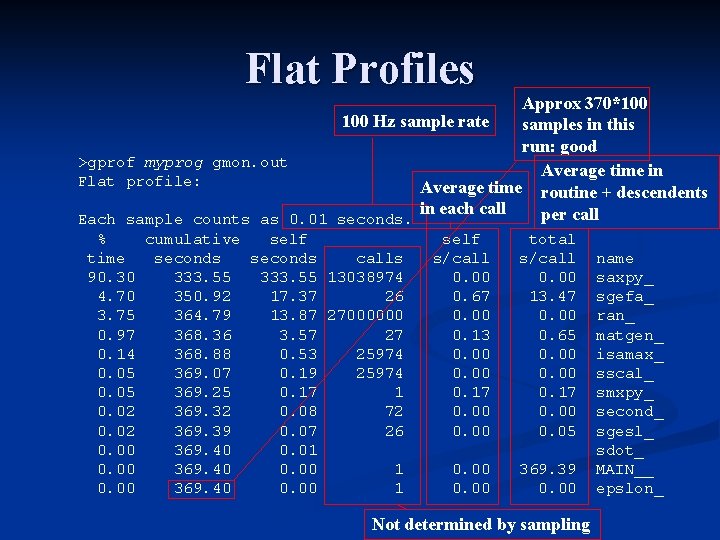
Types of profiling information n Flat Profile: tells you how much CPU time was spent in a given function/subroutine and how many times it was called. n Call Graph: describes, for each subroutine in the code, how many times it was called and by what subroutines (including itself, if recursive).

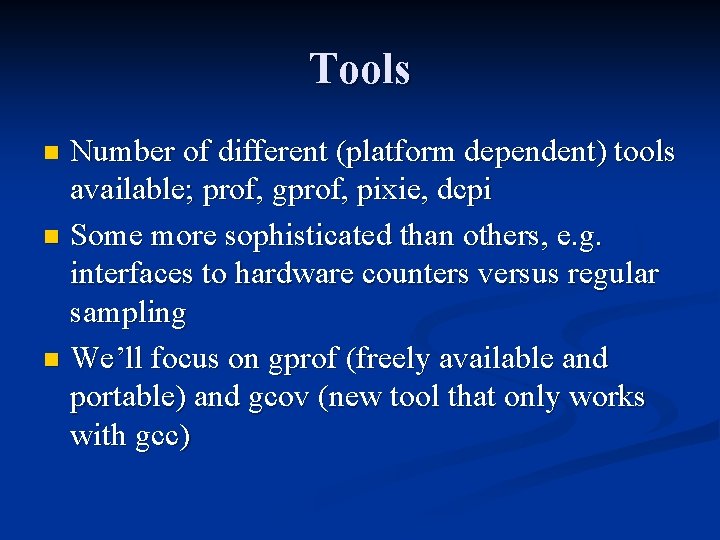
Tools Number of different (platform dependent) tools available; prof, gprof, pixie, dcpi n Some more sophisticated than others, e. g. interfaces to hardware counters versus regular sampling n We’ll focus on gprof (freely available and portable) and gcov (new tool that only works with gcc) n

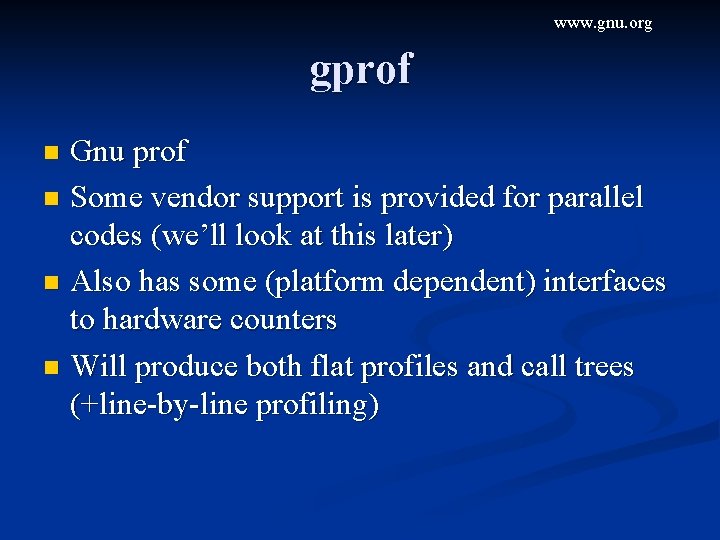
www. gnu. org gprof Gnu prof n Some vendor support is provided for parallel codes (we’ll look at this later) n Also has some (platform dependent) interfaces to hardware counters n Will produce both flat profiles and call trees (+line-by-line profiling) n

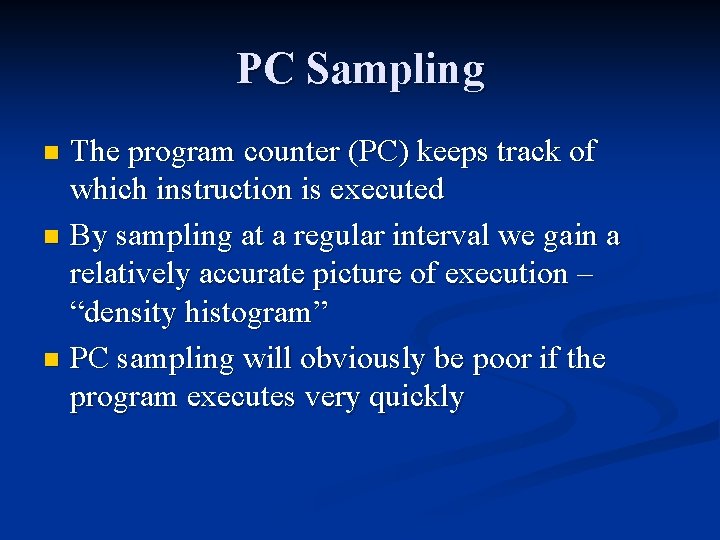
PC Sampling The program counter (PC) keeps track of which instruction is executed n By sampling at a regular interval we gain a relatively accurate picture of execution – “density histogram” n PC sampling will obviously be poor if the program executes very quickly n

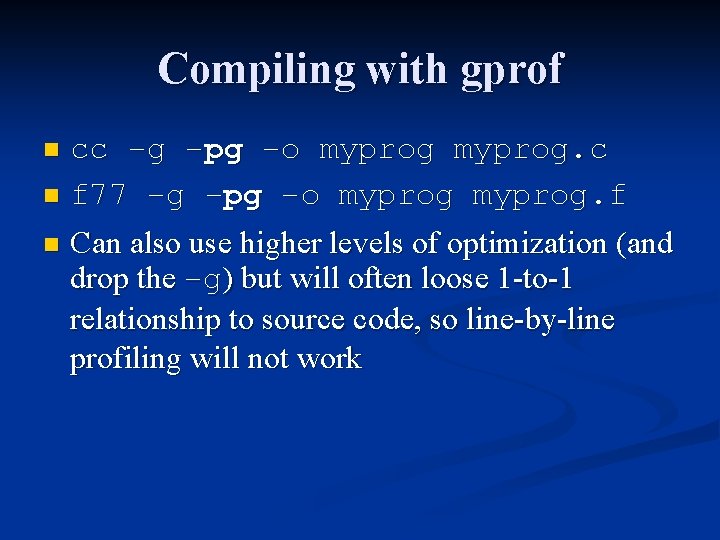
Compiling with gprof cc –g –pg –o myprog. c n f 77 –g –pg –o myprog. f n Can also use higher levels of optimization (and drop the –g) but will often loose 1 -to-1 relationship to source code, so line-by-line profiling will not work n

Flat Profiles Approx 370*100 Hz sample rate samples in this run: good >gprof myprog gmon. out Average time in Flat profile: Average time routine + descendents in each call per call Each sample counts as 0. 01 seconds. % cumulative self time seconds calls 90. 30 333. 55 13038974 4. 70 350. 92 17. 37 26 3. 75 364. 79 13. 87 27000000 0. 97 368. 36 3. 57 27 0. 14 368. 88 0. 53 25974 0. 05 369. 07 0. 19 25974 0. 05 369. 25 0. 17 1 0. 02 369. 32 0. 08 72 0. 02 369. 39 0. 07 26 0. 00 369. 40 0. 01 0. 00 369. 40 0. 00 1 self s/call 0. 00 0. 67 0. 00 0. 13 0. 00 0. 17 0. 00 total s/call 0. 00 13. 47 0. 00 0. 65 0. 00 0. 17 0. 00 0. 05 0. 00 369. 39 0. 00 Not determined by sampling name saxpy_ sgefa_ ran_ matgen_ isamax_ sscal_ smxpy_ second_ sgesl_ sdot_ MAIN__ epslon_
![Call GraphTree thackerphobos CISC 878 gprof graph 1000intel gmon out Call graph explanation follows Call Graph/Tree [thacker@phobos CISC 878]$ gprof --graph. /1000_intel gmon. out Call graph (explanation follows)](https://slidetodoc.com/presentation_image/d1b75dde4e620ab1010938a58ffc9da8/image-84.jpg)
Call Graph/Tree [thacker@phobos CISC 878]$ gprof --graph. /1000_intel gmon. out Call graph (explanation follows) Each subroutine gets its own index granularity: each sample hit covers 4 byte(s) for 0. 00% of 369. 40 seconds index % time self children called name 0. 00 369. 39 1/1 main [2] [1] 100. 00 369. 39 1 MAIN__ [1] 17. 37 332. 94 26/26 sgefa_ [3] 3. 57 13. 87 27/27 matgen_ [5] 0. 07 1. 33 26/26 sgesl_ [7] 0. 17 0. 00 1/1 smxpy_ [10] 0. 08 0. 00 72/72 second_ [11] 0. 00 1/1 epslon_ [13] -----------------------<spontaneous> [2] 100. 00 369. 39 main [2] 0. 00 369. 39 1/1 MAIN__ [1] -----------------------17. 37 332. 94 26/26 MAIN__ [1] [3] 94. 8 17. 37 332. 94 26 sgefa_ [3] 332. 22 0. 00 12987000/13038974 saxpy_ [4] 0. 53 0. 00 25974/25974 isamax_ [8] 0. 19 0. 00 25974/25974 sscal_ [9] ------------------------ Time spent in routine/children Parent Children

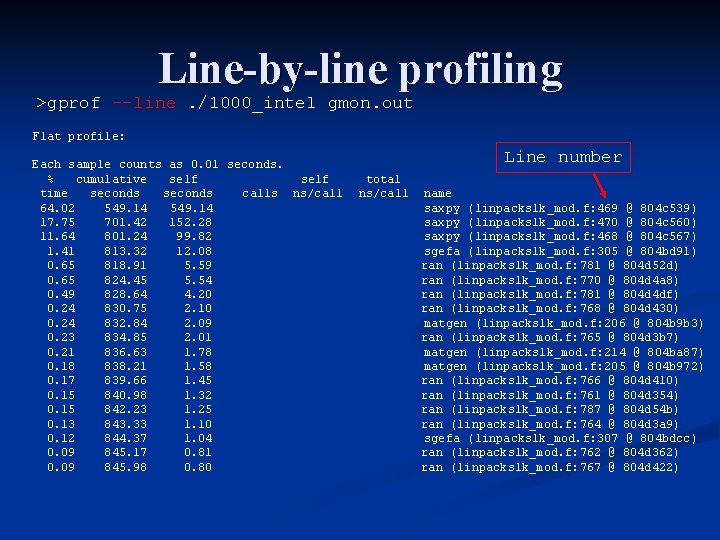
Line-by-line profiling >gprof --line. /1000_intel gmon. out Flat profile: Each sample counts as 0. 01 seconds. % cumulative self time seconds calls ns/call 64. 02 549. 14 17. 75 701. 42 152. 28 11. 64 801. 24 99. 82 1. 41 813. 32 12. 08 0. 65 818. 91 5. 59 0. 65 824. 45 5. 54 0. 49 828. 64 4. 20 0. 24 830. 75 2. 10 0. 24 832. 84 2. 09 0. 23 834. 85 2. 01 0. 21 836. 63 1. 78 0. 18 838. 21 1. 58 0. 17 839. 66 1. 45 0. 15 840. 98 1. 32 0. 15 842. 23 1. 25 0. 13 843. 33 1. 10 0. 12 844. 37 1. 04 0. 09 845. 17 0. 81 0. 09 845. 98 0. 80 Line number total ns/call name saxpy (linpacks 1 k_mod. f: 469 @ 804 c 539) saxpy (linpacks 1 k_mod. f: 470 @ 804 c 560) saxpy (linpacks 1 k_mod. f: 468 @ 804 c 567) sgefa (linpacks 1 k_mod. f: 305 @ 804 bd 91) ran (linpacks 1 k_mod. f: 781 @ 804 d 52 d) ran (linpacks 1 k_mod. f: 770 @ 804 d 4 a 8) ran (linpacks 1 k_mod. f: 781 @ 804 d 4 df) ran (linpacks 1 k_mod. f: 768 @ 804 d 430) matgen (linpacks 1 k_mod. f: 206 @ 804 b 9 b 3) ran (linpacks 1 k_mod. f: 765 @ 804 d 3 b 7) matgen (linpacks 1 k_mod. f: 214 @ 804 ba 87) matgen (linpacks 1 k_mod. f: 205 @ 804 b 972) ran (linpacks 1 k_mod. f: 766 @ 804 d 410) ran (linpacks 1 k_mod. f: 761 @ 804 d 354) ran (linpacks 1 k_mod. f: 787 @ 804 d 54 b) ran (linpacks 1 k_mod. f: 764 @ 804 d 3 a 9) sgefa (linpacks 1 k_mod. f: 307 @ 804 bdcc) ran (linpacks 1 k_mod. f: 762 @ 804 d 362) ran (linpacks 1 k_mod. f: 767 @ 804 d 422)

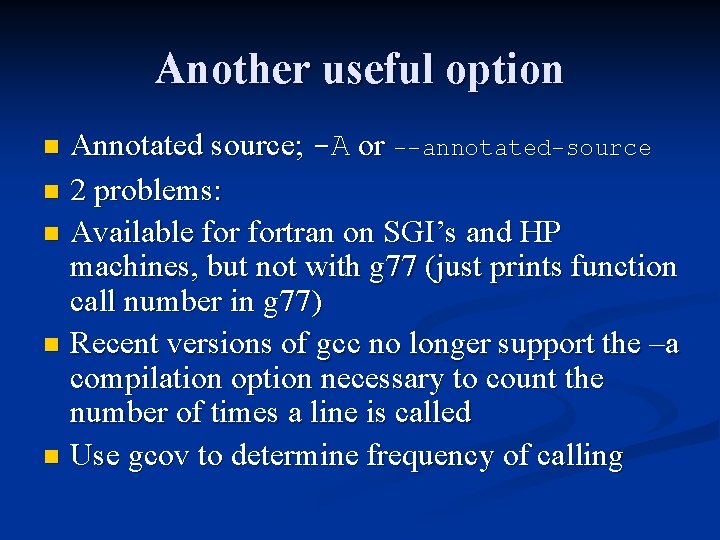
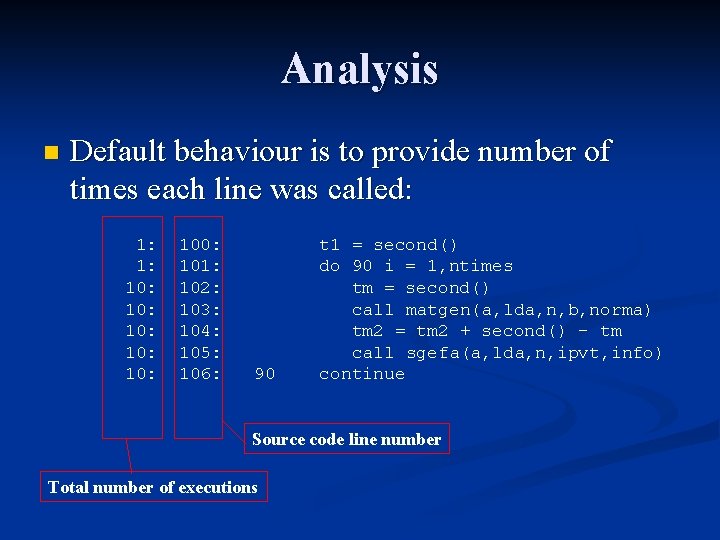
Another useful option Annotated source; -A or --annotated-source n 2 problems: n Available fortran on SGI’s and HP machines, but not with g 77 (just prints function call number in g 77) n Recent versions of gcc no longer support the –a compilation option necessary to count the number of times a line is called n Use gcov to determine frequency of calling n

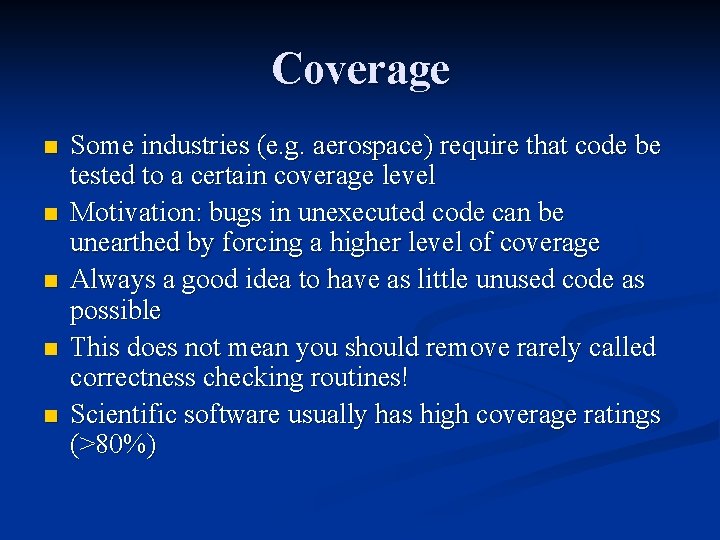
Coverage n n n Some industries (e. g. aerospace) require that code be tested to a certain coverage level Motivation: bugs in unexecuted code can be unearthed by forcing a higher level of coverage Always a good idea to have as little unused code as possible This does not mean you should remove rarely called correctness checking routines! Scientific software usually has high coverage ratings (>80%)

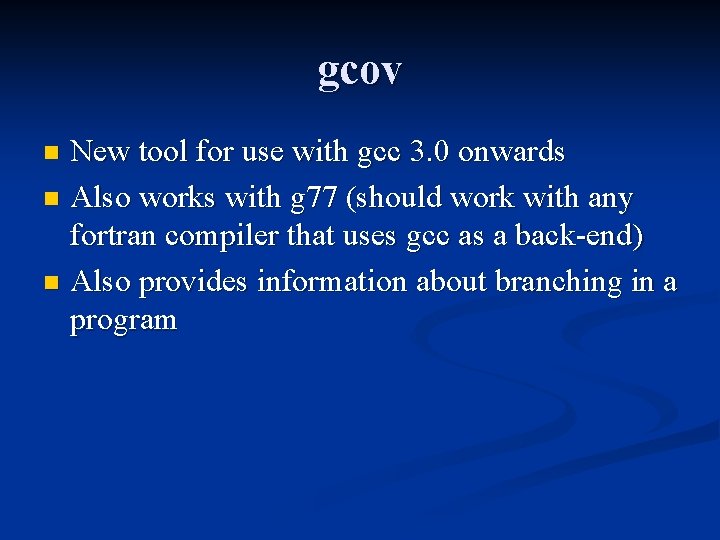
gcov New tool for use with gcc 3. 0 onwards n Also works with g 77 (should work with any fortran compiler that uses gcc as a back-end) n Also provides information about branching in a program n

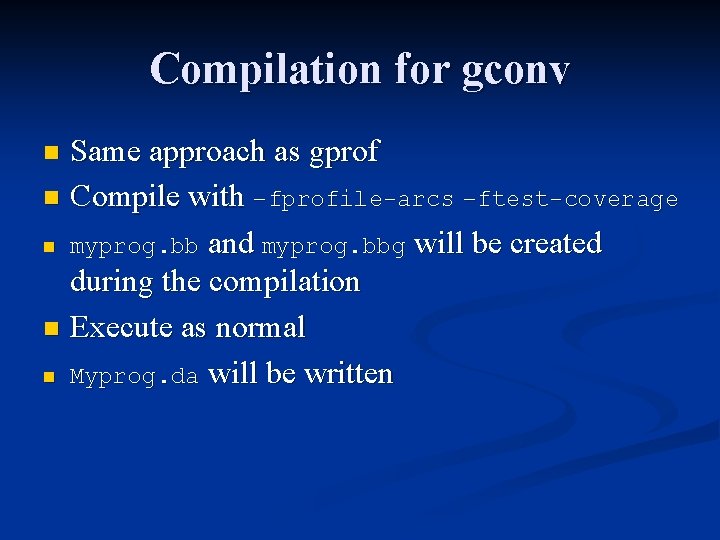
Compilation for gconv Same approach as gprof n Compile with –fprofile-arcs –ftest-coverage n myprog. bb and myprog. bbg will be created during the compilation n Execute as normal n Myprog. da will be written n

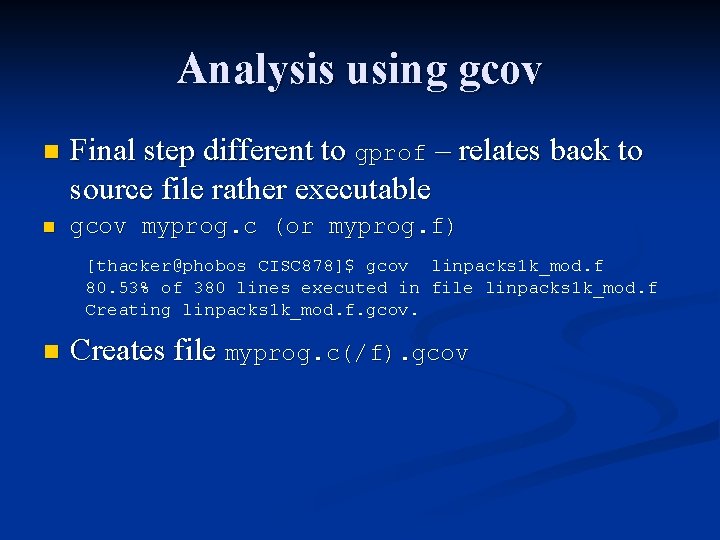
Analysis using gcov n Final step different to gprof – relates back to source file rather executable n gcov myprog. c (or myprog. f) [thacker@phobos CISC 878]$ gcov linpacks 1 k_mod. f 80. 53% of 380 lines executed in file linpacks 1 k_mod. f Creating linpacks 1 k_mod. f. gcov. n Creates file myprog. c(/f). gcov

Analysis n Default behaviour is to provide number of times each line was called: 1: 1: 10: 10: 10: 100: 101: 102: 103: 104: 105: 106: 90 t 1 = second() do 90 i = 1, ntimes tm = second() call matgen(a, lda, n, b, norma) tm 2 = tm 2 + second() - tm call sgefa(a, lda, n, ipvt, info) continue Source code line number Total number of executions

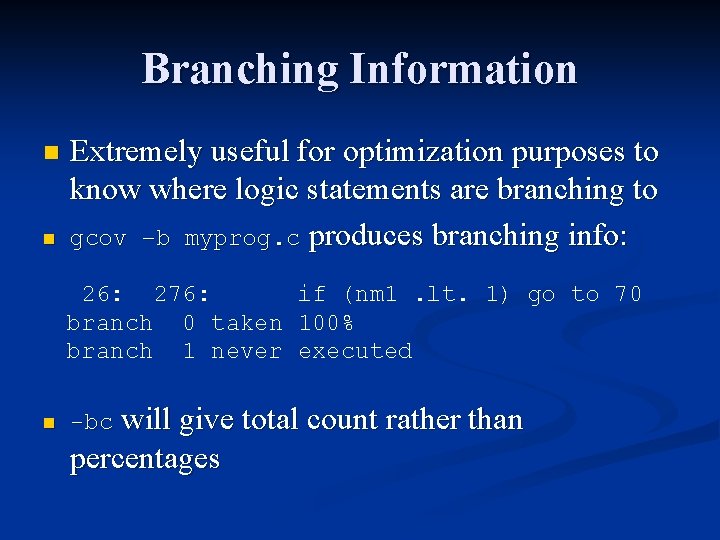
Branching Information n n Extremely useful for optimization purposes to know where logic statements are branching to gcov –b myprog. c produces branching info: 26: 276: if (nm 1. lt. 1) go to 70 branch 0 taken 100% branch 1 never executed n -bc will give total count rather than percentages

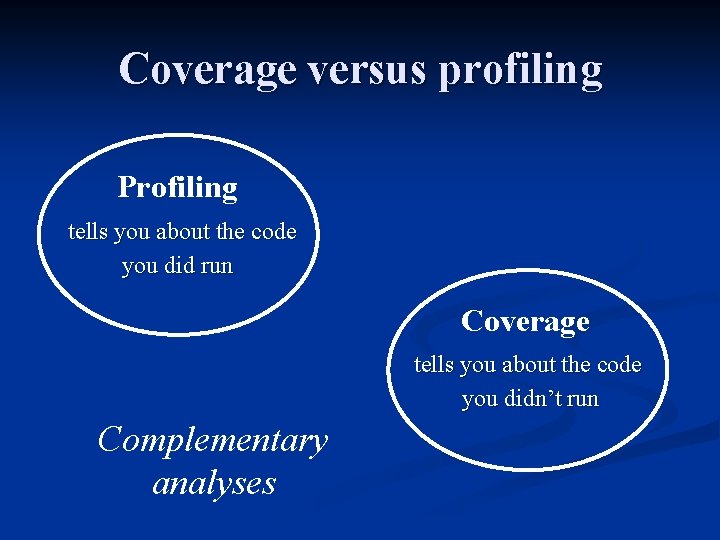
Coverage versus profiling Profiling tells you about the code you did run Coverage tells you about the code you didn’t run Complementary analyses

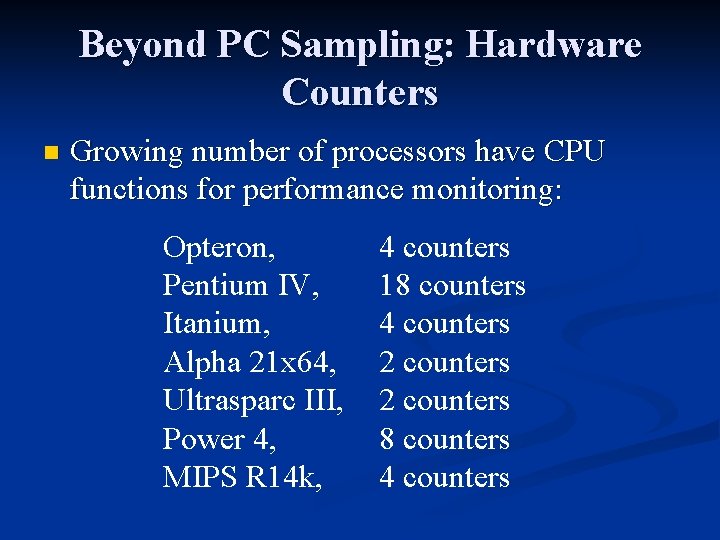
Beyond PC Sampling: Hardware Counters n Growing number of processors have CPU functions for performance monitoring: Opteron, Pentium IV, Itanium, Alpha 21 x 64, Ultrasparc III, Power 4, MIPS R 14 k, 4 counters 18 counters 4 counters 2 counters 8 counters 4 counters

Utility of hardware counters Source profiling only tells you implicitly (i. e. the execution time) how your code is performing on the CPU n Hardware counters can provide more explicit details of how your source code maps to operations on the processor n Perhaps most importantly, they inform you about the memory access of your code n

Memory Wall: Cache access Recall that memory access and using caches is important to achieving high speed on modern processors n Cache miss counters directly monitor how often you go back to main memory rather than reusing a cache line n IMO, if you want to speed up your code, this is the single most important hardware counter n

http: //icl. cs. utk. edu/papi Standardization: PAPI The Performance API (PAPI) is an attempt to provide a high level API for monitoring the hardware counters in CPUs n Also provides a low level interfaces for tool developers n We’ll look at PAPI based tools, and profiling using hardware counters in lecture 2 n

Next lecture n High Performance Serial Computing