HETEROGENEITY AND SOURCES OF BIAS Olaf DekkersSnderborg2016 Heterogeneity

HETEROGENEITY AND SOURCES OF BIAS Olaf Dekkers/Sønderborg/2016

Heterogeneity: to pool or not to pool?

Heterogeneity: What do we mean? Heterogeneity Diversity Statistical heterogeneity Variation between studies Bias Study quality

What do we mean? Sources of between study variation Design elements Patient characteristics Treatments Effect measures/outcomes Effect estimates

What do we mean? Sources of between study variation � Design elements � Patient characteristics � Treatments � Effect measures/outcomes � Effect estimates Statistical judgement Q-statistics I-squared
2 Chi-square The power of the test is")
Q-statistics Test for overall homogeneity Q=Σwi (θi-θ)2 Chi-square The power of the test is low for few studies Fails with df = n-1 to detect heterogeneity often The power is too high for meta-analysis with much studies

Q-statistics P-value Q-test: < 0. 001
 Random")
I 2 Tries to separate Variability due to differences in true effects (heterogeneity) Random variation I is formally not a test It describes the proportion variability between trials not due to chance 2 Main disdvanatge: depends on sample size of trials

I 2 71%

I 2 of studies with high heterogeneity

What do we mean? Sources of between study variation � Design elements � Patient characteristics � Treatments � Effect measures/outcomes � Effect estimates Statistical judgement Q-statistics I-squared To pool or not to pool?

Reasons for avoiding forest plots

Example I Underhill, BMJ 2007, 335; 248

Example I As a result of data unavailability, lack of intention to treat analyses, and heterogeneity in programme and trial designs, we determined that a statistical meta-analysis would be inappropriate. Instead we present individual trial results using Rev. Man and provide a narrative synthesis.

Example I

Example I

To pool or not to pool � Clinical heterogeneity Reconsider study eligibility? Is pooling results defendable? � Don’t rely on I 2 for ultimate verdict � Outcome heterogeneity Ways to deal with � Statistical heterogeneity There are methods to account for statistical heterogeneity Random effect models/Prediction intervals Restriction/sensitivity analysis Meta-regression

Explaining heterogeneity “Heterogeneity should be the starting point for further examination” M. Egger

Heterogeneity in meta-analysis

Explanations Differences in design elements/risk of bias � Adequate concealment � Blinding � Loss to follow-up Differences in clinical characteristics � Age � Co-medications � Differences in outcome
 be the starting point for")
How to deal with heterogeneity Heterogeneity can (should!? ) be the starting point for further investigation Explanation of heterogeneity is an important goal � Sensitivity analysis � Meta-regression

Assessment of heterogeneity

Assessment of heterogeneity

Heterogeneity Clinical characteristics and study characteritics can cause heterogeneity Design elements, clinical characteritics (at study level) and risk of bias used to explore heterogeneity Absence of heterogeneity does not mean absence of bias

Risk of bias assessment

Risk of bias I. Bias vs risk of bias II. Quality vs risk of bias III. Risk of bias vs reporting IV. Scales and scores V. Risk of bias: empirical evidence

i. Bias vs Risk of bias

Risk of bias?

Risk of bias?
 not know whether the results are")
Bias vs risk of bias We do (often) not know whether the results are biased But: we can assess the risk of bias

ii. Study quality vs Risk of bias

Study quality?

Quality vs risk of bias Quality is the best the authors have been able to do Low study quality ≠ high risk of bias Good quality but still high risk of bias Unblinded Low study of surgical intervention quality but no risk of bias Lacking sample size calculation

III. Reporting vs risk of bias

Report vs conduct

Reporting vs risk of bias We are actually judging reporting Reporting not always good proxy for conduct ‘Solution’: make a category ‘not reported’

IV: Use of quality assessment scales

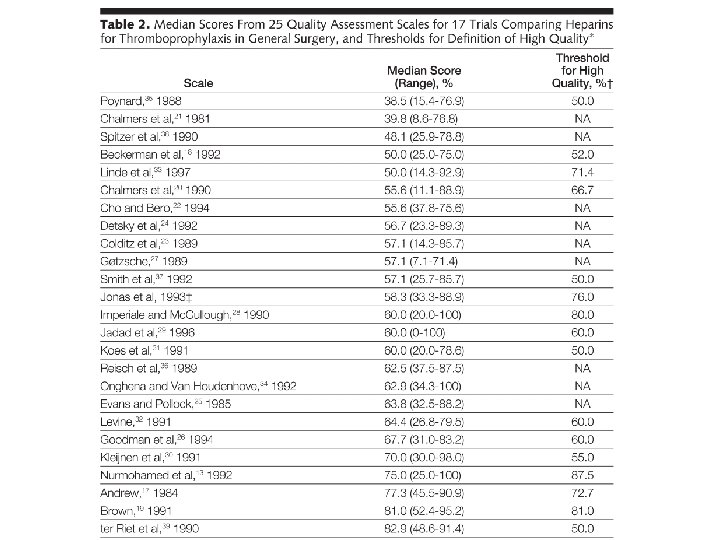
Quality scores Juni JAMA 1999
 applied to one meta-analysis Based on quality score")
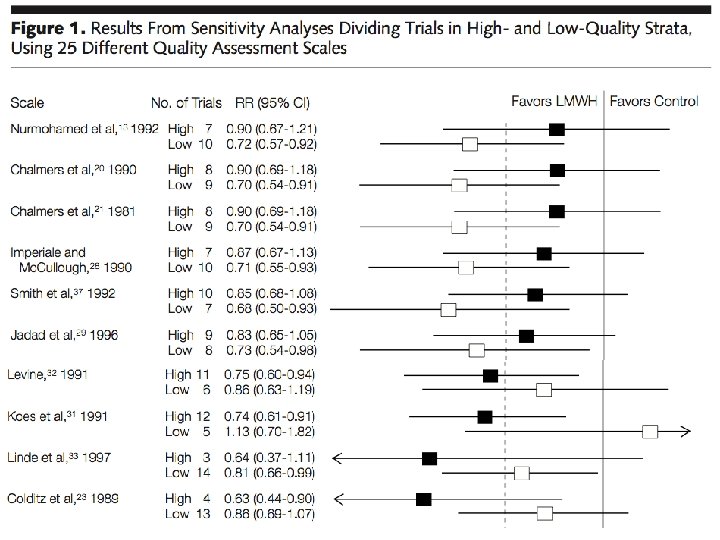
JAMA paper Different quality scores (n=25) applied to one meta-analysis Based on quality score studies were divided into high and low quality Summary estimate by quality Standard assumption: better quality results in more valid estimates

Quality scales

Quality and effect sizes

Quality as a weight factor in pooling? Assumtpion: High quality studies provide better estimates Use of scales/aggregate scores should be discouraged Choice of scales is arbitrarily Preferably: use risk of bias assessment to explore heterogeneity per item: Restriction Sensitivity analysis Meta-regression

V: Risk of bias: empirical evidence

Empirical evidence for risk of bias Is there evidence bias indeed has an effect on the outcome? Extensive literature for randomized studies Almost no literature for observational studies
")
Risk of bias We can assess risk of bias, not bias (sometimes we can) Study quality has no direct translation in terms of risk of bias We are actually assessing study reporting Use of scales and scores should be discouraged Empirical evidence for risk of bias mainly for RCTs

Publication bias

Publication bias Studies with significant results are more likely to get published than studies without significant results, leading to publication bias BMJ 1998; 316: 61 -66

Publication bias
 Available in principle (Chinese journals, meeting abstracts) Easily available (Medline,")
Publication bias Unpublished (unavailable) Available in principle (Chinese journals, meeting abstracts) Easily available (Medline, Embase) P-value higher lower P-value

Publication bias: empirical evidence N Engl J Med 2008; 358: 252 -260

Publication bias NEJM 2008; 358: 3

Publication bias NEJM 2008; 358: 3
 bias The scatter should be symmetrical around")
Funnel plot Visual way to detect (publication) bias The scatter should be symmetrical around overall effect Effect measure is plotted against a measure of precision

Funnel plot Study size Effect size
symmetry")
Funnel plot (a)symmetry

Sources of funnel plot asymmetry Publication bias True heterogeneity Chance

Use of symmetry tests Symmetry tests: � Power is low � Different tests can give different results Alternative approaches � Restriction to large trials � Cumulative meta-analysis

Publication bias in publication bias? BMJ 2005; 331: 433 -434
- Slides: 64