Hertzsprung Russell Diagram Star Classification Stars can be

Hertzsprung. Russell Diagram

Star Classification • Stars can be classified in three ways: 1. Size – How massive the star is 2. Temperature – A stars color reveals its temperature. • Red stars have a cooler temperature, and blue stars have a warmer temperature. 3. Brightness/Magnitude – The amount of light a star gives off depends on its size and temperature.
 of stars on a")
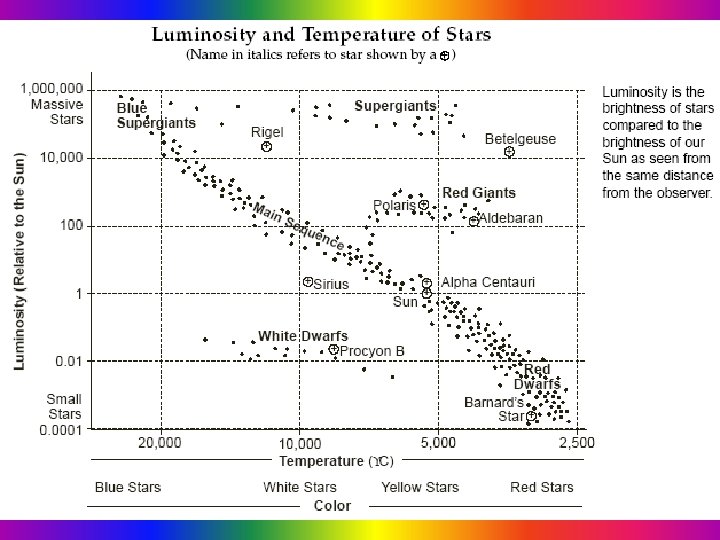
H-R Diagram • Compares the temperature, color and luminosity (brightness) of stars on a graph. • The temperature is the surface temperature of the star • The brightness of the star is its absolute magnitude

APPARENT MAGNITUDE VS. ABSOLUTE MAGNITUDE Apparent magnitude Measure of the amount of a star’s light received on Earth Absolute magnitude Measure of the amount of light a star actually gives off

STAR PROPERTIES Color indicates temperature Hot stars are Blue Cool stars are Red Medium temperature stars are Yellow
 axis. • hotter at left •")
Explaining the H-R Diagram • Temperature: horizontal (bottom) axis. • hotter at left • cooler toward right
 axis. • brightest stars near")
Explaining the H-R Diagram • Brightness: vertical (left side) axis. • brightest stars near top • dim stars near bottom

Explaining the H-R Diagram • A star’s position on the diagram will change as it moves from its “birth” to its “death”.

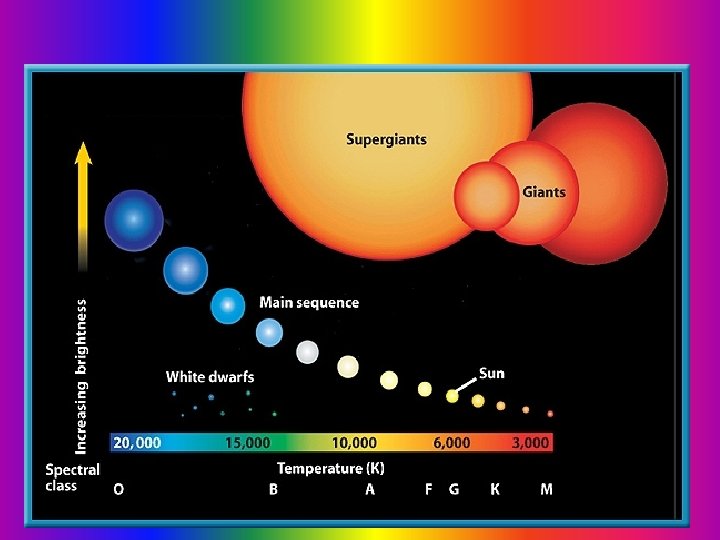
White dwarfs small, hot stars leftover centers of old stars

Red-Giants When star runs out of energy, the center shrinks and the outer part expands outward. It will grow very large and cool.

Supergiants Very massive cool giant star

Main Sequence Stretches diagonal from the top left to the right bottom Our sun is an average main sequence star

Blue Supergiants Very massive blue stars Quickly use up energy and turn into Giants or Supergiants

Red Dwarfs Low-mass stars Oldest stars in galaxy

Explaining the H-R Diagram • You. Tube Style
- Slides: 17