HELPING FARMERS BY HELPING CONSUMERS IDENTIFY LOCAL FOOD

HELPING FARMERS BY HELPING CONSUMERS IDENTIFY LOCAL FOOD THE CASE OF THE APPALACHIAN GROWN BRANDING PROGRAM Appalachian Studies Association Shepherdstown, WV March 19, 2016 Leah Greden Mathews, Carlos Carpio, Tullaya Boonsaeng, Charlie Jackson, and Allison Perrett

MOTIVATION: FARMING IN APPALACHIA IS CHALLENGING • Small scale • Changing community and market dynamics • Industrialization of agriculture • Loss of traditional ag infrastructure & knowledge (supply side) • Consumer preference (necessity) of cheap products (demand side) • Decline of historically important crops • What is the impact of these trends? • Between 1949 and 2007, WNC lost 70% of its farmland (Census of Ag) • >50% of farms in the region are not profitable (Census of Ag) • Can we reclaim the local food system? • Mechanism to counter trends in farm loss, declining farm income • Strategy for sustainable, place-based economic development

HOWEVER… Local Food branding has become ubiquitous Wal-Mart, state agriculture departments, local farmers, nonprofits No consensus on what local means USDA: < 400 miles, or within the state in which it is produced (2008 Food, Conservation and Energy Act) Many regions have food labels • • To ensure consumers are able to identify a product’s region of origin To help producers authentically promote their local product Are consumers…? • • • receiving the messages that are meant to be implied by the regional brand? Using the logo to facilitate local purchasing? Actually purchasing more local product as a result of the brand?

LOCAL FOOD IN WESTERN NC • 82% of consumers surveyed in our area indicated they would purchase more locally-produced food if it were labeled as local (2007, ASAP) • Local product has not been consistently distinguished in the marketplace • Not as important in direct markets (farmers markets) • Essential in larger-scale markets (groceries) • Helps consumers identify local product • Allows farmers the opportunity to benefit from the price premium • ASAP developed Appalachian Grown. TM • Identify products from local farms • Protect the integrity of the local market

WHICH LEADS US TO THIS RESEARCH • Keeping the Value with the Farm: Expanding Market Opportunities through Regional Branding • Project Goal: ● Develop and test the effectiveness of the Appalachian Grown marketing program

TODAY’S RESEARCH QUESTIONS 1. Are consumers’ perceptions of the AG logo congruent with the requirements set by the Appalachian Sustainable Agriculture Project (ASAP)? 2. What is the impact of the AG marketing campaign?
 since 2006 Who is")
APPALACHIAN GROWNTM LOGO Trademark of Appalachian Sustainable Agriculture Project (ASAP) since 2006 Who is eligible for AG certification? • Individual farms, farmer groups, and tailgate markets • Grocers, restaurants, and distributors may become AG licensed partners To become certified, the farm/business must • Comply with standards outlined in their personalized agreement with ASAP • Be located in an eligible county • Only label and market products grown on an Appalachian Grown certified farm

APPALACHIAN GROWNTM CERTIFIED FARMS AND BUSINESSES Mc. Dowell County Jackson County Buncombe County 16 6 114 Restaurants & Bakeries 1 2 79 Tailgate Markets 1 3 16 Grocers 0 0 15 Farms

SURVEY SITES JB’s Galaxy Marion, NC Katuah Market Asheville, NC Harold’s Supermarket Sylva, NC

CHARACTERISTICS OF SURVEY SITES JB’s Galaxy Harold’s Supermarket Katuah Market Location Marion, NC Sylva, NC Asheville, NC Availability of Local Products Difficulty sourcing local products: control store Leading produce suppliers: J. W. Mitchell Farms, Shelton Farms, Darnell Farms Leading produce suppliers: Population 1 7, 997 2, 627 83, 796 Median Annual Household Income 1 $24, 775 $29, 600 $42, 333 Education Attainment 1 74. 1% high school grad or higher 75. 6% high school grad or higher 89. 5% high school grad or higher 12008 -2012 American Community Survey 5 -Year Estimates Appalachian Seeds Farm & Nursery, Gladheart Farm, Heirloom Uprising

METHODS Baseline Survey Intercept Survey Post-Intervention Survey Conducted prior to intervention with local signage Studied the effects of the local food signage To determine if perceptions, usage, purchases have changed Harold's and JB's June-August 2013 Harold's October 2013 Harold’s and JB’s May-June 2014 Fall 2014 Katuah January 2014 Katuah July 2014 Katuah November 2014

BASELINE SURVEY -Degree of preference for store -Stated behaviors -Local food perceptions -Willingness to Pay -Perceptions of the Appalachian Grown logo -Demographics

TYPICAL SURVEY RESPONDENT JB’s and Harold’s Katuah Market Gender 64. 5% women 61. 3% women Age 52. 9% b/w ages 50 -69 52. 5% b/w ages 50 -69 # of People in Household 37. 1% consist of 2 people 49. 6% consist of 2 people Household Income 31. 7% make <$20, 000/yr. 20. 9% make $20, 000 -39, 999/yr. Education Attainment 55. 6% have at least “some” college education 79. 5% bachelor’s degree or higher

CONSUMER PREFERENCES Katuah Market Produce Section JB’s Galaxy Meat Department

HOW FREQUENTLY DO YOU BUY LOCALLY GROWN FOOD IN SEASON AT THIS STORE?

HOW OFTEN DO YOU EAT FRESH FRUITS AND VEGETABLES?

PERCEPTIONS OF LOCAL FOOD Katuah Market Produce JB’s Galaxy Produce

WHEN YOU SEE FRESH FOOD IN A STORE LABELED AS “LOCAL, ” WHERE DO YOU ASSUME IT CAME FROM?

WHAT MAKES A SIGN IDENTIFYING LOCALLY GROWN FOOD BELIEVABLE OR TRUSTWORTHY TO YOU?

HAVE YOU EVER SEEN THE APPALACHIAN GROWN LOGO?

INTERCEPT SURVEY RESULTS Did you notice any signs, logos, or labels identifying locally grown produce today? If "yes, " what do you remember about them? Options Generic Harold’s sign 9. 4 Nothing in particular 9. 4 Sign/Pictures The message (emphasizing “local” and/or the farm) n=114 Percentage 18. 9 62. 26 Total respondents=53. Other answers included: color, prices, seasonal

INTERCEPT SURVEY RESULTS Did you buy any of the locally grown produce the signs/logos/labels were promoting? n=114

2013/2014 COMPARISONS Have you ever seen the AG logo?

ARE CONSUMERS WILLING TO PAY A PREMIUM FOR LOCAL FOOD? q. Would you choose a locally grown produce over a non- local produce if the local produce was (10%, 20%, 30%, 40%) more expensive? q. What if the local produce was (20%, 30%, 40%, 50%) more expensive? q. What if the local produce was (the same as, 10%, 20%, 30%)?
 FOR LOCAL FOOD • Consumers indicate willingness to pay a")
WILLINGNESS TO PAY (WTP) FOR LOCAL FOOD • Consumers indicate willingness to pay a premium for local food • Average premium: 48% • WTP premium varied across stores Mean 95% Confidence Interval Store 1 (Control) Store 2 Harold’s Store 3 Katuah 51. 3 54. 4 39. 3 [45. 8, 56. 9] [47. 1, 61. 7] [36. 6, 42. 0]

WTP FOR LOCAL FOOD • Main influences on WTP: • • Gender Age Whether or not the respondent is the primary shopped The direction of these changes varied by store • No effect on WTP in the control store (as expected) • Intervention led to statistically significant increase in WTP in only 1 store (store 3, Katuah): 4% increase in WTP

LOCAL FOOD BRANDING BEST PRACTICES • Conduct research in your area • To understand how consumers define local • To identify the messages and values that resonate • To determine best communication channels • Develop a distinctive and clear brand message • Develop brand awareness • Use consistent graphics and language to promote the brand • Don’t overcomplicate the message - keep it simple and consistent

LOCAL FOOD BRANDING: BEST PRACTICES • Engage stakeholders - farmers, food entrepreneurs, food industry buyers • Share the results of your consumer research • Communicate the values and value of the brand • Show them how to use the brand materials accurately and to their best advantage • Seek feedback on the types of branding materials appropriate to their needs • Consider co-branding with farms and local food businesses to increase the distinctiveness of the brand for individual businesses

LOCAL FOOD BRANDING: BEST PRACTICES • For retail and wholesale markets, work with farmers to get brand labels on products and packaging • To help wholesalers and retailers maintain accurate and consistent labeling of local product • To increase farmers’ marketing power • Conduct ongoing evaluation of branding efforts • To measure the impacts of the program on farm and food businesses • To inform continued development of the program • To continue to demonstrate the value of the brand to brand users

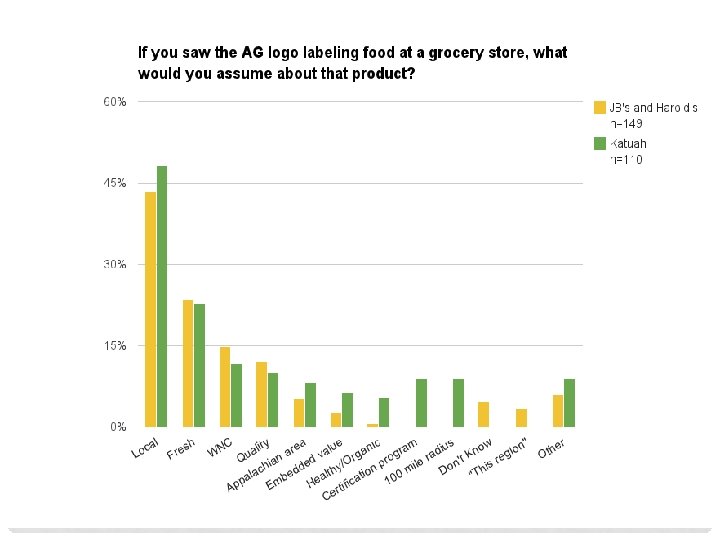
CONCLUSIONS AND IMPLICATIONS Most respondents were familiar with the Appalachian Grown logo but not all use it to find local products Fresh and Local were most common assumptions made about logo this is consistent with the brand Farm name and location are preferred when advertising local products picture of farm/farmer and third party certification are less important

CONCLUSIONS AND IMPLICATIONS Helping consumers identify local food can promote local food sales and thus help farmers. Customers visiting different food outlets in the same region may have different levels of knowledge of the brand/logo and/or use it differently. Research on the perceptions of local brands/logos is key to determining the effectiveness of accompanying marketing programs.

ACKNOWLEDGEMENTS Student Research Assistants: Hannah James*, Angelina Carrasco. Songer, Samuel Fontaine, Zoe Hamel, Hamish Horton, Amy Hughes, Catherine Kanwisher, Caroline Ketcham, Emily Lindesmith, Haley Mahoney, Anna Maphis, Wendy Moore, Kendall Murray, Austin Napper, Abigail Ruffle, Hannah Sasser, Jessica Speer, Lisa Stansberry, Corey Stevens, Colin Ward, Sarah Whaley This project was supported by the National Research Initiative of the National Institute of Food and Agriculture, USDA, Grant #201268006 -30182

QUESTIONS? Leah Greden Mathews Department of Economics UNC Asheville lmathews@unca. edu
 Store 2 Store 3 Proportion Gender Male 35.")
Variable name Category Store 1 (Control) Store 2 Store 3 Proportion Gender Male 35. 94 34. 76 40. 16 Female 64. 06 65. 24 59. 84 7. 65 5. 91 0 26. 53 16. 03 2 35. 2 19. 41 18 College graduate 20. 92 28. 69 41. 6 Graduate school 9. 69 29. 96 38. 4 82. 66 91. 02 96. 35 17. 34 8. 98 3. 65 Less than High School graduate Education High school Some college Number of members in 1 -4 the household More than 4
 Store 2 Harold’s Store 3 Katuah % Primary")
Store 1 Variable name Category (Control) Store 2 Harold’s Store 3 Katuah % Primary residence is Western North Carolina Primary shopper for the household Has heard of the Appalachian Sustainable Agricultural Project Yes 96. 97 94. 04 97. 2 No 3. 03 5. 96 2. 8 Yes 85. 49 87. 71 80. 08 No 14. 51 12. 29 19. 92 Yes 32. 99 43. 46 71. 84 No 67. 01 56. 54 28. 16

Estimation Results of the WTP Models for Locally Grown Produce Variable 0. 183 0. 066 0. 016 Store 2 Harold’s Parameters 0. 218 -0. 161 0. 033*** 0. 247 0. 041** -0. 004 Age 2 -0. 020* -0. 037*** 0. 004 Household income ($10, 000/year) College education (Yes=1, No=0) Gender (0=Male, 1=Female) Size of household Primary residence in Western North Carolina (Yes=1, No=0) Primary shopper (Yes=1, No=0) Standard Deviation (σ) Intercept Post-intervention (Yes=1, No=0) Log-likelihood -0. 001 0. 034 0. 138** 0. 014 0. 001 -0. 172** 0. 008 0. 004 0. 109 -0. 064*** 0. 017** 0. 058 -0. 051 0. 058 -0. 006 0. 160*** 0. 054** -1. 107*** -0. 633 -118. 17 -1. 134*** -0. 535 -129. 38 -1. 905*** 0. 214* -292. 96 Mean Intercept Post-intervention (Yes=1, No=0) Age (Years) Store 1 (Control) Store 3 Katuah

IF YOU WERE TRYING TO CONVINCE SOMEONE ELSE TO BUY LOCAL FOOD, WHAT REASONS WOULD YOU GIVE?
- Slides: 38