Held in conjunction with ASPENs Clinical Nutrition Week


 Faisy C et al.")

 Absent Score")


 §")
 Variable")
")
")
 Interaction")
 §")


 Skeletal Muscle is Related to Mortality in Critical Illness")


* –Between subject variance: 0. 45 –Within")


: 1116")


- Slides: 47
Held in conjunction with ASPEN’s Clinical Nutrition Week 2017 Moderator Faculty Charles Mueller, Ph. D, RDN, CNSC New York, New York Daren Heyland, MD Kingston, Ontario, Canada Claude Pichard, MD, Ph. D This activity is supported by an educational Geneva, Switzerland grant from Baxter Healthcare Corporation.
Nutrition Risk Assessment in Critically Ill Patients! Daren Heyland, MD, MSc. Professor of Medicine Queen’s University, Kingston General Hospital Kingston, ON Canada
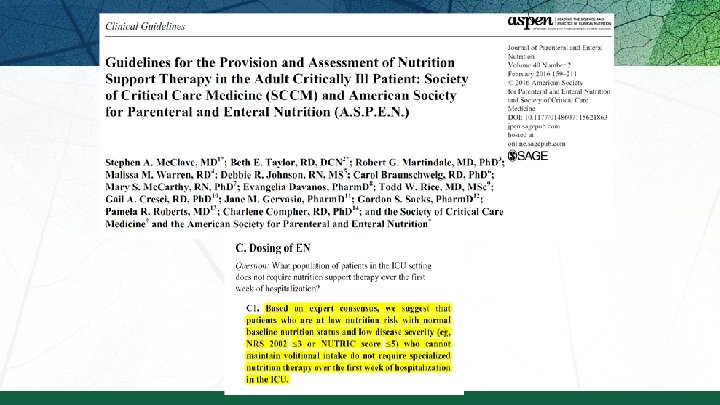
ICU patients are not all created equal…should we expect the impact of nutrition therapy to be the same across all patients?
How do we figure out who will benefit the most from nutrition therapy?
Who might benefit the most from nutrition therapy? § Clinical –BMI –Projected long length of stay –Nutritional history variables § High NUTRIC Score § Low NUTRIC with risk factors § Sarcopenia –CT vs. bedside US –Frailty measures § Others?
§ Point prevalence survey of nutrition practices in ICU’s around the world conducted Jan. 27, 2007 § Enrolled 2772 patients from 158 ICU’s over 5 continents § Included ventilated adult patients who remained in ICU >72 hours Alberda C et al. Intensive Care Med. 2009; 35(10): 1728 -37.
Relationship of Protein/Caloric Intake, 60 day Mortality and BMI 60 BMI All Patients Mortality (%) 50 < 20 40 20 -25 30 25 -30 20 30 -35 35 -40 10 >40 0 0 25% 500 50% 1000 75% 1500 Protein/Calories Delivered 100% 2000
Mechanically Vent’d Patients >7 days (average ICU LOS 28 days) Faisy C et al. Br J Nutr. 2009; 101(7): 1079 -1087.
How do we figure out who will benefit the most from nutrition therapy?
Nutrition Risk Screening 2002 Impaired nutritional status Severity of disease (≈stress metabolism) Absent Score 0 Normal nutritional status Absent Score 0 Normal nutritional requirements Mild Score 1 Wt loss >5% in 3 months Or Food intake below 50 -75% of normal requirement in preceding week Mild Score 1 Hip fracture Chronic patients, in particular with acute complications: cirrhosis (11), COPD (12) Chronic hemodialysis, diabetes, oncology Moderate Score 2 Wt loss >5% in 2 months Or BMI 18. 5 - 20. 5 + impaired general condition Or Food intake 25 -50% of normal requirement in preceding week Moderate Score 2 Major abdominal surgery (13 -15). Stroke (16) Severe pneumonia, hematologic malignancy Severe Score 3 Wt loss >5% in 1 month (≈ >15% in 3 months (17)) Or BMI <18. 5 + impaired general condition (17) Or Food intake 0 -25% of normal requirement in preceding week Severe Score 3 Head injury (18, 19) Bone marrow transplantation (20) Intensive care patients (APACHE 10) Calculate the total score: All ICU patients 1. Find score (0 -3) for Impaired nutritional status (only one: choose the variable with highest score) and Severity of disease (≈stress metabolism, i. e. . treated the same increase in nutritional requirements). 2. Add the two scores (→ total score) 3. If age >70 years: add 1 to the total score to correct for frailty of elderly 4. If age-correlated total >3: start nutritional support Adapted from: Kondrup J et al. Clin Nutr. 2003; 22(3): 321 -36.
50 Pos No NRCT 40 30 20 10 2 Adapted from: Kondrup J et al. Clin Nutr. 2003; 22(3): 321 -36. ≥ 2 -<2. 5 ≥ 2. 5 -<3 ≥ 3 -<3. 5 Total Score ≥ 3. 5 -<4 ≥ 4
Subjective global assessment?
Frequency of subjective global assessment characteristics on admission to the medical intensive care unit in patient requiring mechanical ventilation Variable § When training provided in advance, can produce reliable estimates of malnutrition § Note rates of missing data In the past 2 weeks weight has: No change – n (%) Decreased – n (%) Increased – n (%) Unable to obtain/assess changes – n (%) Weigh loss in the last 6 months No – n (%) Yes – n (%) Unable to obtain/assess changes – n (%) Change in dietary intake No change – n (%) Borderline/poor – n (%) Unable to eat – n (%) Unable to obtain/assess changes – n (%) Adapted from: PM Sheenan et al. Eur J Clin Nutr. 2010; 64(11): 1358 -1364. All patients n=57 Normally Nourished n=28 Moderate or severely malnourished n=29 28 (49) 17 (30) 4 (7) 8 (8) 7 (61) 5 (18) 1 (4) 5 (18) 11 (38) 12 (41) 3 (10) 22 (39%) 18 (30%) 17 (31%) 18 (64%) 3 (11%) 7 (25%) 4 (14%) 15 (52%) 10 (34%) 17 (30) 33 (58) 2 (3) 5 (9) 12 (43) 13 (46) 0 (0) 3 (11) 5 (17) 20 (69) 2 (7)
§ Mostly medical patients; § § not all ICU Rate of missing data? No difference between well-nourished and malnourished patients with regard to the serum protein values on admission, LOS, and mortality rate. 66. 4% Well nourished 27. 7% Moderately malnourished Severely malnourished 5. 9% 0 10 20 30 40 50 60 70 80 90 100 Assessment of malnutrition according to the subjective global assessment. Prevalence of malnutrition was present in 40(33. 6%) of the 119 included patients. Adapted from: Atalay BG et al. JPEN J Pareneter Enteral Nutr. 2008; 32(4): 454 -9.
How do we figure out who will benefit the most from nutrition therapy?
A Conceptual Model for Nutrition Risk Assessment in the Critically Ill Acute -Reduced po intake -pre ICU hospital stay Chronic -Recent weight loss -BMI? Starvation Nutrition Status micronutrient levels - immune markers - muscle mass Acute -IL-6 -CRP -PCT Inflammation Chronic -Comorbid illness
The Development of the NUTrition Risk in the Critically Ill Score (NUTRIC Score) § When adjusting for age, APACHE II, and SOFA, what effect of nutritional risk factors on clinical outcomes? § Multi institutional data base of 598 patients § Historical po intake and weight loss only available in 171 patients § Outcome: 28 day vent-free days and mortality Heyland DK et al. Crit Care. 2011; 15: R 268.
The Development of the NUTrition Risk in the Critically Ill Score (NUTRIC Score) Variable Range Points Age <50 50 -<75 >=75 <15 15 -<20 20 -28 >=28 <6 6 -<10 >=10 0 -1 2+ 0 -<1 1+ 0 -<400 400+ 0 1 2 3 0 1 2 0 1 0 1 APACHE II SOFA # Comorbidities Days from hospital to ICU admit IL 6 AUC Gen R-Squared Gen Max-rescaled R-Squared 0. 783 0. 169 0. 256 BMI, CRP, PCT, weight loss, and oral intake were excluded because they were not significantly associated with mortality or their inclusion did not improve the fit of the final model.
The Validation of the NUTrition Risk in the Critically Ill Score (NUTRIC Score)
The Validation of the NUTrition Risk in the Critically Ill Score (NUTRIC Score)
The Validation of the NUTrition Risk in the Critically Ill Score (NUTRIC Score) Interaction between NUTRIC Score and nutritional adequacy (n=211) * P value for the interaction=0. 01 Heyland DK et al. Crit Care. 2011; 15: R 268.
The Validation of the NUTrition Risk in the Critically Ill Score (NUTRIC Score) § Validated in 3 separate databases including the INS Dataset involving over 200 ICUs worldwide 1, 2, 3 § Validated without IL-6 levels (modified NUTRIC)2 § Independently validated in Brazilian, Portuguese, and Asian populations 4, 5, 6 § Not validated in post hoc analysis of the PERMIT trial 7 § RCT of different caloric intake (protein more important) § Underpowered, very wide confidence intervals 1. Heyland DK et al. Crit Care. 2011; 15: R 268. 2. Rahman, Clinical Nutrition 2015 3. Compher C et al. Crit Care Med. 2017; 45(2): 156 -163. 4. Rosa Clinical Nutrition ESPEN 2016 5. Mendes J Crit Care. 2017 6. Mukhopadhyay Clinical Nutrition. 2016 7. Arabi Am J RCCM. 2016
Results of TOP UP Pilot Trial A RCT of supplemental PN in low and high BMI ICU patients Post-hoc subgroup analysis In submission
Are all low NUTRIC score patients the same? The Impact of Optimal Nutrition Intake in Low NUTRIC Patient Subgroups § Analysis of 2013/2014 INS Data § 4334 had a NUTRIC SCORE ≤ 5 of which 4060 had least 3 evaluable days § The overall 60 -day hospital mortality in this sample was 714/4060 (18%). § The median [Q 1 to Q 3] ICU length of stay was 11. 0 [6. 4 to 20. 9] days. § The mean±SD total percent prescription received by EN, PN, propofol or protein supplements during the first 12 evaluable days was 56. 7± 28. 0 for energy and 53. 0± 29. 1 for protein Per 20% increase in proportion of prescription received the adjusted odds ratio for 60 day hospital mortality was OR=1. 04 (95% CI, 0. 96 to 1. 13) for energy and OR=1. 03 (95% CI, 0. 96 to 1. 11) for protein
Are all low NUTRIC score patients the same? The Impact of Optimal Nutrition Intake in Low NUTRIC Patient Subgroups § Is there a treatment effect in various subgroups of low NUTRIC? – 10% had low BMI, – 46% in ICU >12 days – 56% had one or more marker of malnutrition (reduced po intake, hx of weight loss) § In the various subgroup analyses, no significant associations were identified § Numbers were small and unable to really test of interactions § ? Other nutritionally high-risk subgroups in the low NUTRIC group?
Association Between Nutrition Intake and SF-36 by Baseline NUTRIC Score in Patients Ventilated in ICU for > 8 Days Predictor Energy Overall Estimate (95% CI) NUTRIC 0 -5 NUTRIC 6 -9 Interaction P-value Estimate (95% CI) P-value Physical Functioning 3 mo 7. 5 (2. 1 to 12. 9) 6 mo 5. 3 (0. 2 to 10. 5) 0. 007 0. 04 3. 5 (-1. 9 to 8. 9) 1. 1 (-4. 2 to 6. 3) 0. 2 0. 69 -0. 6 (-6. 9 to 5. 6) -0. 3 (-6. 3 to 5. 8) 0. 839 0. 935 0. 31 0. 74 Role Physical 3 mo 8. 2 (3. 0 to 13. 4) 6 mo 5. 1 (-0. 0 to 10. 2) 0. 002 0. 05 5. 1 (-0. 2 to 10. 5) 1. 5 (-3. 8 to 6. 8) 0. 06 0. 58 2. 2 (-4. 1 to 8. 5) -0. 1 (-6. 2 to 5. 9) 0. 499 0. 962 0. 46 0. 68 Physical Component Scale 3 mo 1. 8 (-0. 1 to 3. 6) 6 mo 1. 8 (-0. 1 to 3. 7) 0. 06 0. 05 1. 7 (-0. 2 to 3. 7) 0. 7 (-1. 3 to 2. 6) 0. 07 0. 51 0. 9 (-1. 3 to 3. 1) -0. 5 (-2. 8 to 1. 7) 0. 402 0. 634 0. 57 0. 41 0. 05 3. 8 (-2. 0 to 9. 7) 0. 3 (-5. 4 to 6. 0) 0. 20 0. 91 -0. 6 (-7. 6 to 6. 4) 1. 2 (-5. 5 to 7. 9) 0. 867 0. 731 0. 32 0. 84 Role Physical improve 3 mo 8. 7 (3. 3 to 14. 1) physical 6 mo 4. 3 (-0. 9 to 9. 6) 0. 002 0. 10 6. 5 (0. 7 to 12. 3) 1. 0 (-4. 7 to 6. 8) 0. 03 0. 73 4. 1 (-2. 9 to 11. 0) 0. 6 (-6. 1 to 7. 3) 0. 248 0. 864 0. 58 0. 92 Physical Component Scale 3 mo 1. 9 (-0. 0 to 3. 8) 6 mo 1. 7 (-0. 2 to 3. 7) 0. 05 0. 08 2. 2 (0. 2 to 4. 3) 0. 8 (-1. 4 to 2. 9) 0. 03 0. 49 0. 8 (-1. 6 to 3. 3) -0. 3 (-2. 7 to 2. 2) 0. 498 0. 827 0. 38 0. 52 Protein Increase Physical Functioning d protein 3 mo 7. 3 (1. 7 to 12. 9) 6 mo 5. 2 (-0. 1 to 10. 6) intake = recovery Per 25% Increase in proportion of prescription received by EN or PN No difference in low vs High NUTRIC
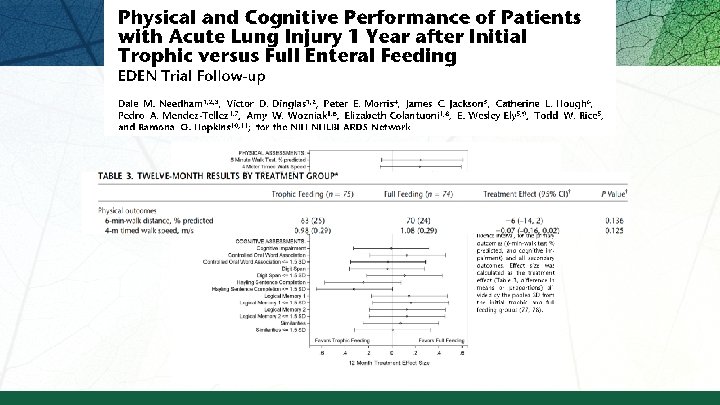
Do all ICU patients benefit the same from the point of view of their physical recovery?
Who might benefit the most from nutrition therapy? § Clinical –BMI –Projected long length of stay –Nutritional history variables § High NUTRIC Score § Low NUTRIC with risk factors § Sarcopenia –CT vs. bedside US –Frailty measures § Others?
Body Composition Lab CT Analysis Skeletal Muscle Adipose Tissue Images courtesy of Dr. Heyland
Proportion of Deceased Patients (%) Skeletal Muscle is Related to Mortality in Critical Illness Survival in Elderly Patients at ICU Admission 40 P=0. 018 30 20 10 0 Sarcopenics Moisey LL et al. Crit Care. 2013; 17(5): R 206. Non-Sarcopenics § Presence of sarcopenia associated with decreased ventilator-free days (P=0. 004) and ICU-free days (0. 002) § BMI, fat and serum albumin were not associated with ventilator- and ICU-free days
ICU Expedient Method Tillquist et al JPEN 2013 Gruther et al. J Rehabil Med 2008 Campbell et al. AJCN 1995
VALIDation of bedside Ultrasound of Muscle layer thickness of the quadriceps in the critically ill patient: The VALIDUM Study In a critically ill population, we aim to: § Evaluate intra- and (inter-) rater reliability of using ultrasound to measure QMLT. § Compare US-based quadriceps muscle layer thickness (QMLT) with L 3 skeletal muscle cross-sectional area using CT. § Develop and validate a regression equation that uses QMLT acquired by ultrasound to predict whole body muscle mass estimated by CT
Reliability Results § Intra-rater reliability of QMLT (n=119)* –Between subject variance: 0. 45 –Within Subject variance: 0. 01 –ICC (intra-class correlation coefficient): 0. 98 § Inter-rater reliability of QMLT (n=29) –Between subject variance: 0. 42 –Within Subject variance: 0. 03 –ICC (intra-class correlation coefficient): 0. 94
Descriptive Summary of CT Skeletal Muscle Mass and QMLT by Sex and Age Measurement Mean ± SD All patients (n=149) Males (n=86) Females (n=63) p-value Young (<65 years) (n=81) Elderly (>65 years) (n=68) p-value Skeletal muscle index (cm 2 m 2) 49. 0± 13. 6 55. 1± 13. 2 40. 6± 9. 1 <. 001 53. 0± 14. 8 44. 1± 10. 3 <. 001 Skeletal muscle cross sectional area (cm 2) 143. 1± 43. 6 168. 1± 36. 6 108. 5± 24. 5 <. 001 157. 4± 45. 6 126. 0± 34. 1 <. 001 Left QMLT (cm) 1. 3± 0. 6 1. 5± 0. 6 1. 1± 0. 6 <. 001 1. 4± 0. 7 1. 2± 0. 5 0. 41 Right QMLT (cm) 1. 3. ± 0. 6 1. 5± 0. 7 1. 1± 0. 6 <. 001 1. 4± 0. 7 1. 3± 0. 65 50% prevalence of low muscularity defined by CT Threshold of <55. 4 cm 2/m 2 for males and <38. 9 cm 2/m 2 for females
Association Between CT Skeletal Muscle CSA and US QMLT Pearson correlation coefficient=0. 45 P<0. 0001
Ability of QMLT to Predict Low CT Skeletal Muscle Index and CSA by Logistic Regression Outcome Low MM/n Predictors c P-value model P-value QMLT Low muscle index** 74/149 QMLT 0. 618 0. 007 Low muscle index** 74/149 covariates* 0. 712 0. 005 NA Low muscle index** 74/149 covariates + QMLT 0. 759 <0. 0001 0. 0065 Low muscle area*** 86/149 QMLT 0. 666 0. 0016 Low muscle area*** 86/149 covariates* 0. 724 0. 0008 NA Low muscle area*** 86/149 covariates + QMLT 0. 767 <0. 0001 0. 0047 *Covariates are: age (linear), sex (binary), BMI (linear), Charlson comorbidity index (linear) and admission type (binary). **Low muscle index is defined as <55. 4 cm 2/m 2 for males and <38. 9 cm 2/m 2 for females. ***Low muscle area is defined at <170 cm 2 for males and <110 cm 2 for females. Variance inflation factor for QMLT in model with all covariates is 1. 2 NA – not applicable Adapted from: Dodek PM, Wiggs BR. Resuscitation. 1998; 36(3): 201 -8.
Relationship between Sarcopenia and Frailty Mueller N et al. Ann Surg. 2016; 264(6): 1116 -1124.
Clinical Frailty Scale § Easier to operationalize § Predicts for poor outcome in ICU patients, particularly the elderly § May identify a subgroup of ‘high-risk’ patients that benefit from more nutrition?
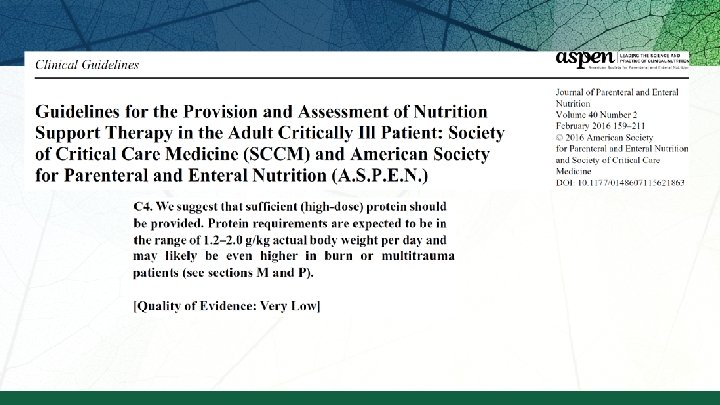
Current Practice Results of 2014 INS What are people prescribing currently? Majority use actual or estimated dry weight Goal protein requirement by weight (g/kg) Median [Q 1, Q 3] Site All US sites (63) 1. 5 [1. 2 -1. 8] 1. 3 [1. 1 -1. 6] All sites (186) 1. 2 [1. 0 -1. 5]
Current Practice Results of 2014 INS Overall Adequacy 55% § § Source of Protein 83% from EN 11. 5% from PN 6% from enteral protein supplements <1% from IV amino acids alone
Current Practice Results of 2014 INS In all comers: § At a patient level, 16% of patients averaged more than 80% protein adequacy § At a site level, 6% (11 sites) averaged more than 80% in all patients. In High NUTRIC patients: § 16% of high NUTRIC Score patients received more than 80% of prescribed amount. § 7% (16 sites) managed to provide more than 80% of prescribed amounts to high-risk patients. Performance in ‘all’ patients same as High NUTRIC patients
Is current practice providing adequate amounts of protein to critically ill patients? Particularly to ‘high-risk patients?
Start PEP u. P Protocol in all Patients within 24 -48 hrs of Admission YES EN NO End of day 3: > 80% of goal? Carry on! High risk? * Yes No Maximize EN with ümotility agents üsmall bowel feeding üprotein supplements NO Consider supplemental PN End of day 4: Tolerating EN >80%? Good job! Continue monitoring nutritional adequacy! YES Good job! Continue monitoring nutritional adequacy! Heyland, Right here, Right now!
Who might benefit the most from nutrition therapy? § Clinical –BMI –Projected long length of stay –Nutritional history variables § High NUTRIC Score § Low NUTRIC with risk factors § Sarcopenia –CT vs. bedside US –Frailty measures § Others?