Heat Transfer Simulation for the Welding of the


 • The heat transfer coefficients on all surfaces were calculated using")


- Slides: 30
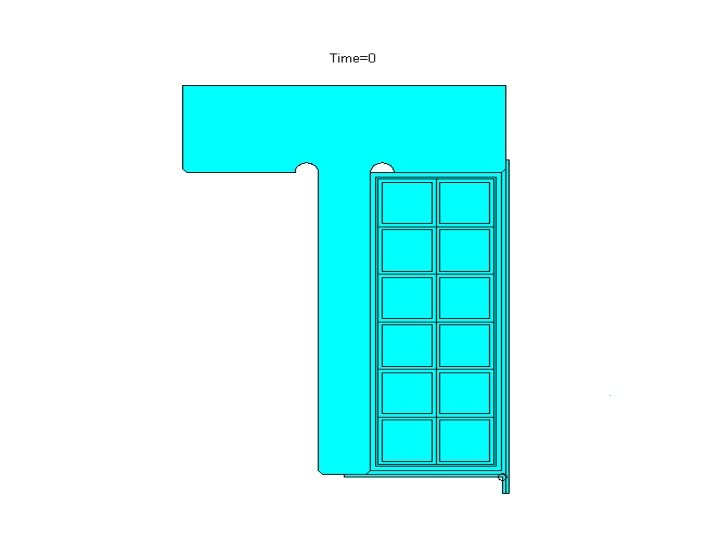
Heat Transfer Simulation for the Welding of the T-Section
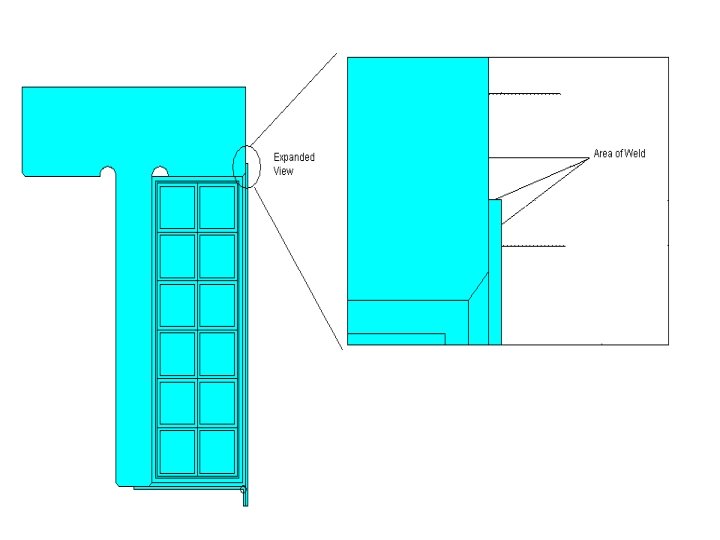
Boundary Conditions • This model was run with a Gaussian heat flux distribution for the weld zone as used in other studies. • The weld heat transfer model used is a combination of rapid heat flux followed with constant (melt) temperature imposed at the weld zone as verified by experiments.
Boundary Conditions (cont’d) • The heat transfer coefficients on all surfaces were calculated using the vertical and horizontal plate correlations available in literature. • Radiation boundary condition was applied where temperature was high.
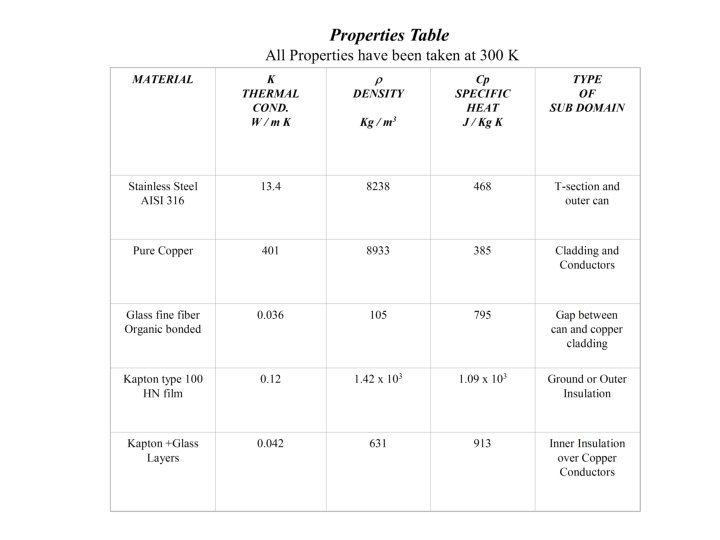
T- Section: Stainless Steel Gap: Glass Cladding: Pure Copper Outer Insl: Kapton Inner Insl: Kapton+Glass Conductors: Pure Copper
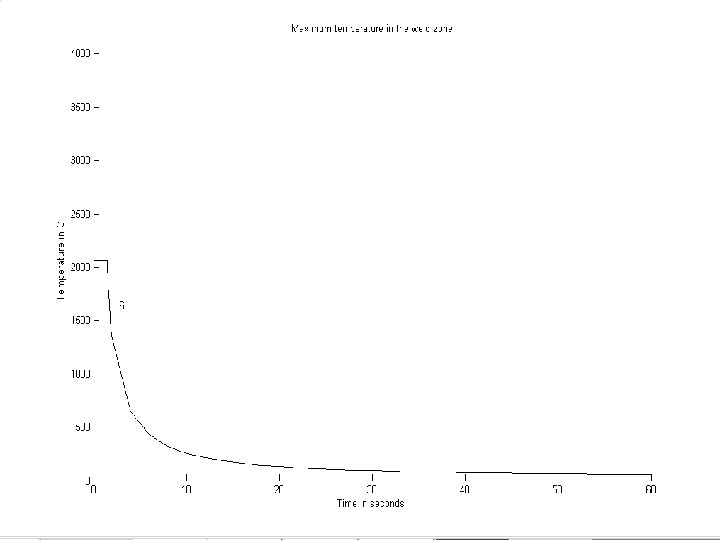
All Dimensions are in inches. All temperatures are in Kelvin, except the graphical presentation of temperature with time where Celsius is used for easier comparison with other (experimental) results.
Gaussian heat flux imposed at the weld zone 0 < time < 0. 01 secs
Addition of heat flux
Constant temperature imposed at the weld zone 0. 01 < time < 1. 5 secs
Constant Temperature
Constant Temperature
Constant Temperature
Constant Temperature
Natural Cooling with Convection and Radiation 1. 5 < time < 60 secs
Natural Cooling
Natural Cooling
Natural Cooling
Natural Cooling
Natural Cooling
Natural Cooling
Natural Cooling
Natural Cooling
Natural Cooling
Natural Cooling
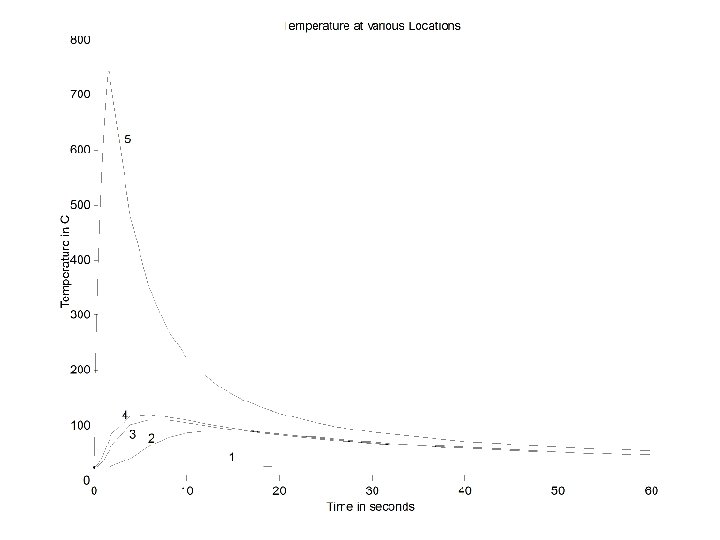
Next few slides show temperature profile at these specific locations 1 -2 Glass+Kapton 2 -3 Kapton 3 -4 Cu cladding 4 -5 Glass 6 Highest temp point 7 during welding
Conclusions • The temperatures reached in this model are higher than in the two test cases because thickness of steel sheet used here is 0. 04” compared to the 0. 06” used earlier. • The temperature results here (2 D) are higher (at least by 15% based on experiments) when compared with a 3 D model. • The maximum temperature at the edge of glass insulation observed here is 750 °C. The lower estimate for the melting of fiberglass is 820 °C.