HEART VALVES CIRCULATION OF BLOOD CONDUCTION SYSTEM SAURABH

HEART VALVES, CIRCULATION OF BLOOD, CONDUCTION SYSTEM SAURABH MARU ASSISTANT PROFESSOR SCHOOL OF PHARMACY & TECHNOLOGY MANAGEMENT, SVKM’S NMIMS, SHIRPUR

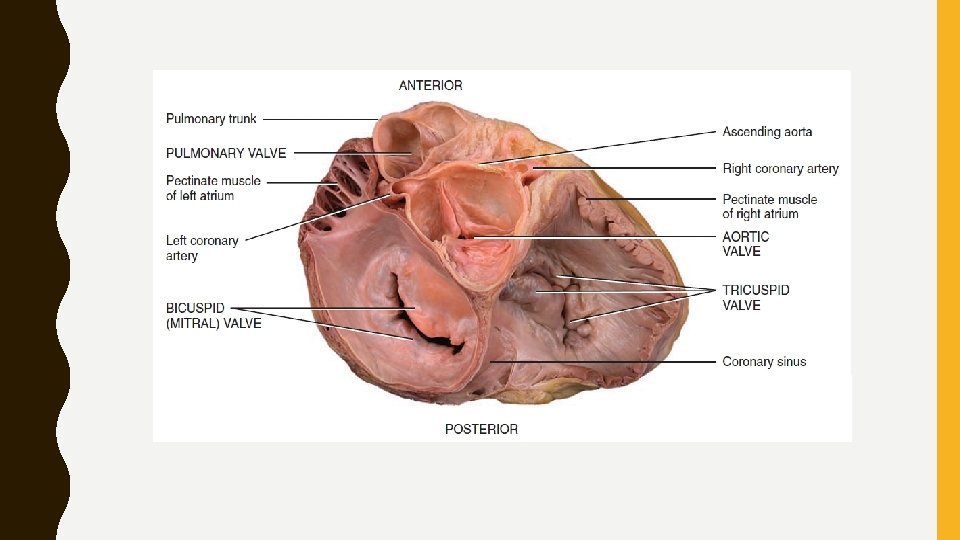
HEART VALVES AND CIRCULATION OF BLOOD • Valves open and close in response to pressure changes as heart contracts and relaxes. • Valves helps ensure the one-way flow of blood by opening to let blood through and then closing to prevent its backflow • Operation of the Atrioventricular Valves • Located between an atrium and a ventricle, tricuspid and bicuspid valves -termed atrioventricular (AV) valves. • When an AV valve is open, rounded ends of cusps project into the ventricle.
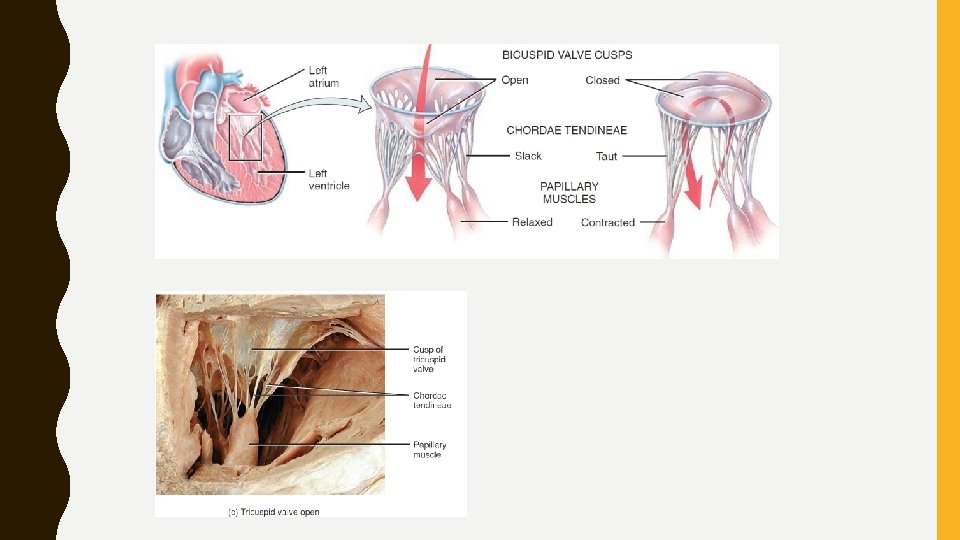

• Relaxed ventricles: papillary muscles are relaxed, chordae tendineae are slack, – blood moves from a higher pressure in atria to a lower pressure in ventricles through open AV valves • Ventricular contraction: pressure of blood drives cusps upward until their edges meet and close the opening • At same time, papillary muscles contract, which pulls on and tightens chordae tendineae. • Prevents valve cusps eversion (opening into atria) due to high ventricular pressure. • If AV valves or chordae tendineae are damaged, blood may regurgitate (flow back) into atria when ventricles contract

• Operation of the Semilunar Valves • Aortic and pulmonary valves - made up of three crescent moon– shaped cusps • Allow ejection of blood from heart into arteries but prevent backflow • When ventricles contracts, pressure builds up within chambers • Semilunar valves open when pressure in the ventricles exceeds pressure in the arteries, permitting ejection of blood from ventricles into pulmonary trunk and aorta • As the ventricles relax, blood starts to flow back toward heart • This backflowing blood fills the valve cusps, which causes free edges of semilunar valves to contact each other tightly and close this opening

• There are no valves guarding junctions between – venae cavae and right atrium or – pulmonary veins and left atrium • As atria contract, a small amount of blood does flow backward from atria into these vessels. • While contracting, atrial muscle, compresses and nearly collapses venous entry points

Systemic and Pulmonary Circulations • Heart pumps blood into two closed circuits with each beat— – systemic circulation and – pulmonary circulation (pulmon- lung)

Coronary Circulation • Nutrients are not able to diffuse quickly enough from blood in chambers of heart to supply all layers of cells that make up heart wall. • Myocardial network of blood vessels- coronary circulation • coronary arteries branch from ascending aorta and encircle heart Coronary Arteries • Two coronary arteries, right and left coronary arteries, branch from ascending aorta and supply oxygenated blood to the myocardium • Left coronary artery passes inferior to left auricle and divides into anterior interventricular and circumflex branches.
 artery - supplies oxygenated")
• Anterior interventricular branch or left anterior descending (LAD) artery - supplies oxygenated blood to walls of both ventricles. • Circumflex branch distributes xygenated blood to walls of left ventricle and left atrium • Right coronary artery supplies small branches to right atrium • It continues inferior to the right auricle and ultimately divides into posterior interventricular and marginal branches • Posterior interventricular branch supplies walls of two ventricles with oxygenated blood. • Marginal branch supply oxygenated blood to myocardium of right ventricle.

• Two artery supplying one area are connected, called as anastomoses - provide alternate routes- collateral circulation • Heart muscle have enough Collateral circulations- may receive sufficient oxygen even if one of its coronary arteries is partially blocked Coronary Veins • From arteries of coronary circulation blood flows into capillaries, delivers oxygen and nutrients to heart muscle and collects carbon dioxide and waste, and then moves into coronary veins. • Deoxygenated blood from the myocardium drains into coronary sinus • Deoxygenated blood in coronary sinus empties into right atrium

• When blockage of a coronary artery deprives the heart muscle of oxygen, reperfusion – reestablishment of blood flow, may damage tissue further. • Due to formation of oxygen free radicals (molecules with unpaired electron) from reintroduced oxygen. • Unstable, highly reactive cause chain reactions - lead to cellular damage and death. • Countered by – producing enzymes that let them less reactive – superoxide dismutase and catalase • Nutrients such as vitamin E, vitamin C, beta-carotene, zinc, and selenium serve as antioxidants- remove oxygen free radicals from circulation

Autorhythmic Fibers: The Conduction System • Inherent, rhythmical electrical activity -heart’s lifelong beat. • Source -network of specialized cardiac muscle fibers called autorhythmic fibers – self-excitable • Repeatedly generate action potentials- trigger heart contractions. Even if removed from body • 1% of cardiac muscle fibers become autorhythmic fibers 1. Act as a pacemaker, setting rhythm of electrical excitation 2. Form cardiac conduction system, a network of specialized cardiac muscle fibers - provide a path for each cycle of cardiac excitation to progress through the heart. • This enable heart to pump blood
 node,")
• Cardiac action potentials • 1 Cardiac excitation begins in sinoatrial (SA) node, located in right atrial wall just inferior and lateral to opening of superior vena cava. • SA node cells do not have a stable resting potential. - repeatedly depolarize to threshold spontaneously- pacemaker potential. • When pacemaker potential reaches threshold, it triggers an action potential • Each action potential from SA node propagates throughout both atria via gap junctions in intercalated discs of atrial muscle fibers. • Following the action potential, the two atria contract at the same time.

• Intercalated discs • discs contain desmosomes, hold the fibers together, • gap junctions, allow muscle action potentials to conduct • from one muscle fiber to its neighbors. • Gap junctions allow entire myocardium of atria or ventricles to contract as a single, coordinated unit.

CONDUCTION SYSTEM

ACTION POTENTIAL

ATP Production in Cardiac Muscle • In contrast to skeletal muscle, cardiac muscle produces little of ATPanaerobic cellular respiration • Almost exclusively on aerobic cellular respiration in its numerous mitochondria. • Needed oxygen diffuses from blood in coronary circulation and is released from myoglobin inside cardiac muscle fibers. • Cardiac muscle fibers uses several fuels to power mitochondrial ATP production. • At rest- ATP from oxidation of fatty acids (60%) and glucose (35%), smaller- lactic acid, amino acids, ketone bodies • During exercise- heart use more lactic acid (produced by actively contracting skeletal muscles) • Also produced from creatine phosphate.
- occurred is presence in")
• Myocardial infarction (heart attack, Myocardial Ischemia and Infarction)- occurred is presence in blood of creatine kinase - transfer of a phosphate group from creatine phosphate to ADP to make ATP • Normally, CK and other enzymes are confined within cells. • Injured or dying cardiac or skeletal muscle fibers release CK into the blood

Electrocardiogram • As action potentials propagate through heart, they generate electrical currents- can be detected at surface of body • An electrocardiogram-a recording of these electrical signals. • “composite record of action potentials produced by all heart muscle fibers during each heartbeat” • Instrument- electrocardiograph • In clinical practice, electrodes are positioned on arms and legs (limb leads) and at six positions on the chest (chest leads) to record the ECG. • Amplifies heart’s electrical signals and produces 12 different tracings from different combinations of limb and chest leads.
 if the conducting pathway")
By comparing these records it is possible to determine (1) if the conducting pathway is abnormal, (2) if the heart is enlarged, (3) if certain regions of the heart are damaged, (4) the cause of chest pain.

• Three clearly recognizable waves appear with each heartbeat • First, called the P wave, is a small upward deflection on the ECGrepresents atrial depolarization, which spreads from the SA node through contractile fibers in both atria. • Second wave, called the QRS complex, begins as a downward deflection, continues as a large, upright, triangular wave, and ends as a downward wave. • QRS complex represents rapid ventricular depolarization, as action potential spreads through ventricular contractile fibers. • Third wave is a dome-shaped upward deflection called the T waveindicates ventricular repolarization and occurs just as ventricles are starting to relax. • T wave is smaller and wider than QRS complex because repolarization occurs more slowly than depolarization.

• During plateau period of steady depolarization, ECG tracing is flat. • In reading an ECG, the size of waves can provide clues to abnormalities. • Larger P waves- indicate enlargement of an atrium • Enlarged Q wave - myocardial infarction • Enlarged R wave- indicates enlarged ventricles. • Flatter T wave than normal when heart muscle is receiving insufficient oxygen—as in coronary artery disease. • Elevated T wave -in hyperkalemia (high blood K level)
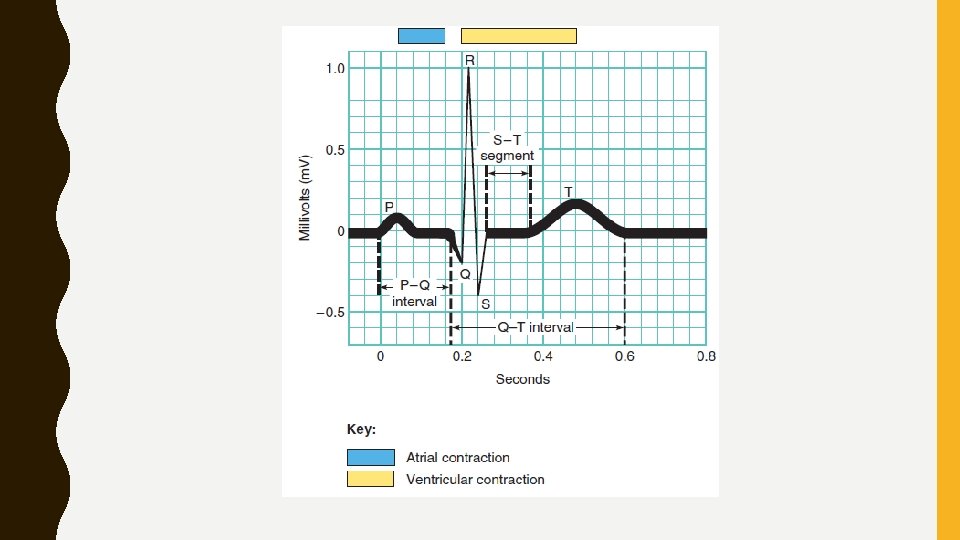

• Intervals or segments- measuring time spans between waves • P–Q interval - time from beginning of P wave to beginning of QRS complex • Represents conduction time from beginning of atrial excitation to beginning of ventricular excitation • Time required for action potential to travel through atria, atrioventricular node, and remaining fibers of conduction system • As action potential is forced to detour (a long or roundabout route taken to avoid something along way) around scar tissue caused by disorders such as coronary artery disease and rheumatic fever, P–Q interval lengthens

• S–T segment, which begins at end of S wave and ends at beginning of T wave, represents time when ventricular contractile fibers are depolarized during plateau phase of action potential. • S–T segment is elevated (above the baseline) in acute myocardial infarction and depressed (below the baseline) when heart muscle receives insufficient oxygen. • Q–T interval extends from start of QRS complex to end of T wave. • It is time from beginning of ventricular depolarization to end of ventricular repolarization

• Q–T interval may be lengthened by myocardial damage, myocardial ischemia (decreased blood flow), or conduction abnormalities. • Stress testing: to evaluate the heart’s response to stress of physical exercise • Abnormal heart rhythms and inadequate blood flow to heart may occur only briefly or unpredictably • To detect these problems, electrocardiographs are required continuous ambulatory • With this procedure, a person wears a battery-operated monitor (Holter monitor) that records an ECG continuously for 24 hours • Electrodes attached to chest are connected to monitor, and information on heart’s activity is stored in devise and retrieved later by medical personnel.

• Correlation of ECG Waves with Atrial and Ventricular Systole • atria and ventricles depolarize and then contract at different times • – as conduction system routes cardiac action potentials along a specific pathway • Systole- phase of contraction; diastole- phase of relaxation • ECG waves predict timing of atrial and ventricular systole and diastole • At a heart rate of 75 beats per minute, timing is as follows: • 1 cardiac action potential arises in SA node • It propagates throughout atrial muscle and down to AV node in about 0. 03 sec. • As atrial contractile fibers depolarize, P wave appears in ECG
 • Conduction of")
• 2 After P wave begins, atria contract (atrial systole) • Conduction of action potential slows at AV node because – fibers there have much smaller diameters and – fewer gap junctions • resulting 0. 1 -sec delay gives atria time to contract, thus adding to volume of blood in ventricles, before ventricular systole begins

• 3 action potential propagates rapidly again after entering AV bundle • About 0. 2 sec after onset of P wave, it has propagated through bundle branches, Purkinje fibers, and entire ventricular myocardium • Depolarization progresses down septum, upward from apex, and outward from endocardial surface, producing QRS complex • Same time, atrial repolarization occurs, but not evident in an ECG because larger QRS complex masks it.
 – begins after QRS")
• 4 Contraction of ventricular contractile fibers (ventricular systole) – begins after QRS complex appears and – continues during S–T segment • As contraction proceeds from apex toward base of heart, blood is squeezed upward -toward semilunar valves

Timing and route of action potential depolarization and repolarization through conduction system and myocardium. Green indicates depolarization, red indicates repolarization.

• 5 Repolarization of ventricular contractile fibers begins at apex and spreads throughout ventricular myocardium • it produces T wave in ECG about 0. 4 sec after onset of P wave • 6 Shortly after T wave begins, ventricles start to relax (ventricular diastole) • By 0. 6 sec, ventricular repolarization is complete and ventricular contractile fibers are relaxed • During next 0. 2 sec, contractile fibers in both atria and ventricles are relaxed • At 0. 8 sec, P wave appears again in ECG, atria begin to contract, and cycle repeats • Pressure Changes associated with relaxation and contraction of heart chambers, allow heart to alternately fill with blood and eject blood into aorta and pulmonary trunk

CARDIAC CYCLE • A single cardiac cycle includes all events associated with one heartbeat. • A cardiac cycle consists of systole and diastole of atria plus systole and diastole of ventricles • Pressure and Volume Changes during the Cardiac Cycle • In each cardiac cycle, atria and ventricles alternately contract and relax, forcing blood from areas of higher pressure to areas of lower pressure • As a chamber of heart contracts, blood pressure within it increases • Relation between heart’s electrical signals (ECG) and changes in atrial pressure, ventricular pressure, aortic pressure, and ventricular volume during cardiac cycle

• Pressures given in figure apply to left side of heart; pressures on right side are considerably lower • Each ventricle expels same volume of blood per beat, and same pattern exists for both pumping chambers • When heart rate is 75 beats/min, a cardiac cycle lasts 0. 8 sec • Atrial Systole • Ventricular Systole • Relaxation Period – ventricular diastole – ventricular filling
 ECG. (b) Changes in left atrial pressure (green line), left ventricular")
Cardiac cycle. (a) ECG. (b) Changes in left atrial pressure (green line), left ventricular pressure (blue line), Aortic pressure (red line) as they relate to opening and closing of heart valves. (c) Heart sounds. (d) Changes in left ventricular volume. (e) Phases of cardiac cycle.

Heart Sounds • Auscultation, act of listening to sounds within body, is usually done with a stethoscope • Comes primarily from blood turbulence caused by closing of heart valves • Smoothly flowing blood is silent. • During each cardiac cycle, there are four heart sounds, • In a normal heart only first and second heart sounds (S 1 and S 2) are loud enough to be heard through a stethoscope
, - lubb sound, – louder and a bit")
• First sound (S 1), - lubb sound, – louder and a bit longer than second sound • Causes of sound S 1 –blood turbulence - closure of the AV valves soon after ventricular systole begins • Second sound (S 2)- dupp sound, – shorter and not as loud as first, can be described as a. • Causes of sound S 2 - blood turbulence associated with closure of SL valves at beginning of ventricular diastole • S 3 - blood turbulence during rapid ventricular filling • S 4 -blood turbulence during atrial systole
: volume of blood ejected from left ventricle (or right ventricle) into")
Cardiac output (CO): volume of blood ejected from left ventricle (or right ventricle) into aorta (or pulmonary trunk) each minute, equals stroke volume (SV), volume of blood ejected by ventricle during each contraction, multiplied by the heart rate (HR), number of heartbeats per minute During mild exercise, for example, stroke volume may increase to 100 m. L/beat, and heart rate to 100 beats/min. Cardiac output then would be 10 L/min. Similarly, 150 beat/min, 130 ml/beat = 19. 5 L/min.

CARDI AC OUTPU T

Reference: https: //saurabhmaru. wordpress. com
- Slides: 41