Heart Topics 1 2 3 4 5 6


 = SV X HR ◦ At rest CO")


 and preload equalizes the output")


- Slides: 51
Heart Topics 1. 2. 3. 4. 5. 6. 7. 8. Location of the Heart Chambers of the Heart Valves Coronary Circulation Cardiac Muscle Cardiac Conduction System Cardiac Cycle Cardiac Output
Cardiac Conduction �Involuntary System �Autorhythmic
Cardiac Conduction System
Assigned Reading �Review notes on diagram 20. 10 – go through this pathway several times. �Review your first term notes on: 1. Muscle contraction - Figures 10. 6 -10. 10 2. Calcium extraction from bones 3. Types of action potentials
Action Potentials in Neurons � Depolarization � Plateau � Repolarization � Refractory Period
Action Potentials in SA Node � Depolarization � Plateau � Repolarization � Refractory Period
Action Potentials in Skeletal Cells � Depolarization � Plateau � Repolarization � Refractory Period
Action Potentials in Cardiac Cells � Rapid Depolarization � Plateau � Repolarization � Refractory Period
Cardiac ATP Production �High density of mitochondria in Cardiomyocytes = quick ATP production = resistance to fatigue. �Relies on aerobic cellular respiration (unlike skeletal muscle = anaerobic) ◦ ◦ Fatty acid metabolism (60%) Glucose metabolism (35%) Creatine phosphate Lactic acid metabolism - increases during exercise
Myocardial Infarction �Creatine kinase catalyzes the transfer of a phosphate group from creatine phosphate to ADP to make ATP. �Normally, CK and other enzymes are confined within cells. �Injured or dying cardiac or skeletal muscle fibers release CK into the blood.
The ECG Heart beat creates electrical currents on surface of body. � Recording of electrical changes of each cardiac cycle. � The initiation of each heartbeat and recording of the action of the entire heart. �
The ECG � P Wave � QRS Complex � T Wave
ECG �Compare the electrical vs. mechanical activity on these diagrams as we can INFER the mechanical activity caused by the electrical
ECG AP in SA node propagates in atrial muscle AV node depolarizes atrial fibers = P wave 2. After start of P wave = atrial contraction (systole). �AP slows at AV node (anatomical diff) = atria time to contract = increases ventricular volume. 1.
ECG 3. AP propagates fast again in bundle of HIS bundle branches (septum = Q) apex purkinje fibers ventricles QRS complex � 80 -120 ms �Atrial repolarization hidden here
ECG 4. Shortly after QRS complex = ventricular fiber contraction �Continues during S-T segment �Contraction moves from apex to base �Blood squeezed towards semi-lunar valves
ECG 5. Repolarization of ventricular fibers starts at apex and spreads = T wave (0. 4 sec after P wave) 6. Shortly after start of T wave = ventricular relaxation (diastole) �Once repolarization complete, fibers completely relax (by 0. 6
Heart Topics 1. 2. 3. 4. 5. 6. 7. 8. Location of the Heart Chambers of the Heart Valves Coronary Circulation Cardiac Muscle Cardiac Conduction System Cardiac Cycle Cardiac Output
The Cardiac Cycle � Atrial Systole � Ventricular Systole � Relaxation Period
Atrial Systole � ECG Connection: from P wave to Q wave � AV valves: open � SL valves: closed
Atrial Systole � Both atria contract ◦ Atrial pressure increases ◦ AV valves open ◦ Blood flows into both ventricles � Ventricles are relaxed ◦ Ventricular pressure too low to open SL valves � End-diastolic volume = EDV ~130 m. L � Exercise increases EDV
Ventricular Systole � Divided into two periods ◦ Isovolumetric ventricular contraction ◦ Ventricular ejection � Atria are relaxed and filling with blood
Isovolumetric Ventricular Contraction � ECG Connection: begins with R wave � AV valves: closed � SL valves: closed
Isovolumetric Ventricular Contraction � Both ventricles begin contracting ◦ Increases pressure ◦ AV valves close � Ventricular pressure too low ◦ ◦ SL valves remain closed Isovolumetric
Ventricular Ejection � ECG Connection: from S wave to T wave � AV valves: closed � SL valves: open
Ventricular Ejection � Both ventricles continue contracting ◦ Ventricular pressure continues to increase ◦ AV valves remain closed � High ventricular pressure opens SL valves ◦ Blood is ejected into pulmonary trunk and aorta � Max volume of blood ejected = ~70 m. L / ventricle � 60 m. L remains = End-systolic volume (ESV)
Stroke Volume � The volume of blood ejected from each ventricle during systole. � SV= EDV-ESV SV =130 ml – 60 ml � SV = 70 ml �
Relaxation Period � Divided into two periods: ◦ Isovolumetric ventricular relaxation ◦ Passive ventricular filling � Both atria and ventricles are relaxed and filling with blood
Isovolumetric Ventricular Relaxation � ECG Connection: begins at end of T wave � AV valves: closed � SL valves: closed
Isovolumetric Ventricular Relaxation � Both ventricles begin to relax ◦ Ventricular pressure begins to decrease ◦ Low ventricular pressure closes SL valves � Ventricular pressure too high to open AV valves
Passive Ventricular Filling � ECG Connection: after T wave to next P wave � AV valves: open � SL valves: closed
Passive Ventricular Filling � Both ventricles continue to relax ◦ Ventricular pressure continues to decrease ◦ SL valves remain closed � Atrial pressure exceeds ventricular pressure ◦ AV valves open � Blood fills the ventricles
Cardiac Cycle and Heart Rate � Metabolic increase = HR increase � Durations of atrial and ventricular systole are relatively constant � Increased heart rate decreased relaxation period
The Cardiac Cycle � Pressure � Heart sounds � Ventricular volume � Left side vs. right
Types of questions asked � � � This diagram wouldn’t be on a test but all the content is!! What electrical event initiates an action? What is the pressure relationship on either side of a valve? When are valves open or closed? Where / when is blood moving?
Heart Topics 1. 2. 3. 4. 5. 6. 7. 8. Location of the Heart Chambers of the Heart Valves Coronary Circulation Cardiac Muscle Cardiac Conduction System Cardiac Cycle Cardiac Output
Cardiac Output � The heart’s ability to discharge oxygen rich blood needs to be variable to meet the work requirements of your cells. � CO = A measure of ejected blood from the ventricles every minute.
Cardiac Output � Cardiac Output (CO) = SV X HR ◦ At rest CO = 70 X 75 ◦ At rest CO = 5. 25 L/minute � CO adjusted by changing SV or HR � Cardiac Reserve = 5 X CO
Regulation of Stroke Volume � Preload � Contractility � Afterload
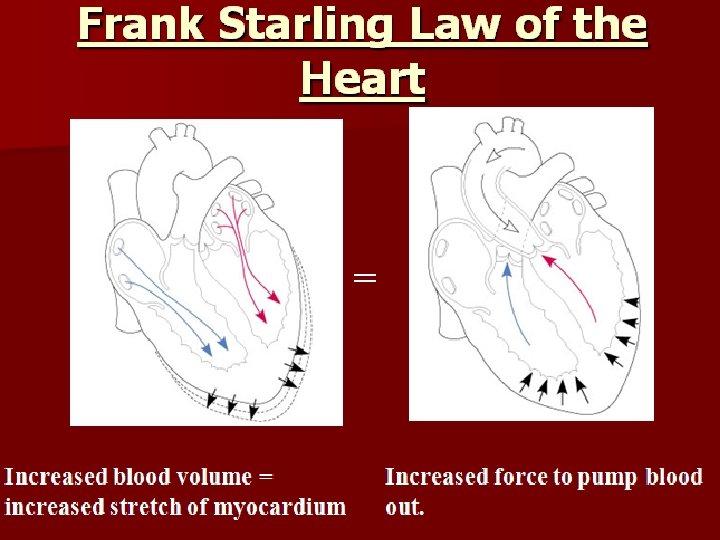
Preload � Increased stretch increased force of contraction � Increased filling during diastole increased force of contraction during systole
Preload � Determined by: ◦ Duration of ventricular diastole ◦ Venous return
Why Preload? � The relationship between ventricular filling (EDV) and preload equalizes the output of the right and left ventricles and keeps the same volume of blood flowing to both systemic and pulmonary circulations.
Afterload � Afterload – the pressure that the ventricles must overcome to open the SL valves. � Increased afterload decreased SV increases ESV
Afterload �Hypertension
Contractility � Positive inotropics increase contraction ◦ Norepinephrine and epinephrine � Negative inotropics decrease contraction ◦ Acetylcholine
Regulation of Heart Rate � Regulating HR is the body’s principal mechanism of short-term control of CO Three main mechanisms: 1. ANS 2. Endocrine system 3. Other factors �
Regulation of Heart Rate - ANS
Regulation of Heart Rate – Endocrine � Epinephrine and Norepinephrine ◦ Increase HR and contractility � Thyroid hormone ◦ Increases HR and contractility
Regulation of Heart Rate – other factors � Cations also affect heart rate: ◦ Na+ and K+ decrease HR and contractility ◦ Ca 2+ increases HR and contractility
Exercise and the Heart