Heart Rate Variability Soojin Park MD ICM Users

Heart Rate Variability Soojin Park, MD ICM+ Users Meeting Singapore, ICP 2013

Heart Rate Variability • Conventionally accepted term to describe variations in both – INTERVAL (oscillation in the interval between consecutive heart beats) – RATE (oscillations between consecutive instantaneous heart rates)

Predictive value of HRV • • • Congestive Heart Failure Mortality after Myocardial Infarction Mortality after Stroke Fetal distress Complications after Subarachnoid Hemorrhage

Autonomic modulation of the heart • RR interval or instantaneous HR generated by SA node • Main inputs to the SA node – Sympathetic nervous system (SNS) – Parasympathetic nervous system (PSNS)

Factors affecting input • • Baroreflex Thermoregulation Hormones Sleep-wake cycle Physical activity Stress Medications (B-blockade, alpha-blockade)
 shows how power (=variance) distributes as a")
Frequency-domain: interpretation • Power spectral density (PSD) shows how power (=variance) distributes as a function of frequency • Relative and total power fluctuates as a result of SNS and PSNS activity on SA node • Main spectral components: – High Frequency: 0. 15 -0. 40 Hz (2. 5 -6. 7 sec period) • Linked to PSNS activity – Low Frequency: 0. 04 -0. 15 Hz (6. 7 -25 sec period) • Reflects both SNS and PSNS activity – Very Low Frequency • Probably not physiologic, reflects baseline and trends
 – HF activity (0.")
Expected Fluctuations • Respiratory sinus arrhythmia – Vagally mediated (PSNS) – HF activity (0. 15 -0. 4 Hz) • Increases during inspiration • Decreases during expiration • Low-frequency oscillations – Associated with Traube-Hering-Mayer waves of BP – 0. 1 Hz or 10 sec period – (LF range 0. 04 -0. 15 Hz)

3 methods of frequency analysis • Lomb-Scargle periodogram – Calculate spectrum of unevenly sampled RR • Fast Fourier Most of the time, comparable results. Transform FFT & AR can sometimes have conflicting results LSP better for unevenly sampled RR – Non-parametric, simplistic algorithm • Autoregressive – Parametric, smoother spectral components, easier post processing

Frequency Analysis: A few details Open. dta HRV chart Patient populations & Abnormal beat detection Detrending (FFT & AR) Windowing (FFT)

Patient Population • Expected normal range influences parameters for abnormal beat detection – Neonates – expect much shorter beat – Experimental recording can be up to 300 -400/min

Frequency Analysis: A few details Open. dta HRV chart Patient populations & Abnormal beat detection Detrending (FFT & AR) Windowing (FFT)
 PSD estimation assumes stationarity of data; baseline trends contribute")
Advanced Detrending Method (smoothness priors) PSD estimation assumes stationarity of data; baseline trends contribute to nonstationarity and cause distortion of HRV analysis Tarvainen MP et al. An advanced detrending method with application to HRV analysis. IEEE Trans Biomed Eng. 2002; 49(2): 172 -5.

FFT Detrending AR Open. dta chart view HRV chart none linear bridge smooth. priors Choose this detrending method to minimize VLF

Frequency Analysis: A few details Open. dta HRV chart Patient populations & Abnormal beat detection Detrending (FFT & AR) Windowing (FFT)

Window Function • Applied to waveform prior to spectral analysis • Components in spectral analysis: – comparable strength with similar frequencies disparate strength with dissimilar frequencies • If no window is used, leakage from large power components will occur • Leakage can interfere with ability to distinguish 2 frequencies within a waveform

blackman rectangular Open. dta chart view HRV chart hanning kaiser hamming chebyshev flat top exponent Default window bartlett

Frequency-domain HRV: length of recording period • Spectral analysis of entire 24 hour period (as well as spectral results of shorter segments averaged over 24 hours) provide AVERAGES of the modulations attributable to the LF and HF components • Obscures detailed information about autonomic modulation of RR intervals available in shorter recordings • 5 min windows are a good standard
 • SDSD: standard deviation of sequential differences in RR durations •")
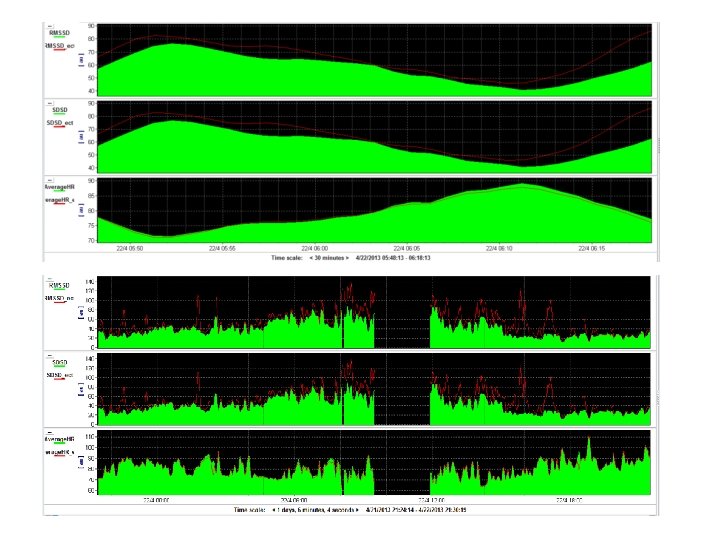
Time-domain HRV (select) • SDSD: standard deviation of sequential differences in RR durations • RMSSD: square root of the mean squared differences of successive NN intervals – Short term variation – Estimates high frequency variations in HR

Using ICM plus to evaluate HRV in the Time Domain

Time-domain HRV: length of recording period • Dependent on length of recording period • Must be standardized – 5 min – 24 hour

• LF/HF slope during the first 3 days was a significant predictor of secondary complications after SAH – – – • • LF component (sympathetic) increased over 3 days in pts with complications HF component (vagal) decreased over 3 days in pts with complications LF/HF ratio increased over 3 days in pts with complications N=30, excluded pts with prior cardiac disease or autonomic dysfunction, analysed 5 min stationary ECG segments between 900 -1700 Method – Ectopic-free data detrended and resampled – Estimated power spectral density of each 5 min recording using FFT – Quantified power spectra into standard frequency-domain measurements (VLF, HF power) normalized units (each power component divided by total power minus VLF components) determined mean value of each parameter from three 5 min segments from each day – Identified trend of HRV changes within each patient (rather than btwn patients): Compared each daily mean power component against baseline value (parameter from day 1) amount of change from day 1 to day 3 in each parameter estimated using least squares regression line slopes • Caution: same pattern seen in acute MI; HF is significantly related to respiratory sinus rhythm (while these pts were mechanically ventillated with RR btwn 10 -18, fundamental respiratory frequency (FRF) was not controlled for

High Grade a. SAH pt who developed Takotsubo cardiomyopathy Symptomatic after neosynephrine started, with increased WOB, prompting a repeat TTE (EF 60% 10%) RMSSD analysis, showing decrease in HRV preceding respiratory distress (and discovery of CM by several hours) Coefficient of Variation = SD/mean Park S, Kaffashi F, Loparo KA, Jacono FJ. The use of HRV for the early detection of treatable complications after a. SAH. JCMC. E-pub 25 April 2013
- Slides: 23