
Heart health equity What prospects Norman Sharpe Disproportionate
- Slides: 8
Heart health equity What prospects? Norman Sharpe
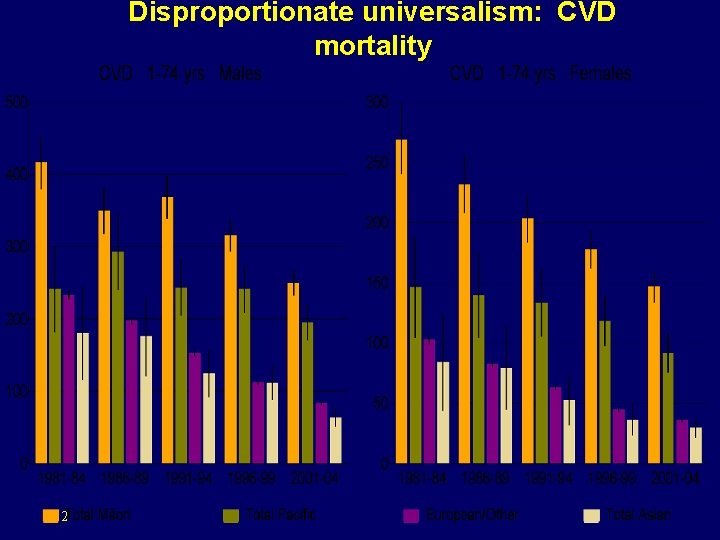
Disproportionate universalism: CVD mortality 2
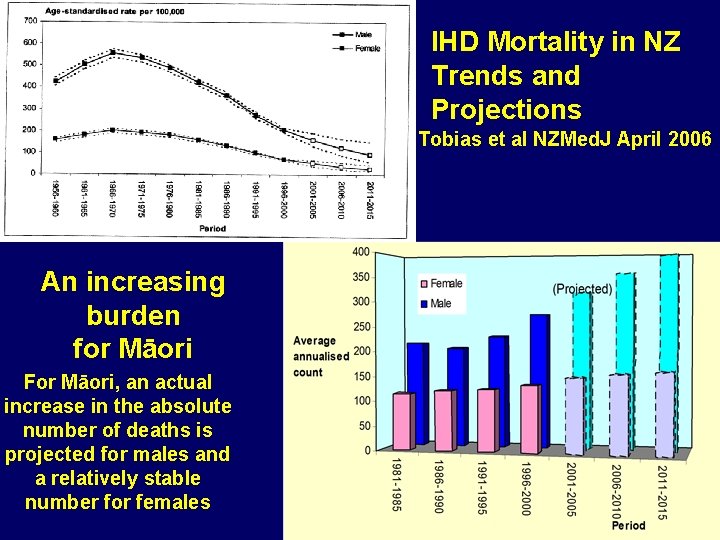
IHD Mortality in NZ Trends and Projections Tobias et al NZMed. J April 2006 An increasing burden for Māori For Māori, an actual increase in the absolute number of deaths is projected for males and a relatively stable number for females
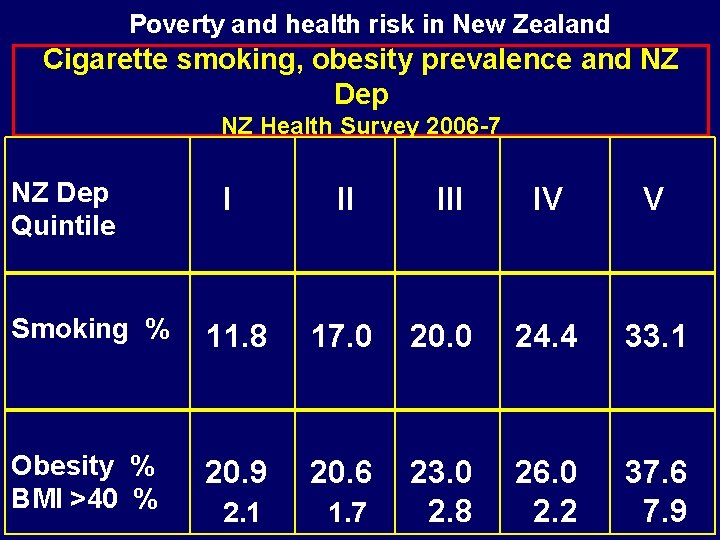
Poverty and health risk in New Zealand Cigarette smoking, obesity prevalence and NZ Dep NZ Health Survey 2006 -7 NZ Dep Quintile I II IV V Smoking % 11. 8 17. 0 20. 0 24. 4 33. 1 Obesity % BMI >40 % 20. 9 20. 6 2. 1 1. 7 23. 0 2. 8 26. 0 2. 2 37. 6 7. 9
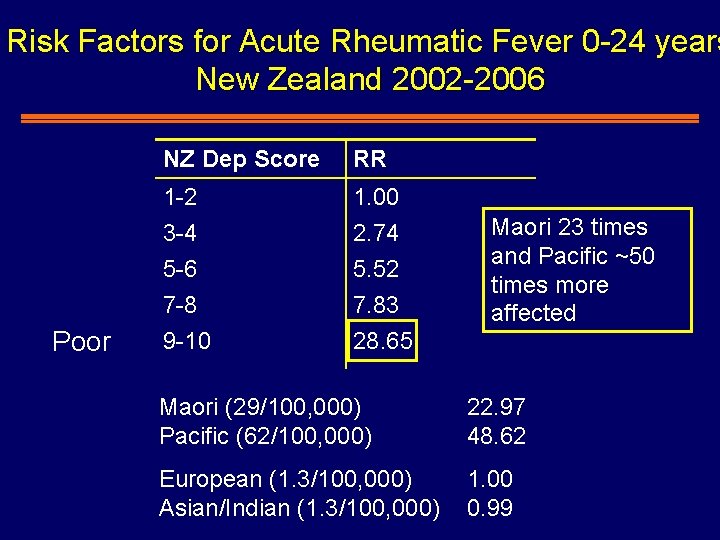
Risk Factors for Acute Rheumatic Fever 0 -24 years New Zealand 2002 -2006 Poor NZ Dep Score RR 1 -2 3 -4 5 -6 7 -8 9 -10 1. 00 2. 74 5. 52 7. 83 28. 65 Maori 23 times and Pacific ~50 times more affected Maori (29/100, 000) Pacific (62/100, 000) 22. 97 48. 62 European (1. 3/100, 000) Asian/Indian (1. 3/100, 000) 1. 00 0. 99
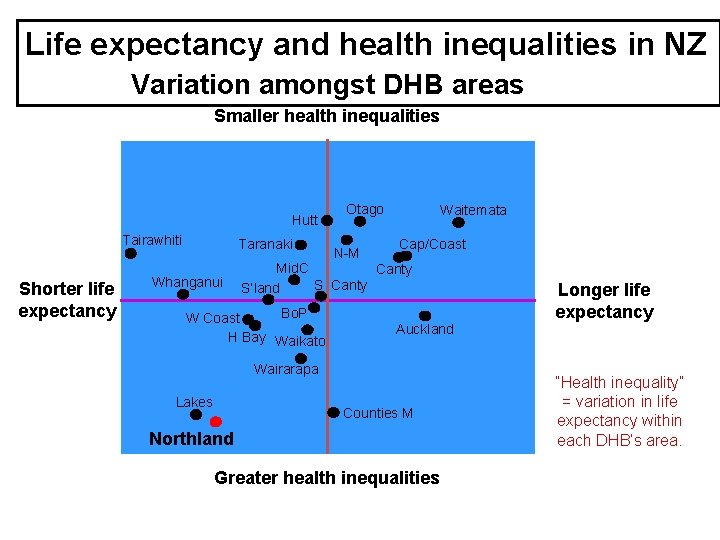
Life expectancy and health inequalities in NZ Variation amongst DHB areas Smaller health inequalities Hutt Tairawhiti Shorter life expectancy Taranaki Whanganui Otago N-M Waitemata Cap/Coast Mid. C Canty S’land Bo. P W Coast H Bay Waikato Auckland Wairarapa Lakes Longer life expectancy Counties M Northland Greater health inequalities “Health inequality” = variation in life expectancy within each DHB’s area.
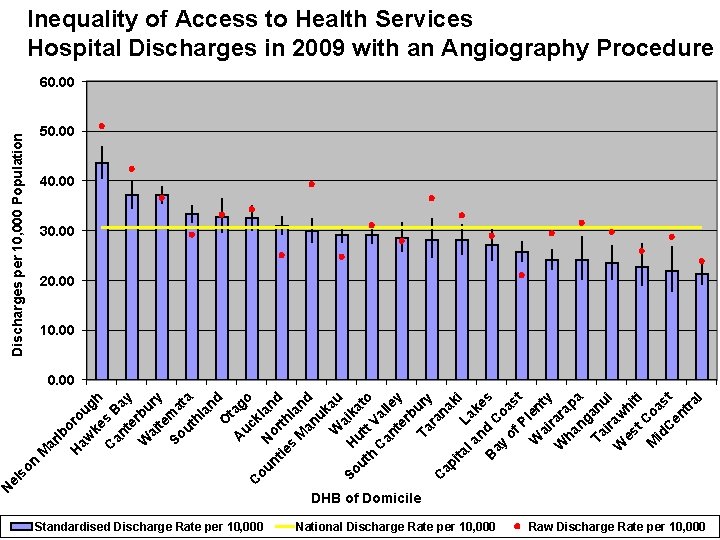
M ar lb H oro aw u ke gh C s. B an te ay W rbu ai r te y So ma ut ta hl an d O A tag uc o C k ou N lan nt or th d ie s l M and an uk W au So H aik ut utt ato h C Val an le te y rb Ta ury ra C na ap ki ita L l a ak n e B d. C s ay o of as Pl t W en ty ai W rara ha p ng a Ta an ir ui W aw es hi t C ti M o id as C en t tr al n so el N Discharges per 10, 000 Population Inequality of Access to Health Services Hospital Discharges in 2009 with an Angiography Procedure 60. 00 50. 00 40. 00 30. 00 20. 00 10. 00 DHB of Domicile Standardised Discharge Rate per 10, 000 National Discharge Rate per 10, 000 Raw Discharge Rate per 10, 000
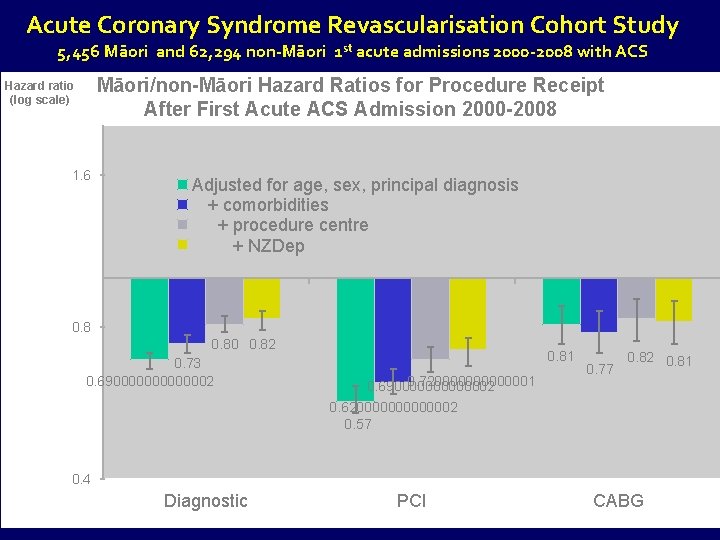
Acute Coronary Syndrome Revascularisation Cohort Study 5, 456 Māori and 62, 294 non-Māori 1 st acute admissions 2000 -2008 with ACS Māori/non-Māori Hazard Ratios for Procedure Receipt After First Acute ACS Admission 2000 -2008 Hazard ratio (log scale) 1. 6 Adjusted for age, sex, principal diagnosis + comorbidities + procedure centre + NZDep 0. 80 0. 82 0. 73 0. 690000002 0. 81 0. 720000001 0. 690000002 0. 620000002 0. 57 0. 77 0. 82 0. 81 0. 4 Diagnostic PCI CABG