HEALTHY HOMES DATA USING PUBLICLY AVAILABLE DATA TO

HEALTHY HOMES DATA USING PUBLICLY AVAILABLE DATA TO STRENGTHEN YOUR HEALTHY HOMES PROGRAM Amanda Reddy, MS National Center for Healthy Housing
 data matters Where to find data relevant")
What we’ll cover today: Why (the right) data matters Where to find data relevant to healthy homes at the national, state, and local levels. Examples of how to use data to promote and sustain your programs.

Monitor progress Target resources Articulate need/value to potential funders Engage partners Assessthe impact Refine the approach

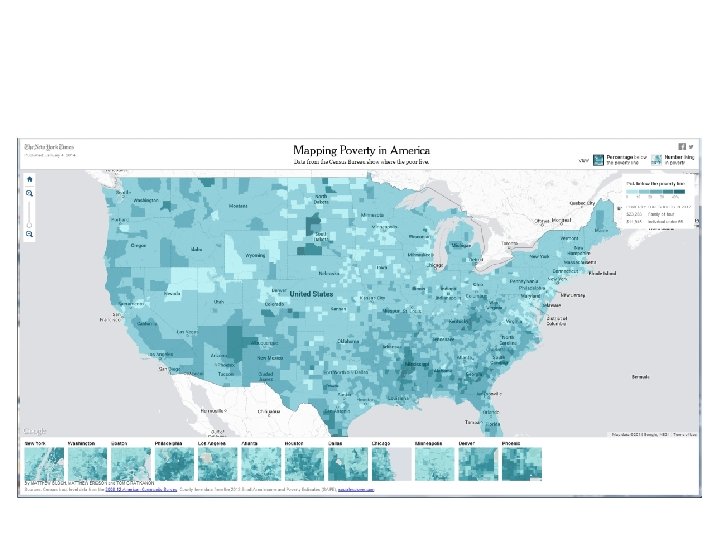
Demographics Risk factors associated with housing-related injury and illness: age and type of housing poverty geographical location age of residents Race/ethnicity of residents Typical sources: U. S. Census (census tracts); county health rankings (county level for select measures); Environmental Public Health Tracking (county level for select measures)

Demographics Total Population Age Distribution 0 -17 years 18 -24 years 25 -44 years 45 -64 years 65+ years Race/Ethnicity Black or African American White Asian Hispanic or Latino Income and Education Median Household Income Less than $25, 000 Percent of Families in Poverty Morrell Park/ Violetville CSA Baltimore County State of Maryland 9, 095 809, 941 5, 828, 289 19. 6% 8. 7% 28. 4% 25. 8% 17. 6% 22. 0% 10. 1% 25. 6% 27. 7% 14. 6% 23. 4% 9. 6% 26. 9% 27. 6% 12. 5% 18. 8% 73. 3% 2. 4% 4. 3% 26. 8% 65. 4% 5. 2% 4. 4% 30. 0% 61. 1% 5. 8% 8. 4% $39, 931 29. 9% 11. 4% $65, 411 15. 6% 5. 3% $72, 419 15. 1% 6. 1% Source: Baltimore Intermodal Health Impact Assessment, NCHH, 2013

www. census. gov/geo/maps-data/tiger. html

Housing Quality May be difficult to find for all geographies, but some sources include: American Housing Survey www. census. gov/housing/ahs/ State of Healthy Housing (www. nchh. org/Policy/2013 Stateof. Healthy. Housing. asp) www. huduser. org/portal/datasets/ahs. html American Community Survey www. census. gov/acs/www/ http: //factfinder 2. census. gov/faces/nav/jsf/pages/index. xhtml Environmental Public Health Tracking http: //ephtracking. cdc. gov/show. Home. action Grantee sites

American Housing Survey

Source: State of Healthy Housing, NCHH, 2013

EPA State Radon Maps www. epa. gov/radon/zonemap. html

Health Outcomes Asthma Lead Poisoning Injuries Burns Falls Poisonings
, CDC Asthma Call-Back Survey (ACBS), CDC www.")
Asthma Behavioral Risk Factor Surveillance System (BRFSS), CDC Asthma Call-Back Survey (ACBS), CDC www. cdc. gov/asthma/ACBS. htm Environmental Public Health Tracking, CDC www. cdc. gov/asthma/brfss/default. htm http: //ephtracking. cdc. gov/show. Home. action State Asthma Control Programs, Surveillance Data www. cdc. gov/asthma/contacts/default. htm www. health. ny. gov/statistics/ny_asthma/index. htm http: //phpa. dhmh. maryland. gov/mch/Site. Pages/asthma_surv. aspx
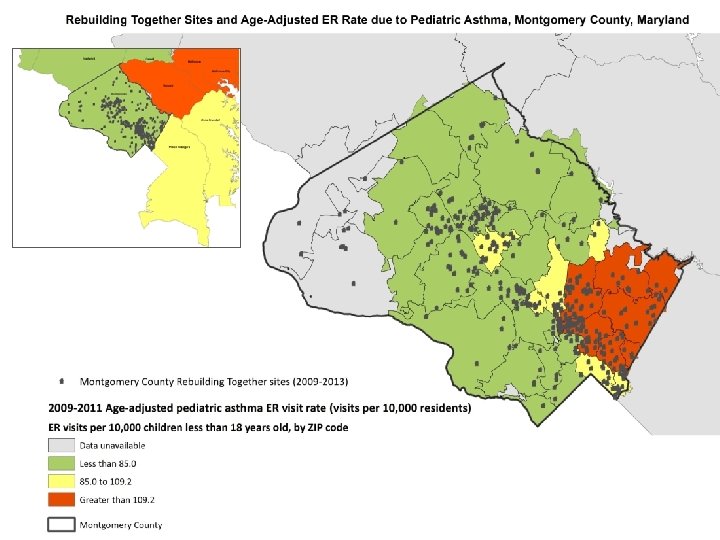

Community Asthma Profile Target Area NYS U. S. Current asthma among adults 11. 8% 9. 8% 8. 6% Current asthma among children 17 years 13. 9% 7. 4% 8. 4% Taught early warning signs of worsening asthma 94. 9% 67. 6% 60. 0% Have a prescription for long-term controller 57. 1% 42. 2% 33. 5% --- 44. 4% 50. 9% Asthma ED visit rate per 10, 000 residents 299. 8 83. 4 55. 4 Asthma hospitalization rate per 10, 000 residents 47. 3 20. 5 15. 2 Advised to modify school/work/home environment
 www.")
Safety and Injuries CDC Web-based Injury Statistics Query and Reporting System (WISQARS ) www. cdc. gov/injury/wisqars/index. html State departments of health National Fire Protection Association www. nfpa. org American Housing Survey (see previous link) Environmental Public Health Tracking (see previous link) BRFSS Preparedness data (selected states) www. cdc. gov/mmwr/preview/mmwrhtml/mm 6136 a 1. htm State sites and surveillance reports www. citizencorps. fema. gov/cc/search. Cert. do? submit. By. Zip

Safety and Injuries Place of Fall, Ages 65+, New York State Residents, 2006 -2008 Hospitalizations ED Visits

Safety and Injuries

Fire safety

Lead Poisoning CDC, Childhood Lead Poisoning Data, Statistics, and Surveillance www. cdc. gov/nceh/lead/data/index. htm States may have maps and exportable data tables: Elevated BLL by county, year of test Lead screening by county, year of birth Age of housing Childhood poverty Environmental Public Health Tracking (see previous link)

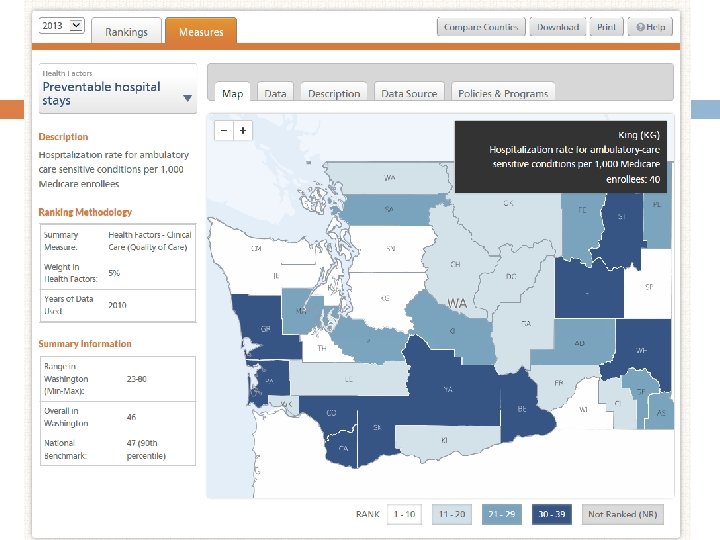
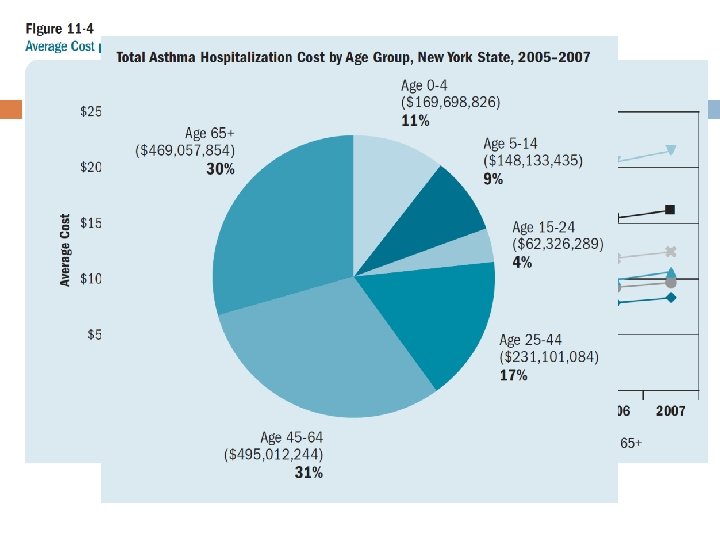
Healthcare Utilization Hospitalizations ED visits Medication usage Primary care and specialists Typical sources: county health rankings (county level); Dartmouth Medical Atlas; state DOH surveillance and claims data

Other sources to consider 911 data Hospitals/health plans Local or state health department, other agencies County data portals

General tips Be deliberate and thoughtful about your use of data Use validated tools when possible Think about the appropriate scale/geography Avoid common mistakes (e. g. , averaging percentages) Use data with intention Saves time, avoids known problems, allows for comparison Consider your audience (What will they find most compelling? How do they like to receive information? Can you make it more visually appealing? ) Pair quantitative data with qualitative stories Packaging matters! Technical support available – Just ask! State DOH, academic partners, NCHH, other local or regional partners

For more information: Amanda Reddy, MS National Center for Healthy Housing areddy@nchh. org
- Slides: 26