
Health inequalities briefing Enfield March 2018 Version 1
Health inequalities briefing Enfield March 2018 Version 1. 3 Released March 2018
What are health inequalities? "Health inequalities are differences between people or groups due to social, geographical, biological or other factors. These differences have a huge impact, because they result in people who are worst off experiencing poorer health and shorter lives. " NICE https: //www. nice. org. uk/advice/lgb 4/chapter/introduction 2 Health Inequalities in Enfield Version 1. 3 Released March 2018
About the briefing l The Global Burden of Disease (GBD) highlights the conditions causing the largest burden (in terms of disability-adjusted life years) in the London region l The purpose of this briefing is to demonstrate inequalities in important high-burden diseases - defined either because they are high-burden as measured by the GBD, or because they are strongly associated with income deprivation locally (or both) l This briefing also includes a number of indicators where there is a particularly strong statistical linear relationship with income deprivation at ward level l It uses routinely available data from the Local Health website (www. localhealth. org. uk, downloaded November 2017) l This briefing uses 2016 ward boundaries and income deprivation data for 2015 3 Health Inequalities in Enfield Version 1. 3 Released March 2018
Glossary of Technical Terms Used R-Squared This is a statistical term which describes how close the data are to a line-of-best -fit. It ranges from 0 (not very good) to 1 (perfect). Note: In the real world, a value of 1 is extremely unlikely! Weighted Mean This is an average that has been adjusted so that wards with larger populations have a greater effect on it. Linear Regression Model This is a technical term for a line-of-best-fit. As with the weighted mean, all of the regression models are weighted by ward population size. 4 Health Inequalities in Enfield Version 1. 3 Released March 2018
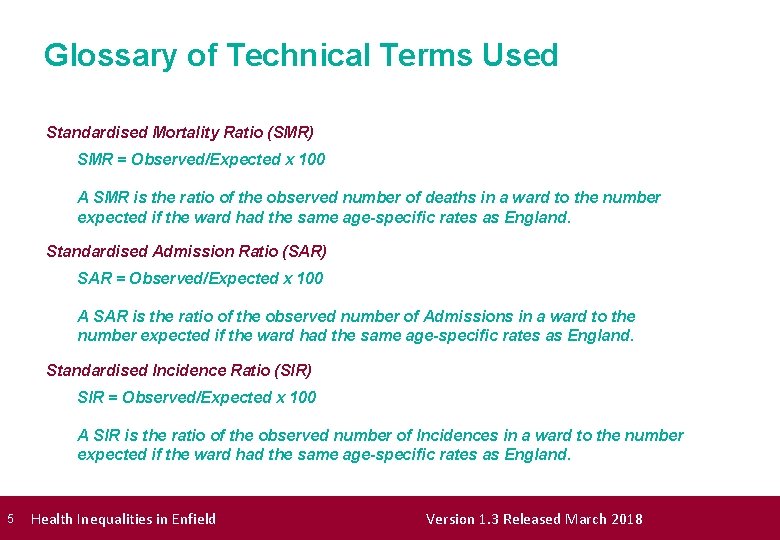
Glossary of Technical Terms Used Standardised Mortality Ratio (SMR) SMR = Observed/Expected x 100 A SMR is the ratio of the observed number of deaths in a ward to the number expected if the ward had the same age-specific rates as England. Standardised Admission Ratio (SAR) SAR = Observed/Expected x 100 A SAR is the ratio of the observed number of Admissions in a ward to the number expected if the ward had the same age-specific rates as England. Standardised Incidence Ratio (SIR) SIR = Observed/Expected x 100 A SIR is the ratio of the observed number of Incidences in a ward to the number expected if the ward had the same age-specific rates as England. 5 Health Inequalities in Enfield Version 1. 3 Released March 2018
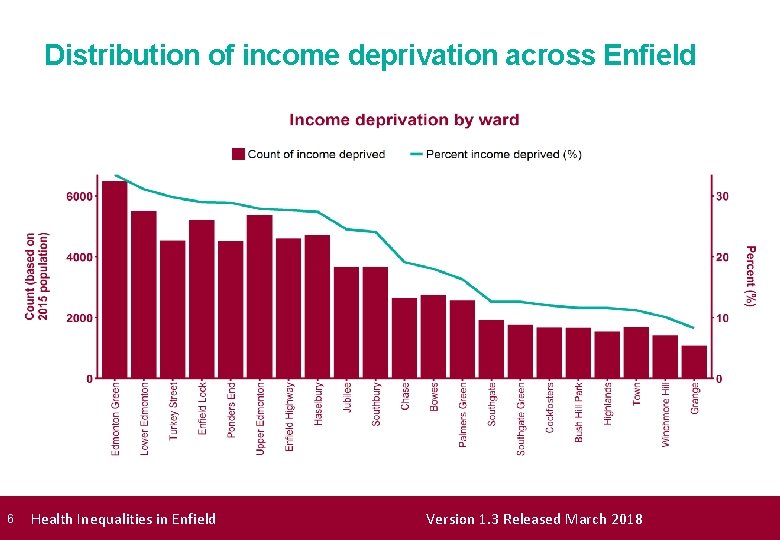
Distribution of income deprivation across Enfield 6 Health Inequalities in Enfield Version 1. 3 Released March 2018
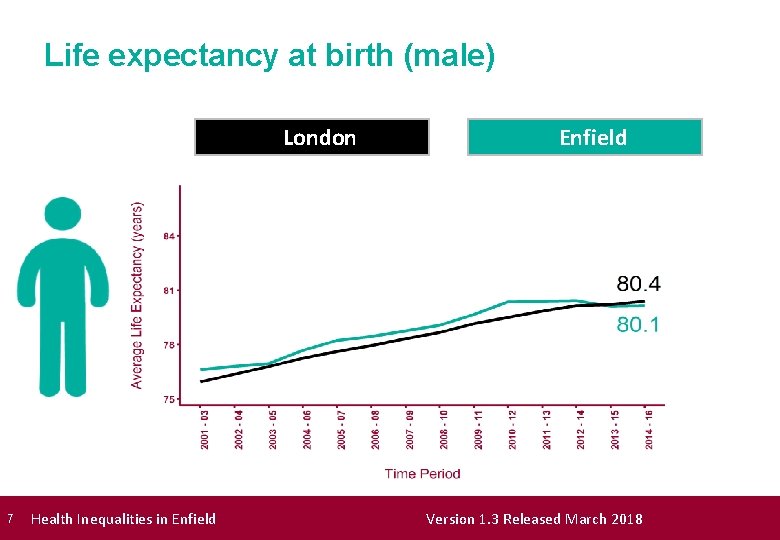
Life expectancy at birth (male) London 7 Health Inequalities in Enfield Version 1. 3 Released March 2018
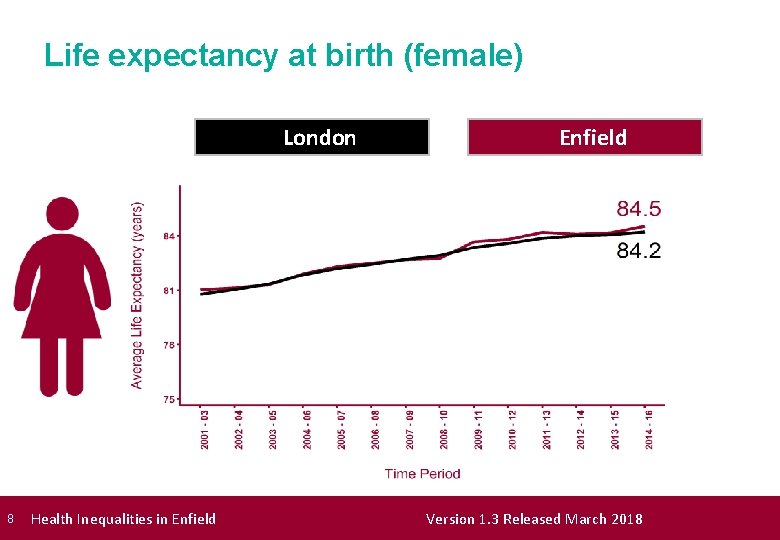
Life expectancy at birth (female) London 8 Health Inequalities in Enfield Version 1. 3 Released March 2018
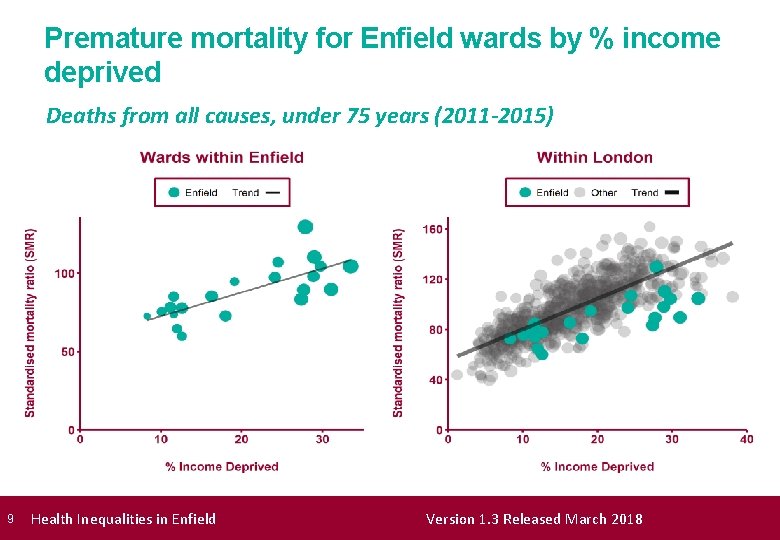
Premature mortality for Enfield wards by % income deprived Deaths from all causes, under 75 years (2011 -2015) 9 Health Inequalities in Enfield Version 1. 3 Released March 2018
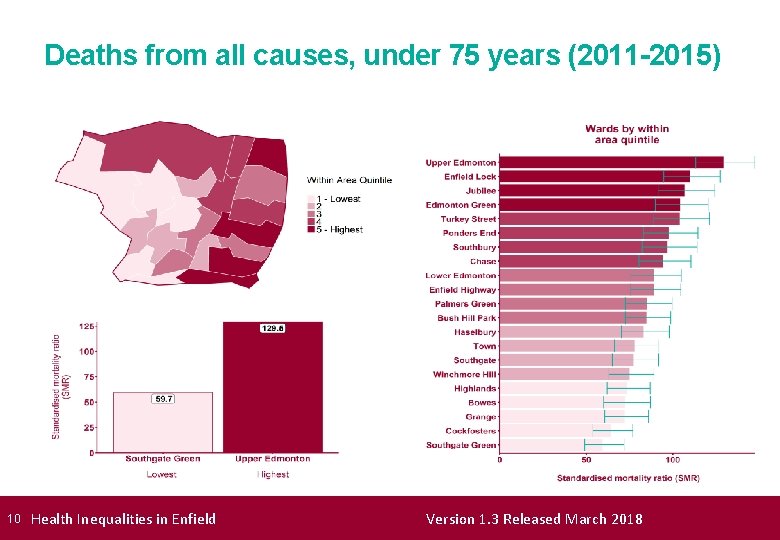
Deaths from all causes, under 75 years (2011 -2015) 10 Health Inequalities in Enfield Version 1. 3 Released March 2018
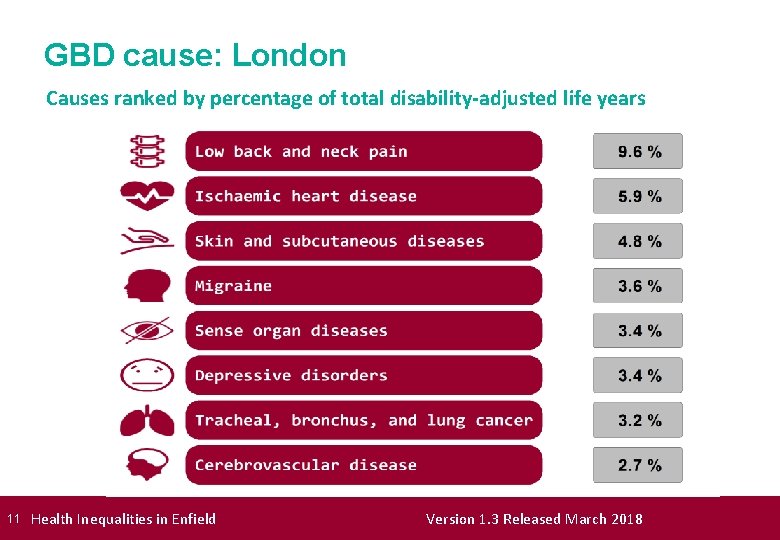
GBD cause: London Causes ranked by percentage of total disability-adjusted life years 11 Health Inequalities in Enfield Version 1. 3 Released March 2018
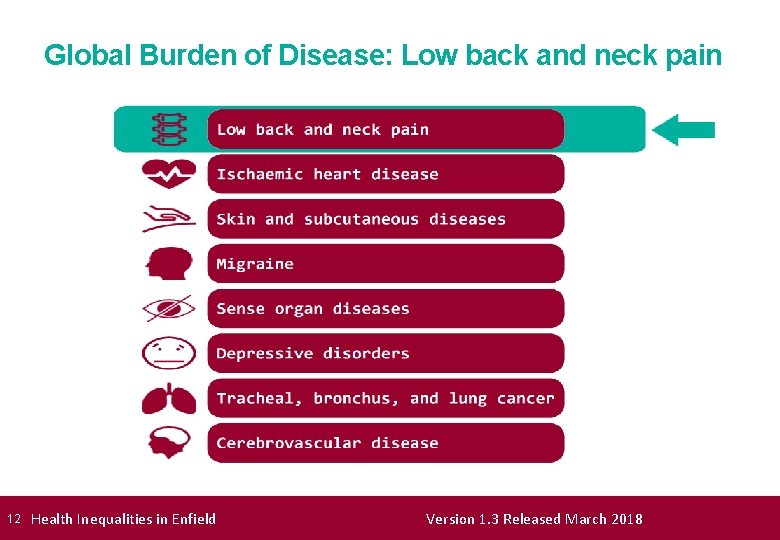
Global Burden of Disease: Low back and neck pain 12 Health Inequalities in Enfield Version 1. 3 Released March 2018

Low back and neck pain - National picture 13 Health Inequalities in Enfield Version 1. 3 Released March 2018
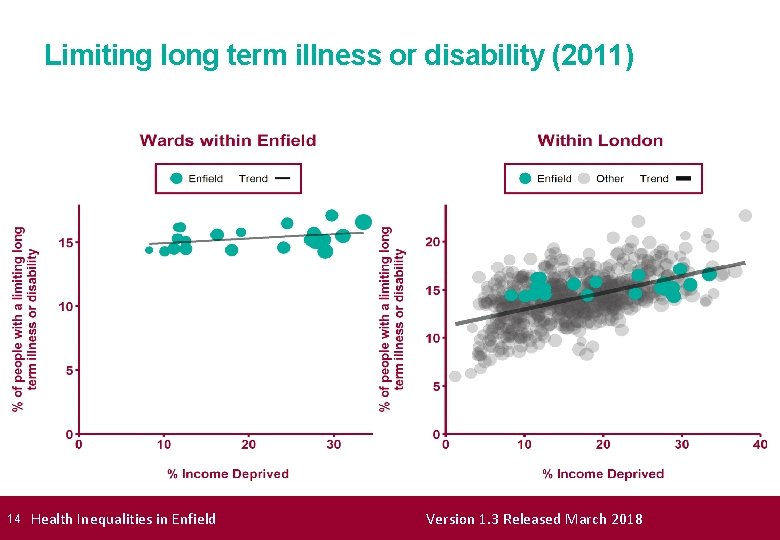
Limiting long term illness or disability (2011) 14 Health Inequalities in Enfield Version 1. 3 Released March 2018
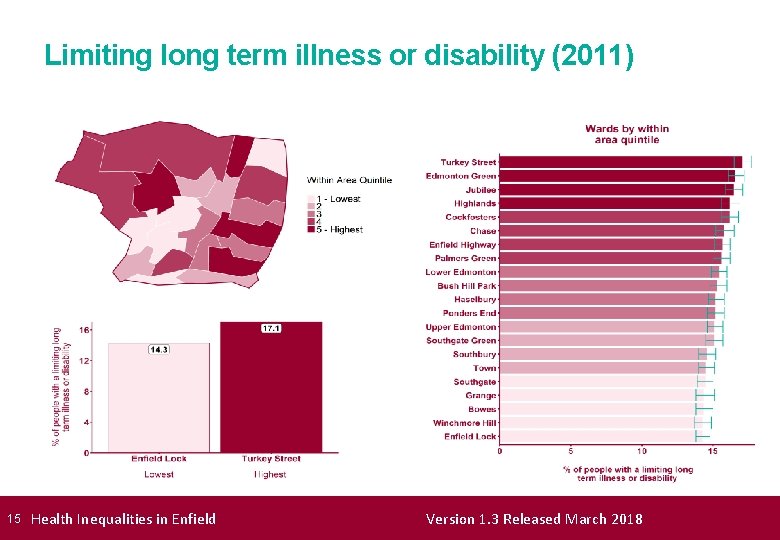
Limiting long term illness or disability (2011) 15 Health Inequalities in Enfield Version 1. 3 Released March 2018
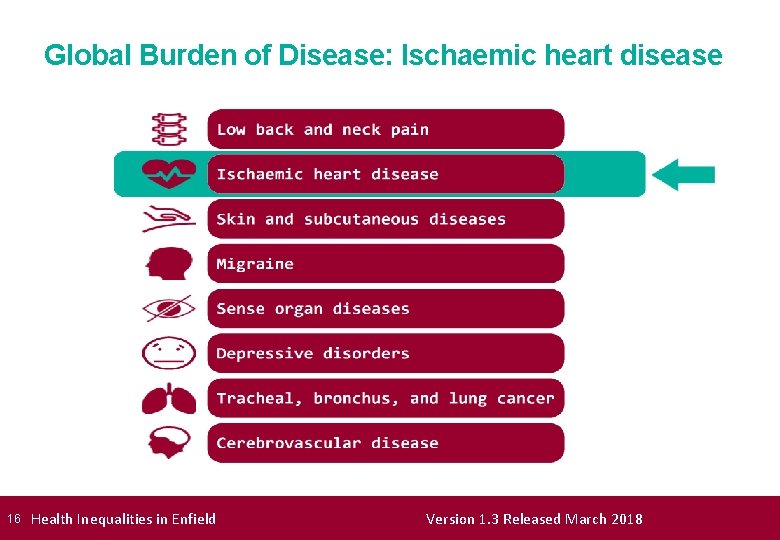
Global Burden of Disease: Ischaemic heart disease 16 Health Inequalities in Enfield Version 1. 3 Released March 2018
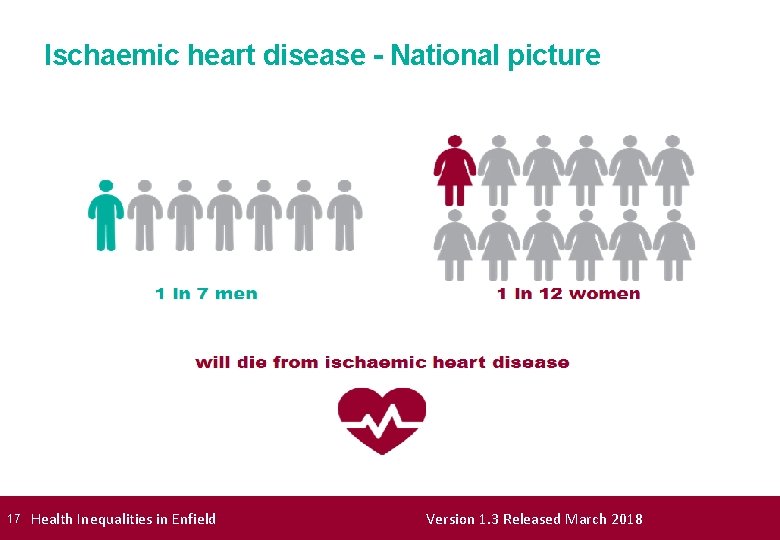
Ischaemic heart disease - National picture 17 Health Inequalities in Enfield Version 1. 3 Released March 2018
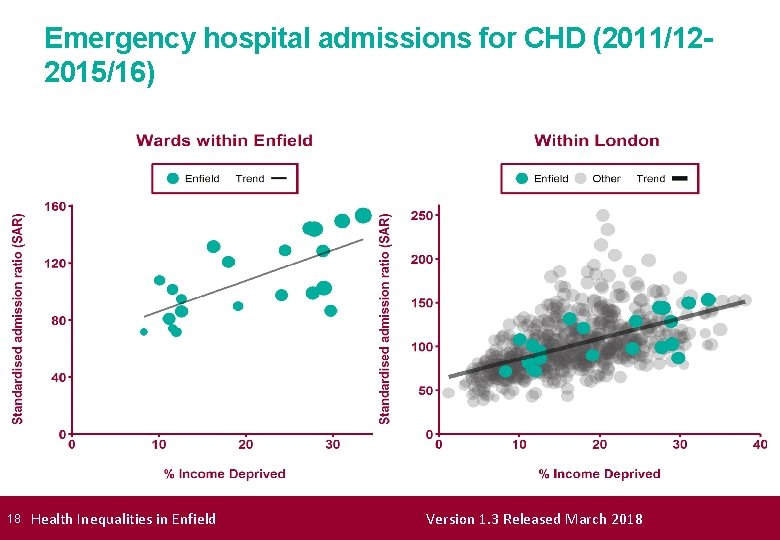
Emergency hospital admissions for CHD (2011/122015/16) 18 Health Inequalities in Enfield Version 1. 3 Released March 2018

Emergency hospital admissions for CHD (2011/122015/16) 19 Health Inequalities in Enfield Version 1. 3 Released March 2018
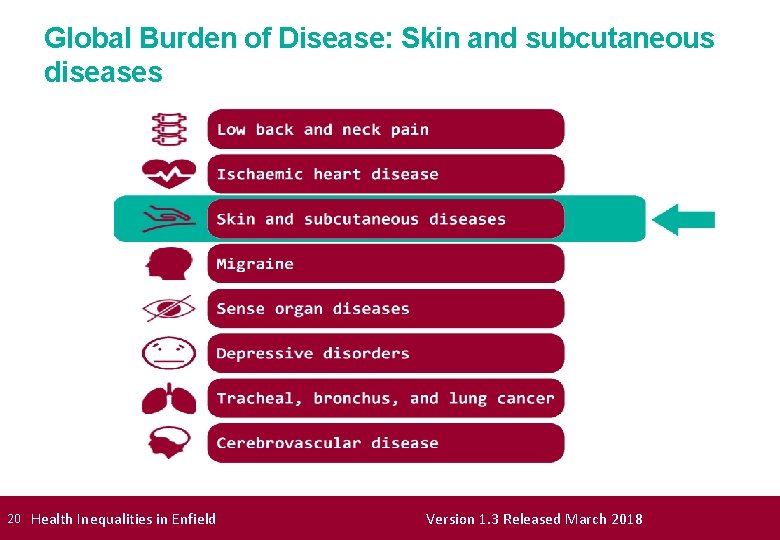
Global Burden of Disease: Skin and subcutaneous diseases 20 Health Inequalities in Enfield Version 1. 3 Released March 2018
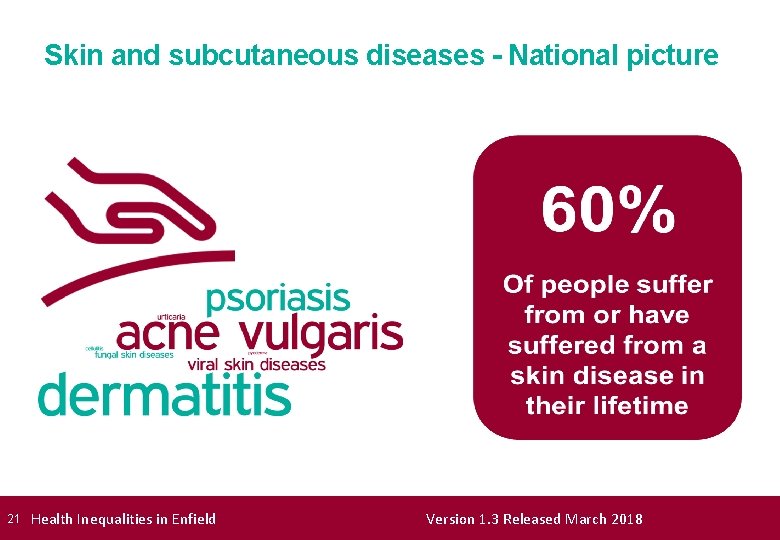
Skin and subcutaneous diseases - National picture 21 Health Inequalities in Enfield Version 1. 3 Released March 2018
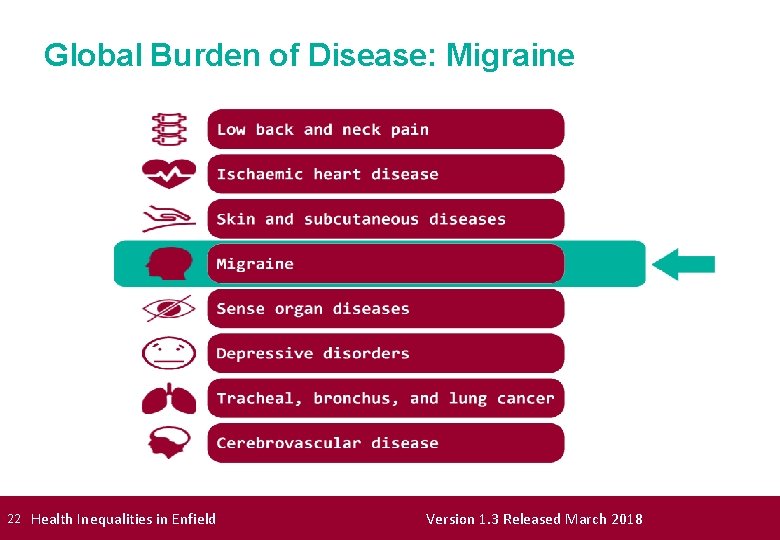
Global Burden of Disease: Migraine 22 Health Inequalities in Enfield Version 1. 3 Released March 2018
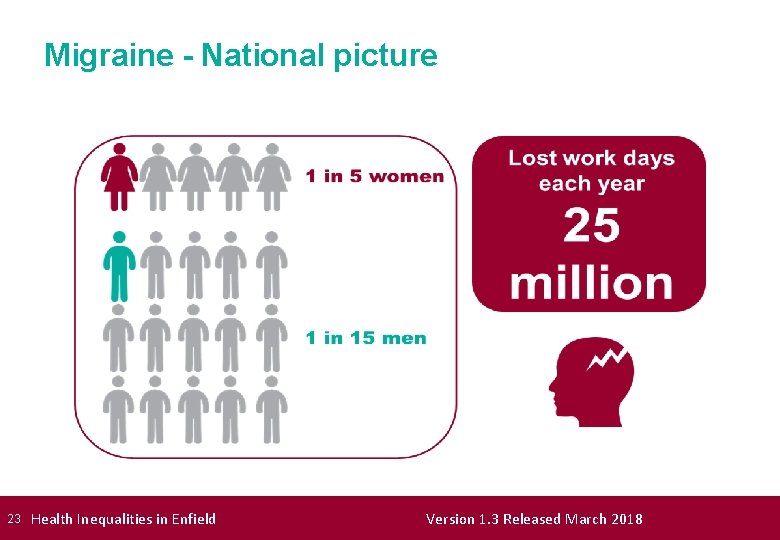
Migraine - National picture 23 Health Inequalities in Enfield Version 1. 3 Released March 2018
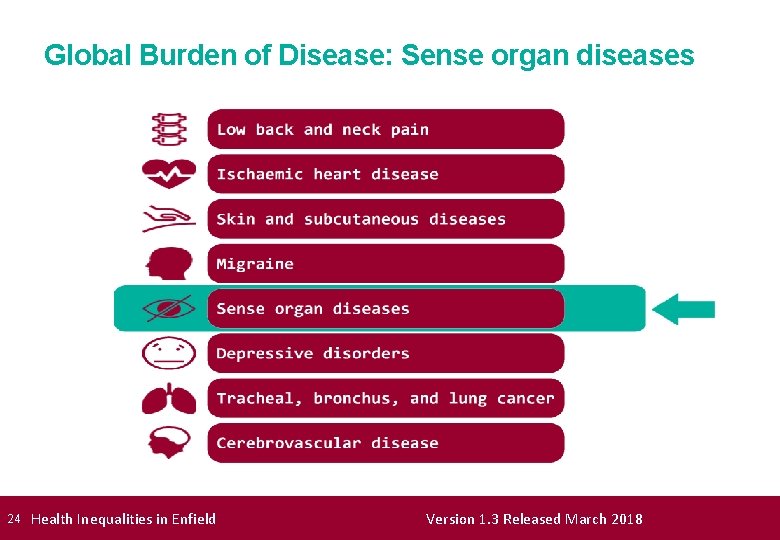
Global Burden of Disease: Sense organ diseases 24 Health Inequalities in Enfield Version 1. 3 Released March 2018
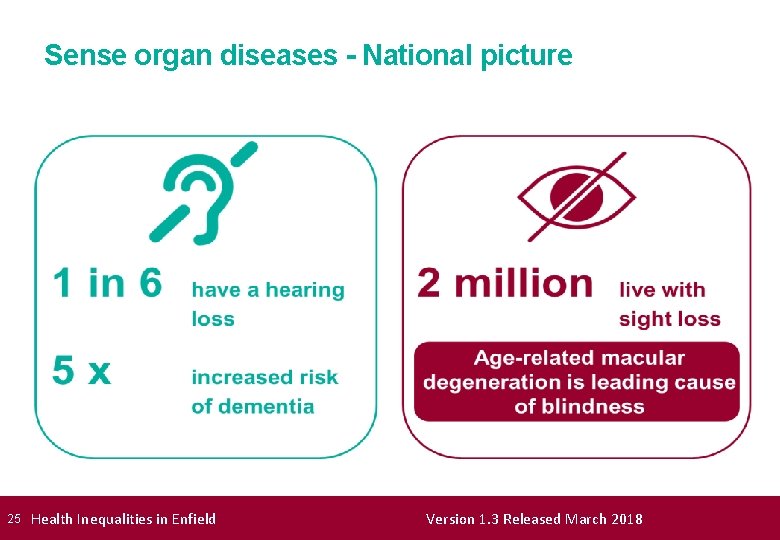
Sense organ diseases - National picture 25 Health Inequalities in Enfield Version 1. 3 Released March 2018
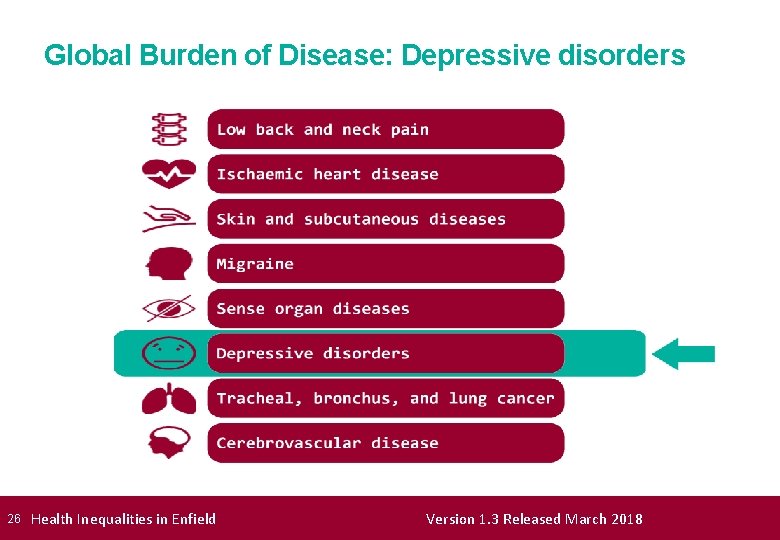
Global Burden of Disease: Depressive disorders 26 Health Inequalities in Enfield Version 1. 3 Released March 2018

Depressive disorders - National picture 27 Health Inequalities in Enfield Version 1. 3 Released March 2018
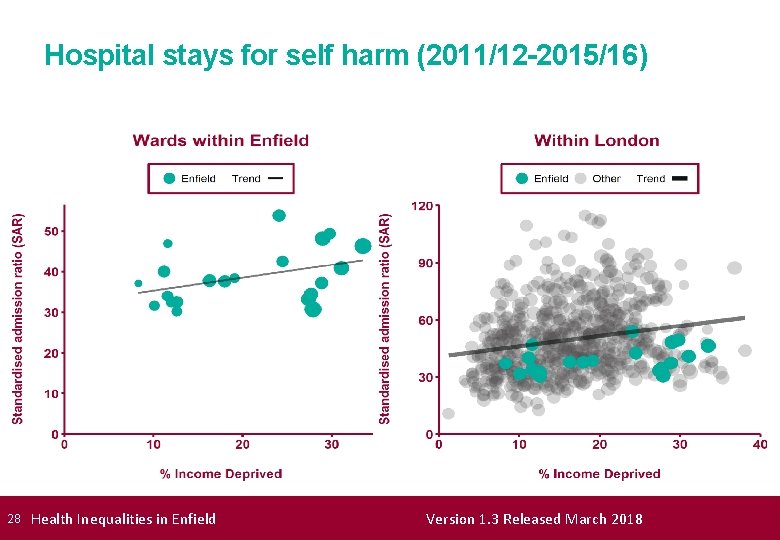
Hospital stays for self harm (2011/12 -2015/16) 28 Health Inequalities in Enfield Version 1. 3 Released March 2018
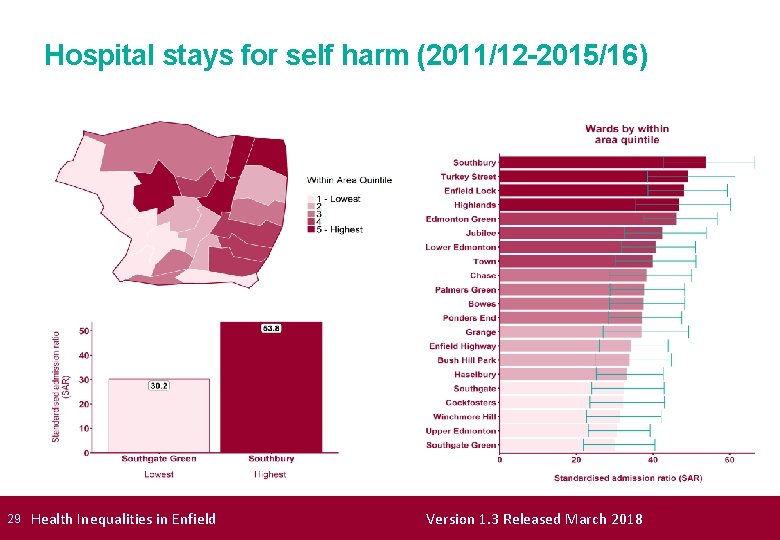
Hospital stays for self harm (2011/12 -2015/16) 29 Health Inequalities in Enfield Version 1. 3 Released March 2018

Global Burden of Disease: Tracheal, bronchus, and lung cancer 30 Health Inequalities in Enfield Version 1. 3 Released March 2018
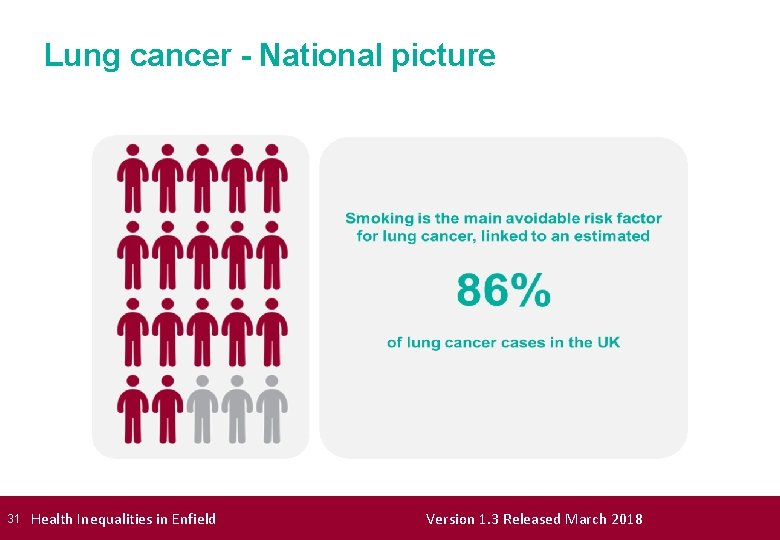
Lung cancer - National picture 31 Health Inequalities in Enfield Version 1. 3 Released March 2018
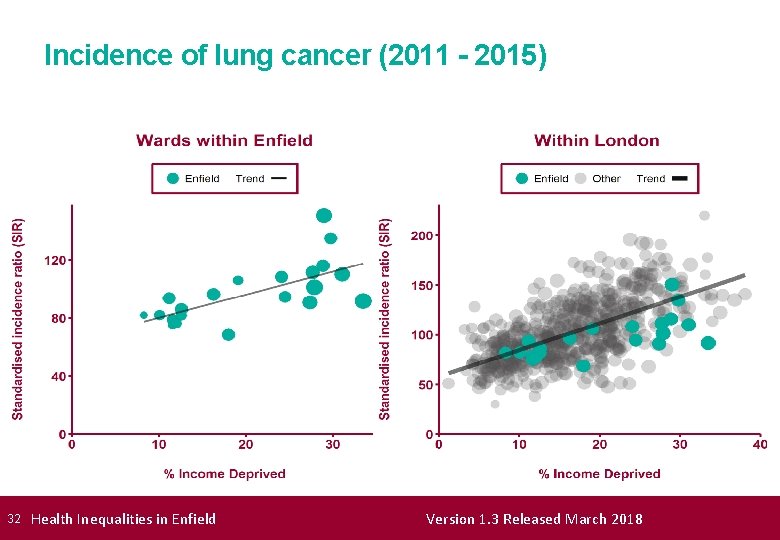
Incidence of lung cancer (2011 - 2015) 32 Health Inequalities in Enfield Version 1. 3 Released March 2018
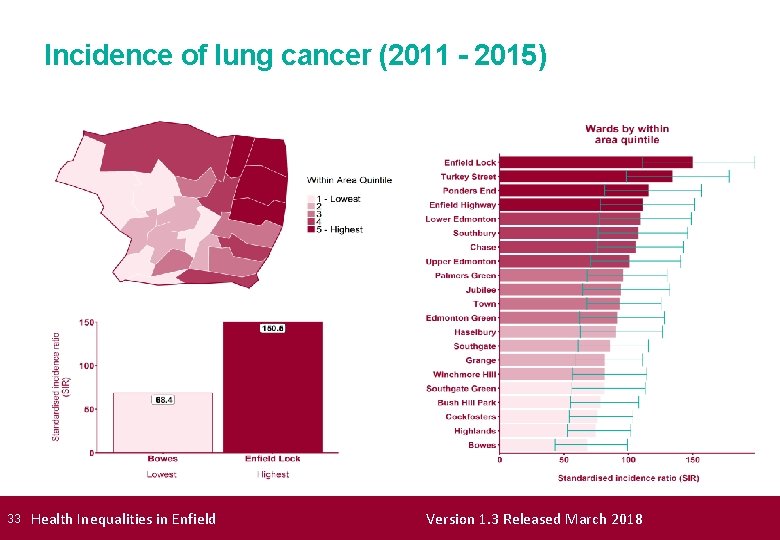
Incidence of lung cancer (2011 - 2015) 33 Health Inequalities in Enfield Version 1. 3 Released March 2018

Global Burden of Disease: Cerebrovascular disease 34 Health Inequalities in Enfield Version 1. 3 Released March 2018
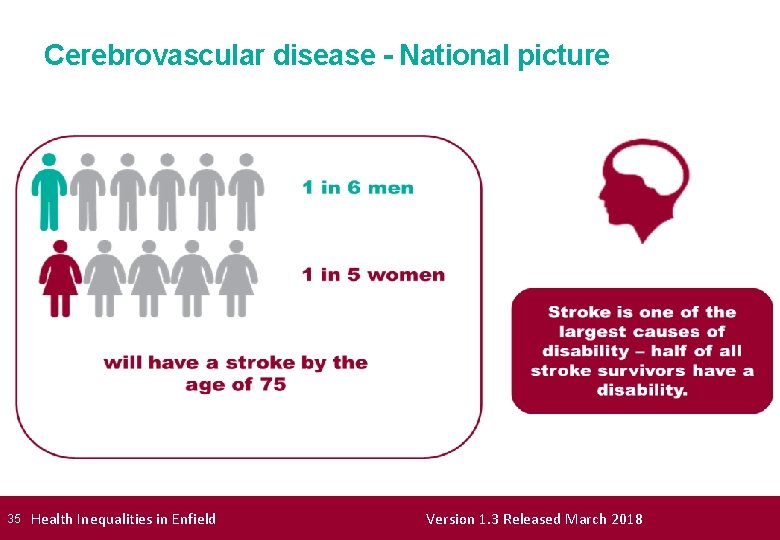
Cerebrovascular disease - National picture 35 Health Inequalities in Enfield Version 1. 3 Released March 2018
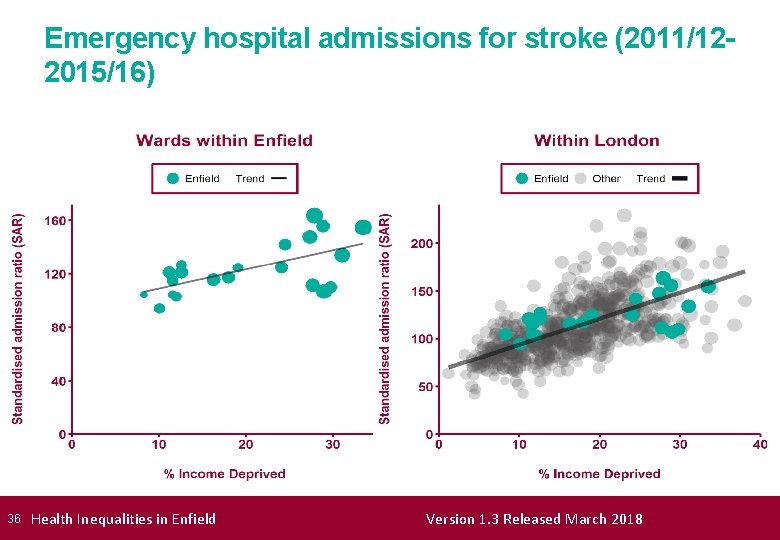
Emergency hospital admissions for stroke (2011/122015/16) 36 Health Inequalities in Enfield Version 1. 3 Released March 2018
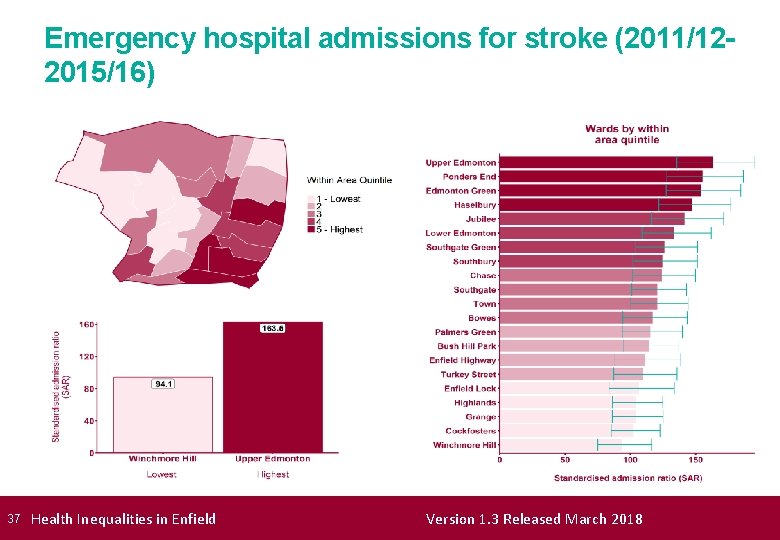
Emergency hospital admissions for stroke (2011/122015/16) 37 Health Inequalities in Enfield Version 1. 3 Released March 2018
Health inequalities within Enfield Some other indicators show a particularly strong association with income deprivation The following slide lists those indicators most strongly associated with deprivation locally, with the top three (not already analysed) explored further 38 Health Inequalities in Enfield Version 1. 3 Released March 2018
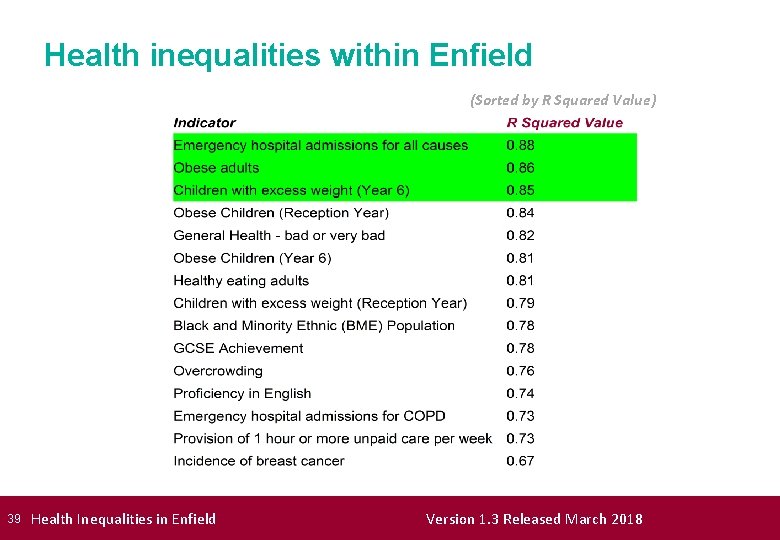
Health inequalities within Enfield (Sorted by R Squared Value) 39 Health Inequalities in Enfield Version 1. 3 Released March 2018
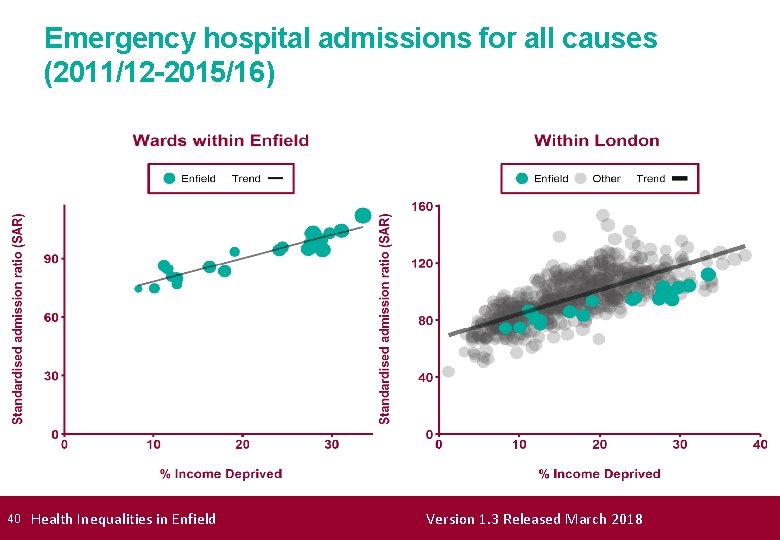
Emergency hospital admissions for all causes (2011/12 -2015/16) 40 Health Inequalities in Enfield Version 1. 3 Released March 2018
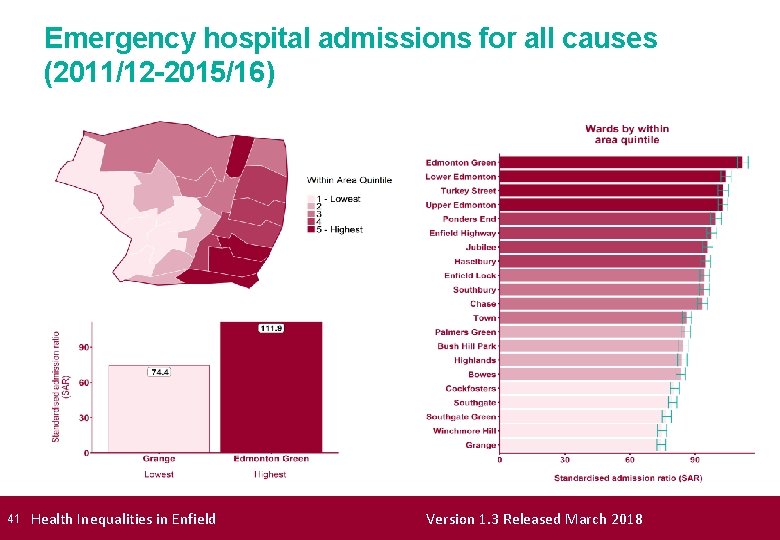
Emergency hospital admissions for all causes (2011/12 -2015/16) 41 Health Inequalities in Enfield Version 1. 3 Released March 2018
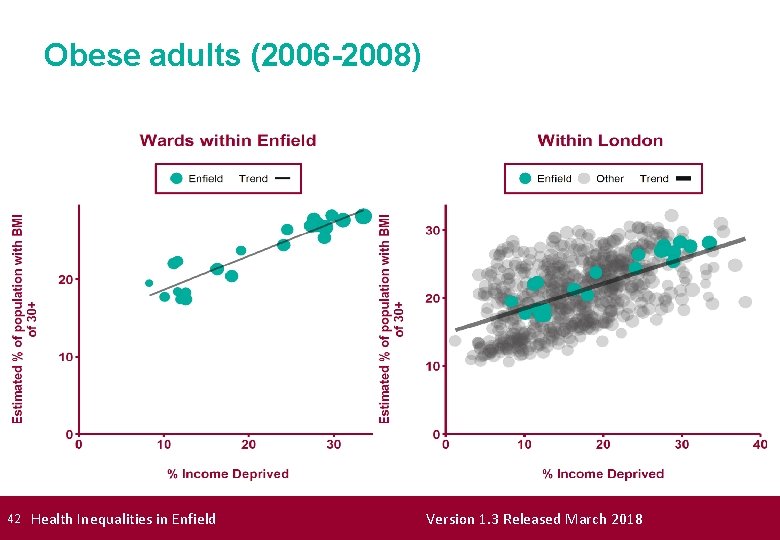
Obese adults (2006 -2008) 42 Health Inequalities in Enfield Version 1. 3 Released March 2018

Obese adults (2006 -2008) 43 Health Inequalities in Enfield Version 1. 3 Released March 2018
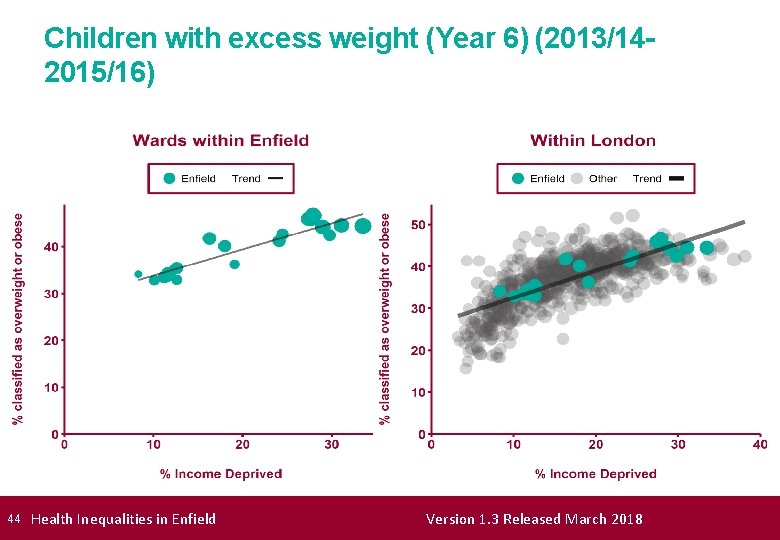
Children with excess weight (Year 6) (2013/142015/16) 44 Health Inequalities in Enfield Version 1. 3 Released March 2018
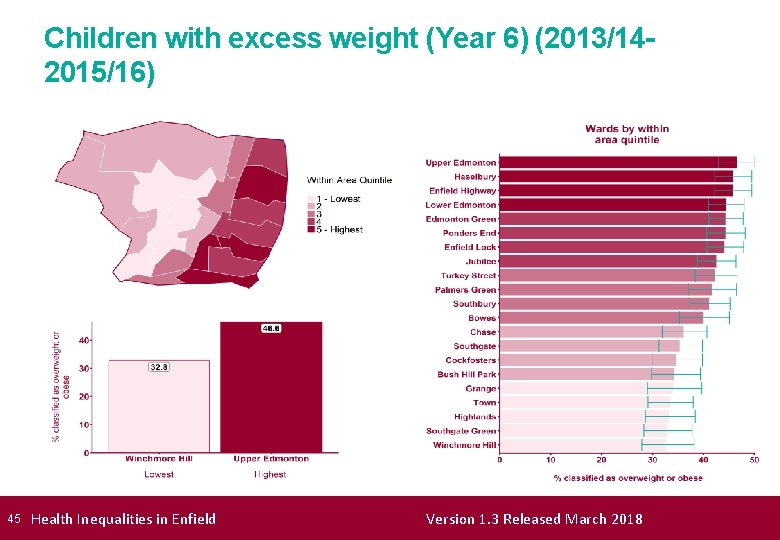
Children with excess weight (Year 6) (2013/142015/16) 45 Health Inequalities in Enfield Version 1. 3 Released March 2018
Feedback We would like to hear your views on the Health Inequalities Briefings If you would like to let us know your thoughts then please complete our short questionnaire, available from: https: //goo. gl/HKZo. Mt 46 Health Inequalities in Enfield Version 1. 3 Released March 2018
All icons Icons made by Freepik, from www. flaticon. com 47 Health Inequalities in Enfield Version 1. 3 Released March 2018
- Slides: 47