Health and welfare models What do we know


")


, 26")


 Women, Model")
 regime type is highly significant?")
 • Relative poverty matters also among rich countries, especially so for children")

 ● Type-case")

 and life expectancy, as averages 1990")


")
- Slides: 28
ØHealth and welfare models: What do we know? Ø Johan Fritzell Professor of Sociology and Social Gerontology Director Aging Research Center (ARC) Karolinska Institutet & Stockholm University Ø johan. Fritzell@ki. se Ø Presentation at the JPI mybl Conference: Health, Ageing and Migration, Rome 161202
• Short intro to the welfare modelling bussiness • Welfare models and population health indicators – Expected and surprising findings • Going beyond ”the black box” of welfare models – Example: , Poverty, Minimum income benefits and mortality • Knowledge and knowledge gaps
Welfare models: the classical welfare regime typology “The three worlds of welfare capitalism” (Esping-Andersen 1990) State Market Family Johan Fritzell
Welfare models: the classical welfare regime typology “The three worlds of welfare capitalism” (Esping-Andersen 1990) State Sweden Market USA Family Germany Johan Fritzell
Population health and welfare state provision • Comparative social epidemiology has almost invariably concluded that population health is enhanced by the relatively generous and universal welfare provision in the Scandinavian countries (Bambra 2011). • Studies analysing the relationship between health (mortality) and the political determinants or policies of welfare states …. report results consistent with welfare regime theory (Brennenstuhl, Quesnel-Vallée, Mc. Donough 2011) • YES, WELFARE STATE PROVISION SEEMS TO BE GOOD FOR POPULATION HEALTH • BUT NOT WITH REGARD TO HEALTH INEQUALITY?
Why do health inequalities persists or even grow in advanced welfare states? The “puzzle” • The Scandinavian welfare states do not, as would generally be expected, have the smallest health inequalities • Bambra, C. (2011) Health inequalities and welfare state regimes: theoretical insights on a public health puzzle, JECH • See also • Mackenbach, J. P. (2012). The persistence of health inequalities in modern welfare states: The explanation of a paradox. Soc Sci & Med, 75, 761 -769. • Dahl, E. ; Fritzell, J. ; Lahelma, E. ; Martikainen, P. ; Kunst, A. ; Mackenbach, J. (2006) Welfare state regimes and health inequalities. In J. Siegrist & M. Marmot (eds. ), Social inequalities in health: New evidence and policy implications. Oxford University Press,
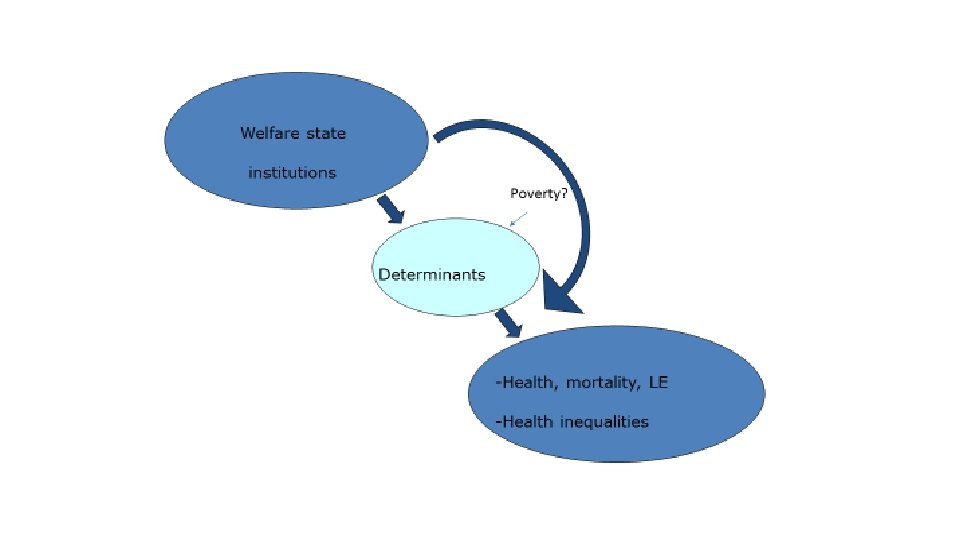
Go beyond the typologies and the countries • Italy is not Sweden……. • Open up the black box of welfare regimes • It is what welfare states actually do, rather than how they are labeled, that matters for health. (e. g. Mackenbach & Mc. Kee 2013)
Health care – Social policy – Welfare states • Health care is - hopefully -of value when you become ill • But ill health is – hopefully – produced outside of the health care system • Social policy is much more than health care • Social policy may influence both determinants of health and the consequences of ill-health • Social determinants of health
Welfare states and poverty reduction We know that welfare state redistribution (taxes and transfers) are of importance for poverty reduction
• So if welfare state programmes are important for poverty reduction and poverty is a social determinant of health than social policy could make a difference. ”The proof of the pudding is in the eating”
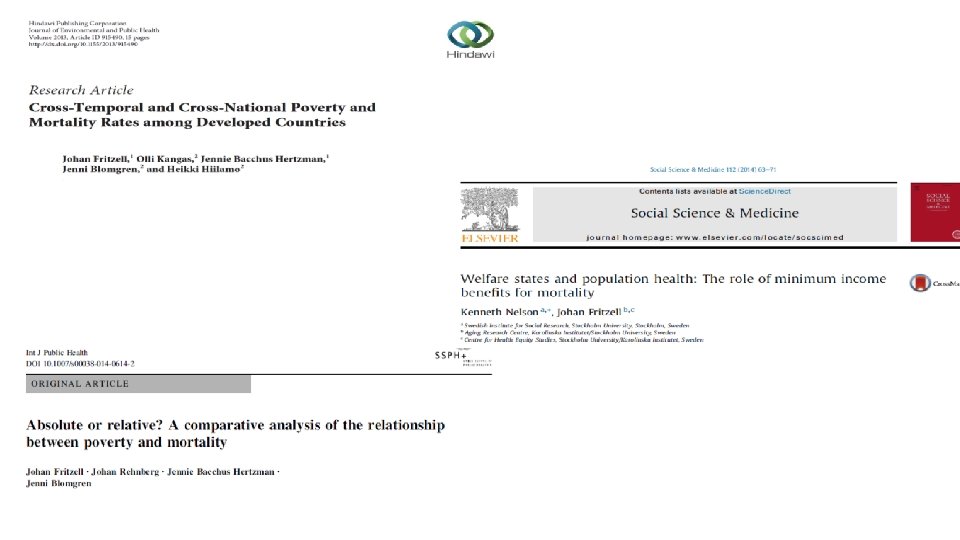
Paper 1: Objectives • To investigate whether cross-national variation in relative poverty rates is associated with cross-national variation in death rates in 26 countries among infants, children and among working-age adults
Data, design and measurements • Data Sources – Poverty (The Luxembourg Income Study(LIS), 26 countries with at least 2 waves of data) www. lisdatacenter. org – Mortality (Human Mortality Database) www. mortality. org – + other databases for control (Penn’s world tables; OECD database) • Design – Poverty measure (LIS): household equivalent disposable income below 40 per cent (sensitivity with 60 %) of the median – Age-standardized mortality rates; average of LIS year and 3 following years (for infant mortality only immediate year) – Age-specific poverty associated with age-specific mortality • Mortality among – Infants, < 1 year – Children, 1 -17 years of age – Adults, 25 -64 years of age
Methods • Pooled cross-sectional time series analysis – Small n-problem – Unbalanced panels -> Panel corrected standard errors • Controls – – Wave of data (time) GDP per capita Social spending Welfare regimes (Nordic countries reference)
Logged age-standardized mortality rates women and men 25 -64 (p-values in parenthesis) Women, Model 2 Poverty, relative (40%) 0, 010 (0, 004) Model 3 0, 017 (0, 004) Men, Model 2 Model 3 0, 013 (0, 082) Model 2 adjusted for data wave and GDP Model 3 adjusted for data wave, GDP, social spending, welfare regime type 0, 0029 (0, 000)
DETOUR Whats the implication of the fact that a) regime type is highly significant? And b) The poverty estimate gets much larger once we adjust for regime? Men (25 -64) Coef. p-values Constant 2, 226 0, 000 Adult poverty (40%) 0, 029 0, 000 Wave -0, 069 0, 000 GDP /1000 US dollars -0, 011 0, 000 Social spending -0, 007 0, 001 Central European -0, 058 0, 070 Liberal -0, 195 0, 001 South-European -0, 256 0, 000 Post-Socialist 0, 397 0, 000 Other -0, 315 0, 003 Welfare regime:
Conclusions (1) • Relative poverty matters also among rich countries, especially so for children • For both children and adults: The poverty effects more marked once welfare regimes are adjusted for.
Welfare states and population health: minimum income benefits and mortality • If poverty matters can social policy make a difference? On the importance of the generosity of minimum income benefits
The Social Assistance and Minimum Income Protection Interim Data Set (Sa. Mip) ● Type-case data based on national (regional) legislation. ● Three type-cases are used: a single person, family (2+2) and a lone parent (1+2). ● Benefit levels are expressed in PPPs adjusted $US. ● Minimum income includes all income received by these household types, excl. employm. income, contributory benefits and transfers between families.
Programs included in the minimum income benefit packages of 18 OECD countries, 2009. Australia SA (Special Benefit), CB (Family tax allowance), HB (Rent assistance) Austria Belgium Canada SA (Bedarfsorientierte mindestsicherung), CB (Familienbeihilfe, Alleinerzieherabsetz-betrag, Kinderabsetzbetrag), HB (Mietbeihilfe) SA (Revenu d'intégration), CB (Allocations familiales belges) SA (Ontario Works), CB (Federal child tax benefit, National child benefit supplement, Back to school allowance, Winter clothing allowances), HB (SA supplements for housing), TC (Ontario sale tax and property tax credits, Federal goods and services tax credit, Ontario child benefit) Denmark Finland France SA (Kontanthjælp), CB (Børnetilskud), HB (Boligsikring) SA (Toimeentulotuki), CB (Lapsilisälaki), HB (Asumistuki) SA (Revenu de solidarité active), CB (Allocations familiales), HB (L'aide personnalisée au logement) Germany Ireland SA (Hilfe zum lebensunterhalt), CB (Kindergeld), HB (Wohngeld) SA (Supplementary welfare allowance), CB (Child benefit, One parent family payment), HB (Rent supplement) Italy Japan SA (Minimo vitale, Reddito minimo), CB (Assegno per nuclei familiari) SA (Public assistance), CB (Child allowance, Lone parent benefit), HB (Housing aid) Netherlands SA (Algemene bijstand), CB (Algemene kinderbijslagwet), HB (Huurtoeslag) New Zealand SA (Jobseeker support), FB (Family tax credit, Domestic Purposes Benefit); HB (Accommodation supplement) Norway Sweden SA (Økonomisk stønad), CB (Barnebidrag), HB (Bostøtte) SA (Försörjningsstöd), CB (Barnbidrag), HB (Bostadsbidrag, SA supplements for housing) Switzerland SA (Aide sociale), CB (Kinderzulage), HB (Social assistance supplements for housing) United Kingdom SA (Income support), CB (Child benefit, Child tax credit), TC (Council tax benefit) United States SA (Foodstamps, Temporary assistance to needy families) SA=social assistance, CB= child benefit, HB= housing benefit, TC=tax credit (TC for children see CB).
Examples of minimum income benefit levels ($US PPP) and life expectancy, as averages 1990 -2009 in four countries • • Switzerland Sweden United Kingdom United States 21 447 15 936 13 043 7 532 83, 1 82, 2 80, 5 79, 7
Age-standardized death rates (18 OECD-countries, 1990 -2009, fixed effects regressions for women and men. Source: Nelson & Fritzell, 2014 (standard errors within parenthesis) • Level of minimum income benefits Crude • Women • Men -21, 86 (3. 13) -42. 38 (6. 83) Adjusted -11. 32 (2. 58) -14. 54 (5. 22) Adjusted for e. g. GDP; alcohol consumption; social expenditure/GDP; % public financing in health expenditure; tobacco consumption; health employment.
Conclusions: minimum income benefits and mortality • Is social protection and anti-poverty programs important for mortality and population health? • According to our analyses the answer is affirmative. • The association between minimum income benefits and mortality is remarkable robust in presence of other estimated effects of other determinants. • Particularly, effects of exposure seem to be short-term rather than long-term.
But what about old age mortality, inequality and welfare state programmes Income gradient in Sweden (Fritzell 2016, report to the Swedish Commission for Equity in Health) Age-standardised death rates 65 -89 years of age
In sum: knowledge and knowledge gaps • We find clear differences in population health indicators by welfare regimes • Welfare state programs seems to be of importance for cross-national variations in mortality • Socioeconomic health inequalities do not necessarily coincides with welfare models • Socioeconomic health inequalities persists in old age • The vast majority of all deaths occur at relatively old age but • Surprisingly little is known about the role of social policy in the explanation of mortality risks in old age • Surprisingly little is known on crossnational variations of health and mortality inequalities in old age.
Ø Johan Fritzell Professor of Sociology and Social Gerontology Director Aging Research Center (ARC) Karolinska Institutet & Stockholm University Ø johan. Fritzell@ki. se