
HBV related cirrhosis Geoff Dusheiko Kings College Hospital
HBV related cirrhosis Geoff Dusheiko Kings College Hospital London UK
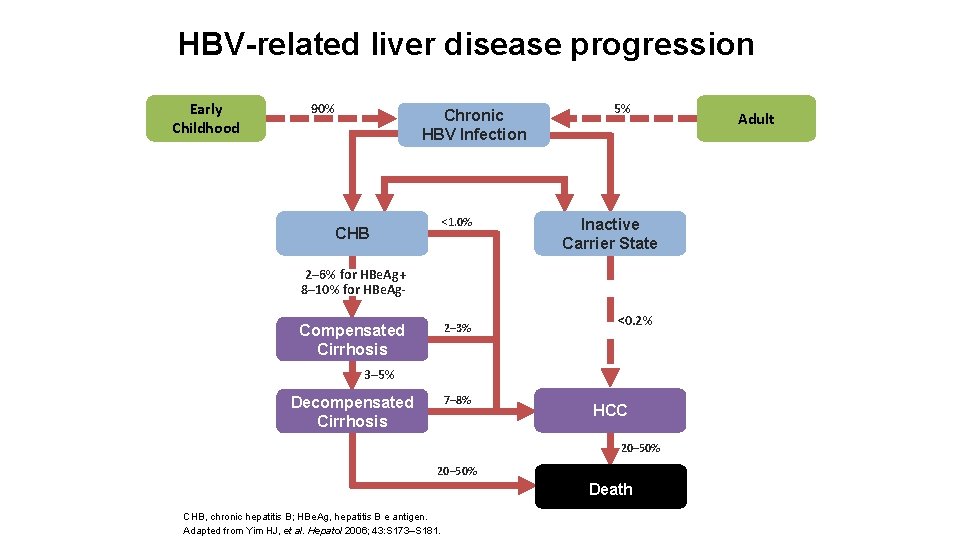
HBV-related liver disease progression Early Childhood 90% Chronic HBV Infection <1. 0% CHB 5% Inactive Carrier State 2– 6% for HBe. Ag+ 8– 10% for HBe. Ag 2– 3% Compensated Cirrhosis <0. 2% 3– 5% 7– 8% Decompensated Cirrhosis HCC 20– 50% Death CHB, chronic hepatitis B; HBe. Ag, hepatitis B e antigen. Adapted from Yim HJ, et al. Hepatol 2006; 43: S 173–S 181. Adult
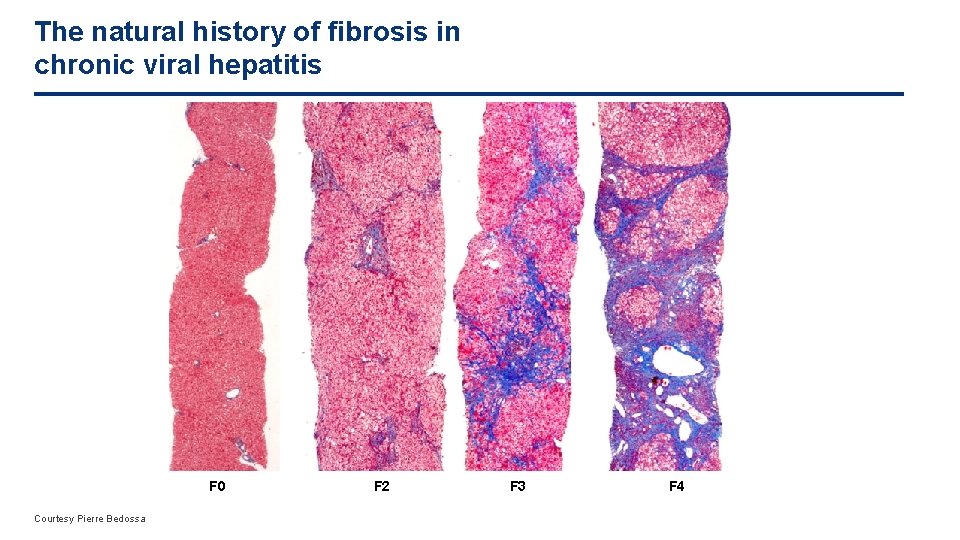
The natural history of fibrosis in chronic viral hepatitis F 0 Courtesy Pierre Bedossa F 2 F 3 F 4
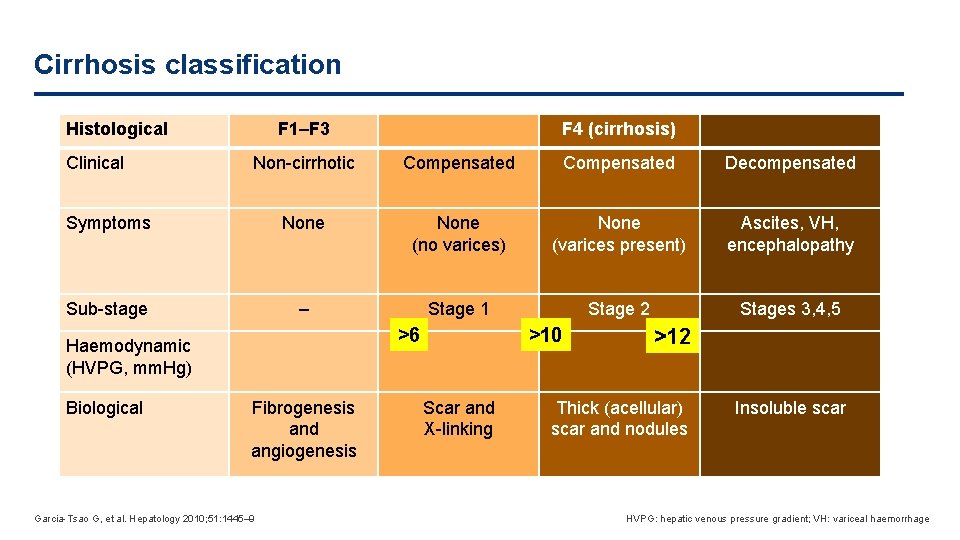
Cirrhosis classification Histological Clinical F 1–F 3 F 4 (cirrhosis) Non-cirrhotic Compensated Decompensated Symptoms None (no varices) None (varices present) Ascites, VH, encephalopathy Sub-stage – Stage 1 Stage 2 Stages 3, 4, 5 >6 Haemodynamic (HVPG, mm. Hg) Biological Fibrogenesis and angiogenesis Garcia-Tsao G, et al. Hepatology 2010; 51: 1445– 9 >10 Scar and X-linking >12 Thick (acellular) scar and nodules Insoluble scar HVPG: hepatic venous pressure gradient; VH: variceal haemorrhage
Diagnosis of cirrhosis § Clinical suspected: – Palpable hepatomegaly or splenomegaly – Spider nevi – Palmar erythema – Finger clubbing – Dupuytrens contracture – Muscle cramps – Foetor hepaticus § Biochemical investigation – Aminotransferase elevation AST > ALT – Gamma glutamyl transferase – Serum albumin concentration alkaline phosphatase – Prothrombin time § Non invasive testing
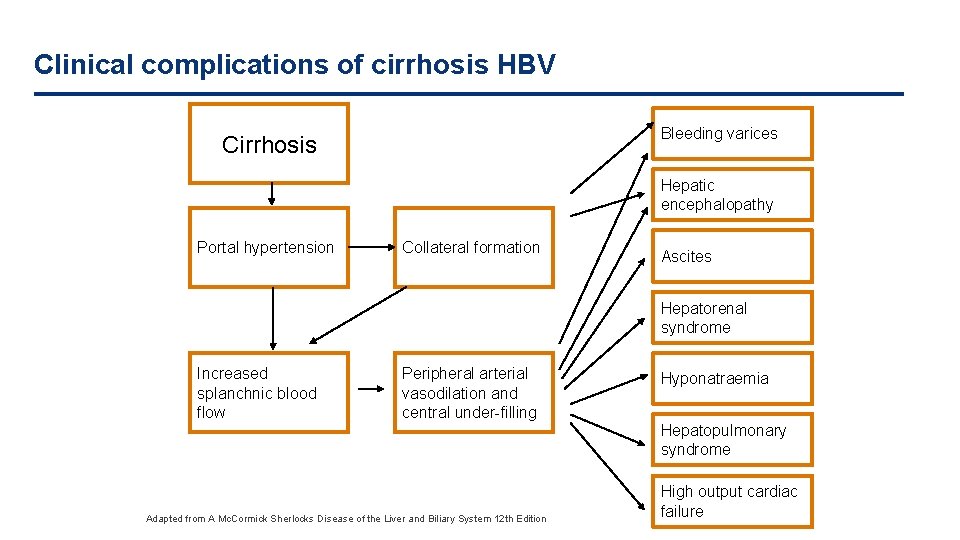
Clinical complications of cirrhosis HBV Bleeding varices Cirrhosis Hepatic encephalopathy Portal hypertension Collateral formation Ascites Hepatorenal syndrome Increased splanchnic blood flow Peripheral arterial vasodilation and central under-filling Hyponatraemia Hepatopulmonary syndrome Adapted from A Mc. Cormick Sherlocks Disease of the Liver and Biliary System 12 th Edition High output cardiac failure
Prognosis § Compensated cirrhosis: – Ten-year probability of – Ascites 47% – Hepatic encephalopathy 28% – gastrointestinal bleeding: 25% – 15% diagnosis ascites die within one year – Oesophageal varices develop in > 1/3 within 3 years of diagnosis – “ominous landmarks” – Annual incidence of hepatocellular carcinoma: 5% – Median survival limited HCC 2 years – Median survival HCC advanced: 6 months
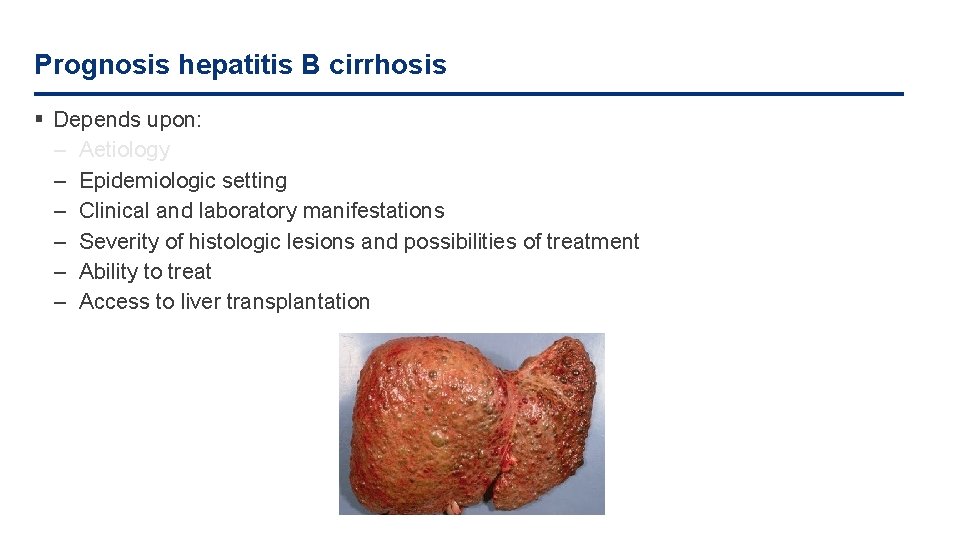
Prognosis hepatitis B cirrhosis § Depends upon: – Aetiology – Epidemiologic setting – Clinical and laboratory manifestations – Severity of histologic lesions and possibilities of treatment – Ability to treat – Access to liver transplantation
Specific treatments: protecting the liver from injury § Anti-viral therapy: – HBV
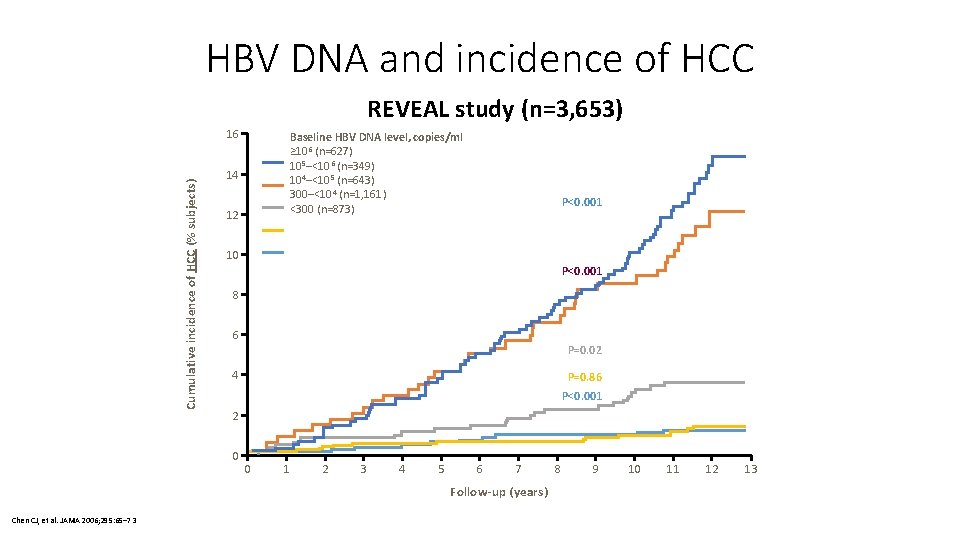
HBV DNA and incidence of HCC REVEAL study (n=3, 653) Cumulative incidence of HCC (% subjects) 16 Baseline HBV DNA level, copies/ml ≥ 106 (n=627) 105–<106 (n=349) 104–<105 (n=643) 300–<104 (n=1, 161) <300 (n=873) 14 12 P<0. 001 10 P<0. 001 8 6 P=0. 02 4 P=0. 86 P<0. 001 2 0 0 1 2 3 4 5 6 7 Follow-up (years) Chen CJ, et al. JAMA 2006; 295: 65– 73 8 9 10 11 12 13
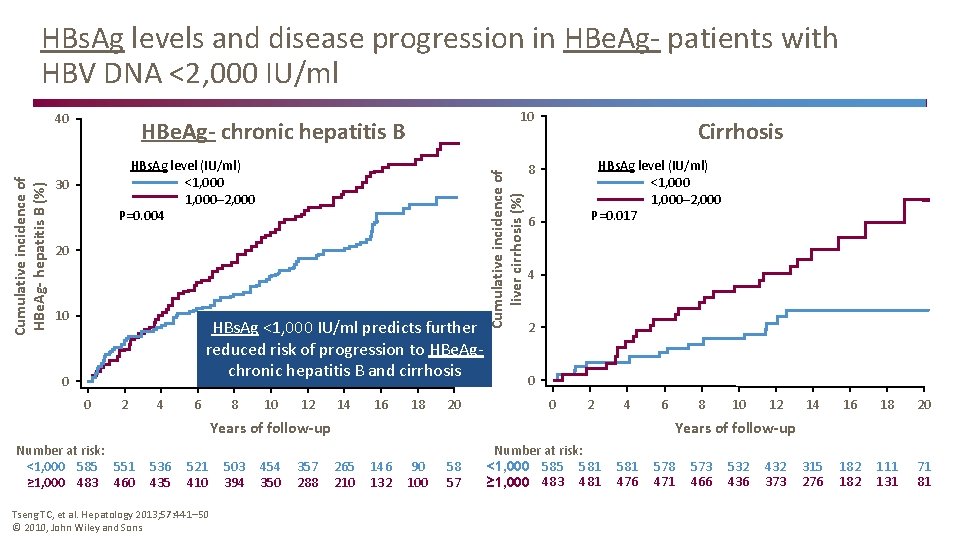
HBs. Ag levels and disease progression in HBe. Ag- patients with HBV DNA <2, 000 IU/ml 10 HBe. Ag- chronic hepatitis B HBs. Ag level (IU/ml) <1, 000– 2, 000 P=0. 004 30 Cumulative incidence of liver cirrhosis (%) Cumulative incidence of HBe. Ag- hepatitis B (%) 40 20 10 HBs. Ag <1, 000 IU/ml predicts further reduced risk of progression to HBe. Ag- chronic hepatitis B and cirrhosis 0 0 2 4 6 8 10 12 14 16 18 20 Cirrhosis HBs. Ag level (IU/ml) <1, 000– 2, 000 P=0. 017 8 6 4 2 0 0 2 4 Years of follow-up Number at risk: <1, 000 585 551 ≥ 1, 000 483 460 536 435 521 410 Tseng TC, et al. Hepatology 2013; 57: 441 50 © 2010, John Wiley and Sons 503 394 454 350 357 288 6 8 10 12 14 16 18 20 315 276 182 111 131 71 81 Years of follow-up 265 210 146 132 90 100 58 57 Number at risk: <1, 000 585 581 ≥ 1, 000 483 481 581 476 578 471 573 466 532 436 432 373
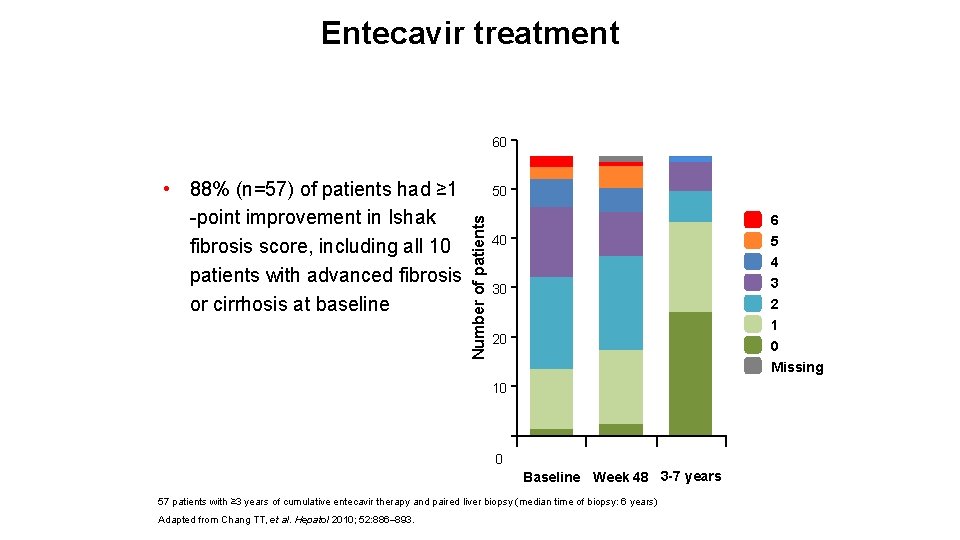
Entecavir treatment 60 50 Number of patients • 88% (n=57) of patients had ≥ 1 -point improvement in Ishak fibrosis score, including all 10 patients with advanced fibrosis or cirrhosis at baseline 6 40 5 4 30 3 2 1 0 Missing 20 10 0 Baseline Week 48 3 -7 years 57 patients with ≥ 3 years of cumulative entecavir therapy and paired liver biopsy (median time of biopsy: 6 years) Adapted from Chang TT, et al. Hepatol 2010; 52: 886– 893.
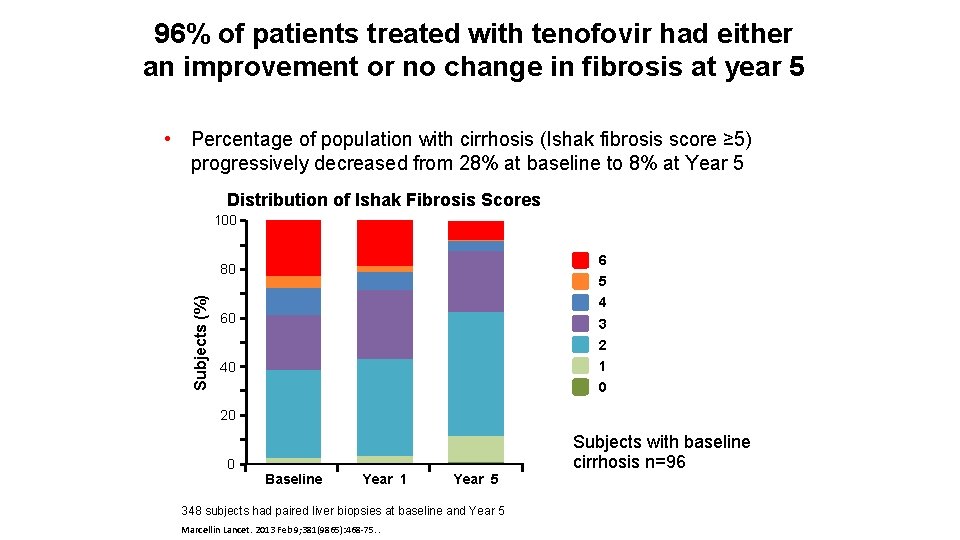
96% of patients treated with tenofovir had either an improvement or no change in fibrosis at year 5 • Percentage of population with cirrhosis (Ishak fibrosis score ≥ 5) progressively decreased from 28% at baseline to 8% at Year 5 Distribution of Ishak Fibrosis Scores 100 6 Subjects (%) 80 5 4 60 3 2 1 0 40 20 0 Baseline Year 1 Year 5 348 subjects had paired liver biopsies at baseline and Year 5 Marcellin Lancet. 2013 Feb 9; 381(9865): 468 -75. . Subjects with baseline cirrhosis n=96
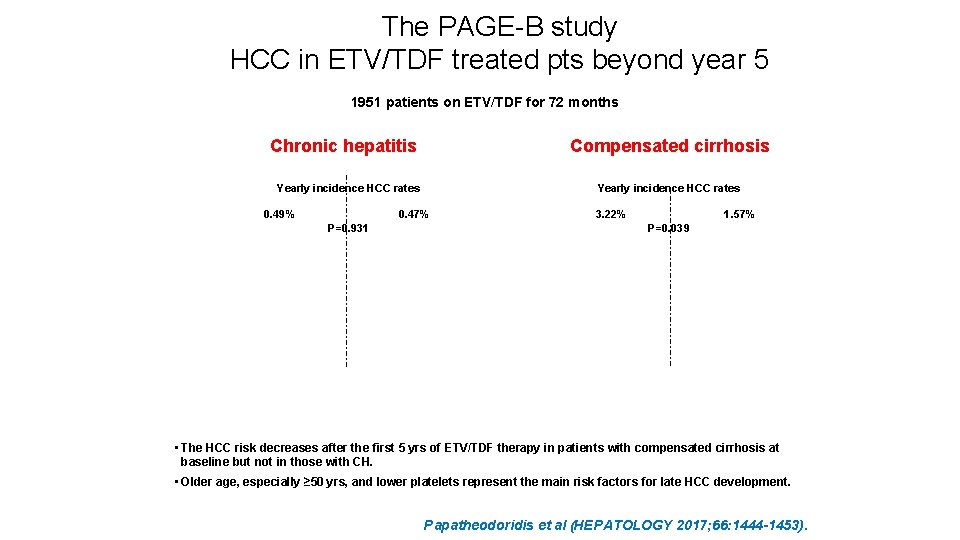
The PAGE-B study HCC in ETV/TDF treated pts beyond year 5 1951 patients on ETV/TDF for 72 months Chronic hepatitis Compensated cirrhosis Yearly incidence HCC rates 0. 49% Yearly incidence HCC rates 0. 47% P=0. 931 3. 22% 1. 57% P=0. 039 • The HCC risk decreases after the first 5 yrs of ETV/TDF therapy in patients with compensated cirrhosis at baseline but not in those with CH. • Older age, especially ≥ 50 yrs, and lower platelets represent the main risk factors for late HCC development. Papatheodoridis et al (HEPATOLOGY 2017; 66: 1444 -1453).
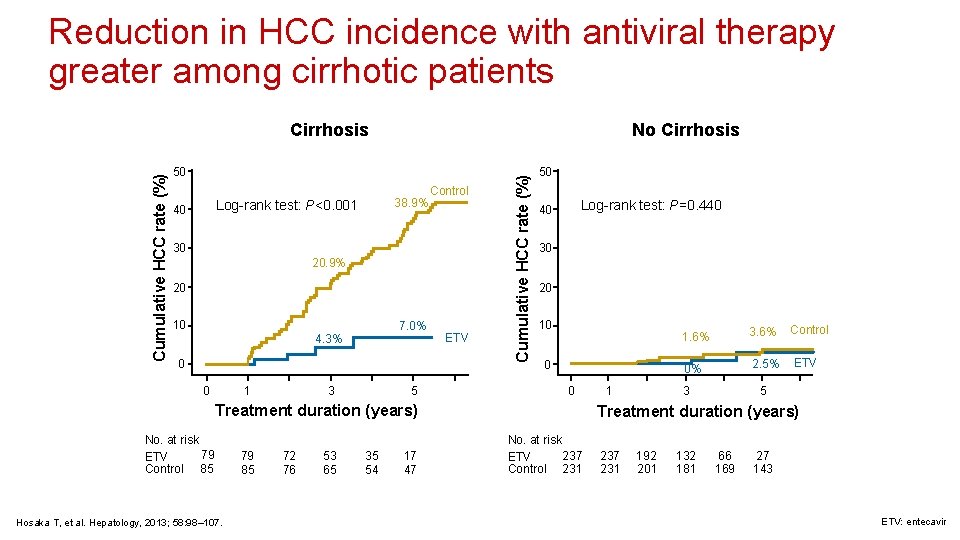
Reduction in HCC incidence with antiviral therapy greater among cirrhotic patients No Cirrhosis 50 38. 9% Log-rank test: P<0. 001 40 Control 30 20. 9% 20 10 7. 0% 4. 3% 0 0 1 3 5 ETV Cumulative HCC rate (%) Cirrhosis 50 Log-rank test: P=0. 440 40 30 20 10 0 0 Treatment duration (years) No. at risk 79 ETV Control 85 Hosaka T, et al. Hepatology, 2013; 58: 98– 107. 79 85 72 76 53 65 35 54 17 47 1 1. 6% 3. 6% 0% 2. 5% 3 Control ETV 5 Treatment duration (years) No. at risk 237 ETV Control 231 237 231 192 201 132 181 66 169 27 143 ETV: entecavir
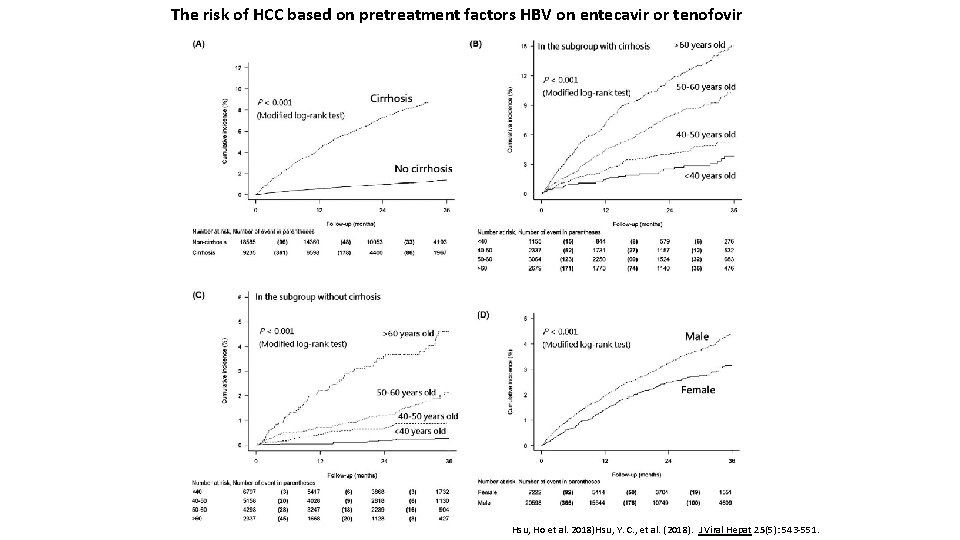
The risk of HCC based on pretreatment factors HBV on entecavir or tenofovir Hsu, Ho et al. 2018)Hsu, Y. C. , et al. (2018). J Viral Hepat 25(5): 543 -551.
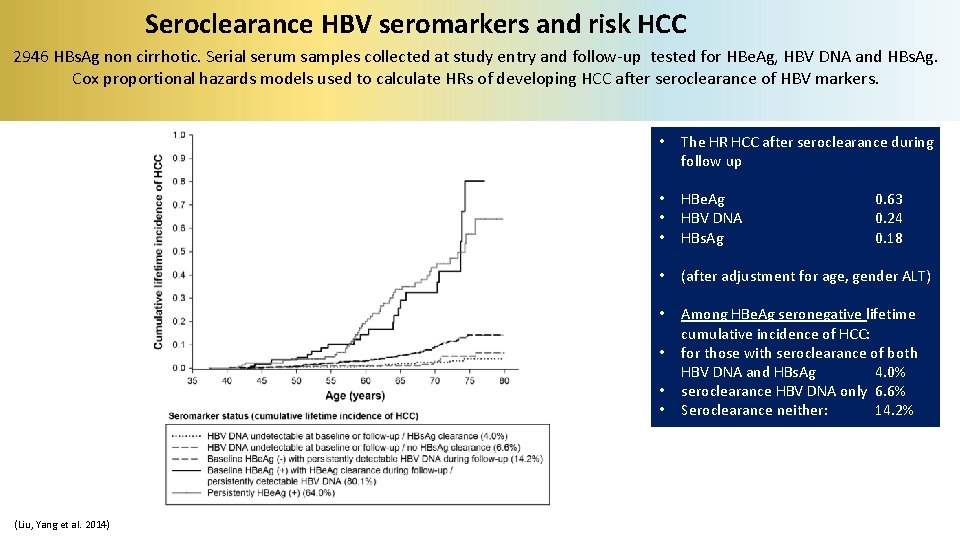
Seroclearance HBV seromarkers and risk HCC 2946 HBs. Ag non cirrhotic. Serial serum samples collected at study entry and follow-up tested for HBe. Ag, HBV DNA and HBs. Ag. Cox proportional hazards models used to calculate HRs of developing HCC after seroclearance of HBV markers. • The HR HCC after seroclearance during follow up • • • HBe. Ag HBV DNA HBs. Ag • (after adjustment for age, gender ALT) • Among HBe. Ag seronegative lifetime cumulative incidence of HCC: for those with seroclearance of both HBV DNA and HBs. Ag 4. 0% seroclearance HBV DNA only 6. 6% Seroclearance neither: 14. 2% • • • (Liu, Yang et al. 2014) 0. 63 0. 24 0. 18
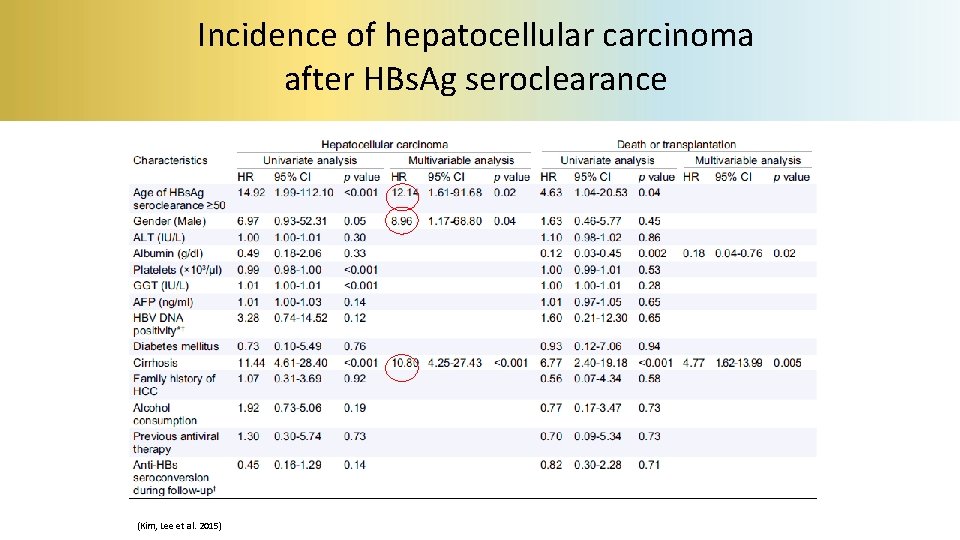
Incidence of hepatocellular carcinoma after HBs. Ag seroclearance (Kim, Lee et al. 2015)
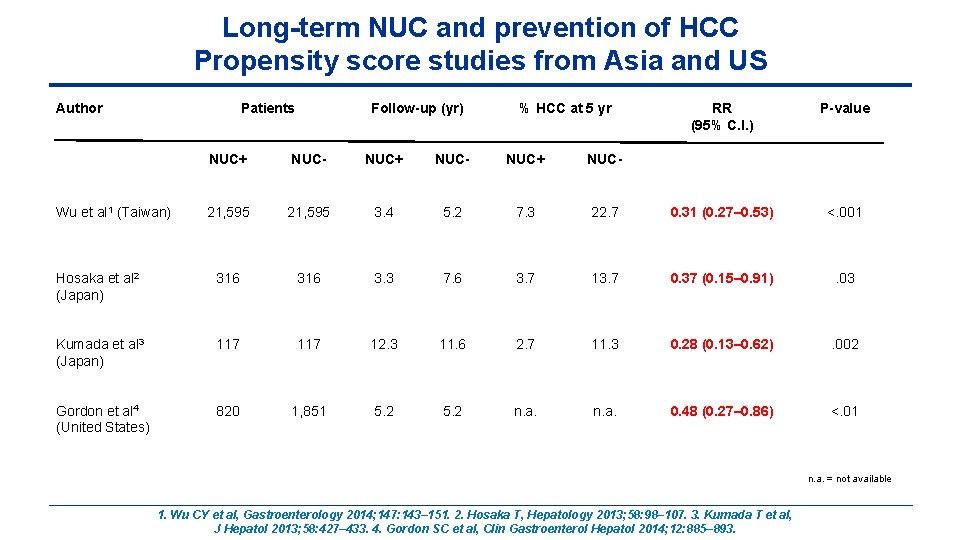
Long-term NUC and prevention of HCC Propensity score studies from Asia and US Author Patients Follow-up (yr) % HCC at 5 yr RR (95% C. I. ) P-value NUC+ NUC- 21, 595 3. 4 5. 2 7. 3 22. 7 0. 31 (0. 27– 0. 53) <. 001 Hosaka et al 2 (Japan) 316 3. 3 7. 6 3. 7 13. 7 0. 37 (0. 15– 0. 91) . 03 Kumada et al 3 (Japan) 117 12. 3 11. 6 2. 7 11. 3 0. 28 (0. 13– 0. 62) . 002 Gordon et al 4 (United States) 820 1, 851 5. 2 n. a. 0. 48 (0. 27– 0. 86) <. 01 Wu et al 1 (Taiwan) n. a. = not available 1. Wu CY et al, Gastroenterology 2014; 147: 143– 151. 2. Hosaka T, Hepatology 2013; 58: 98– 107. 3. Kumada T et al, J Hepatol 2013; 58: 427– 433. 4. Gordon SC et al, Clin Gastroenterol Hepatol 2014; 12: 885– 893.
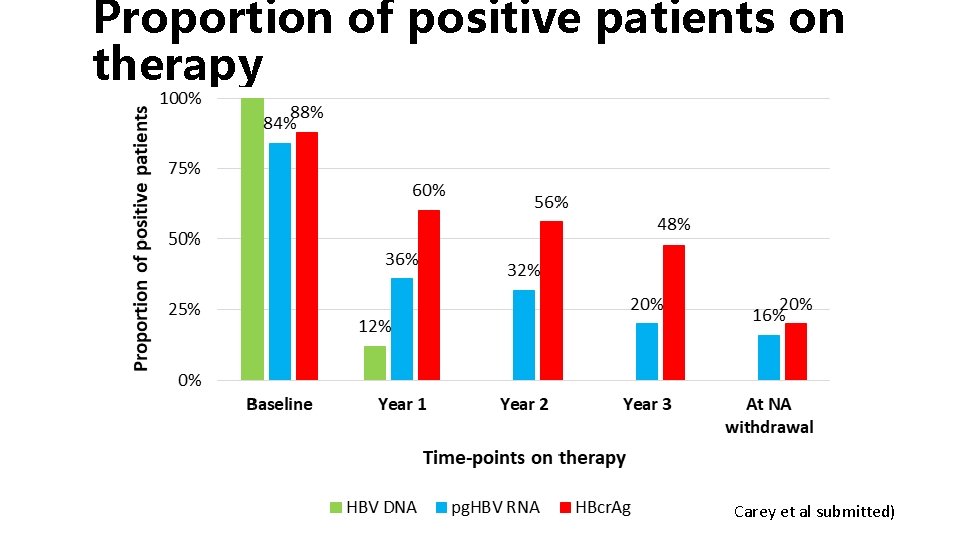
Proportion of positive patients on therapy Carey et al submitted)
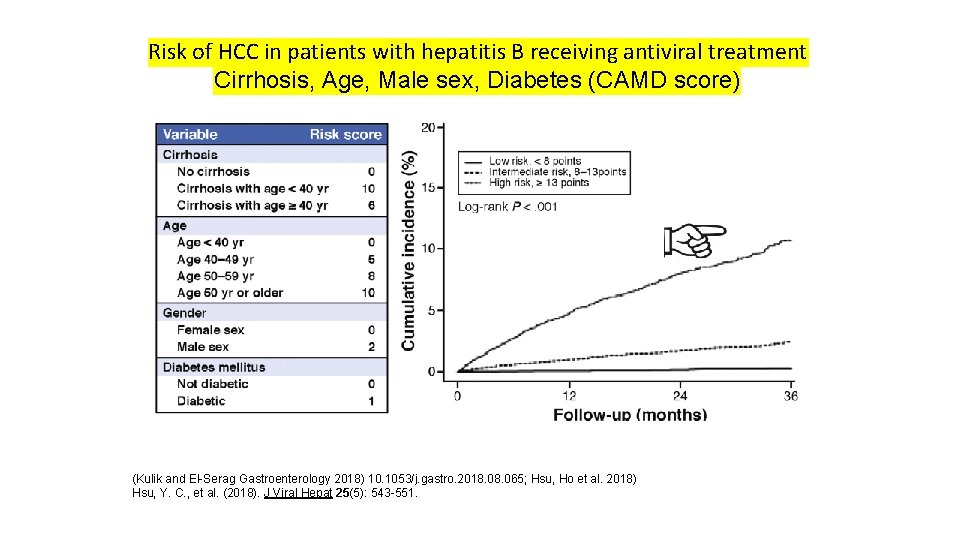
Risk of HCC in patients with hepatitis B receiving antiviral treatment Cirrhosis, Age, Male sex, Diabetes (CAMD score) (Kulik and El-Serag Gastroenterology 2018) 10. 1053/j. gastro. 2018. 065; Hsu, Ho et al. 2018) Hsu, Y. C. , et al. (2018). J Viral Hepat 25(5): 543 -551.
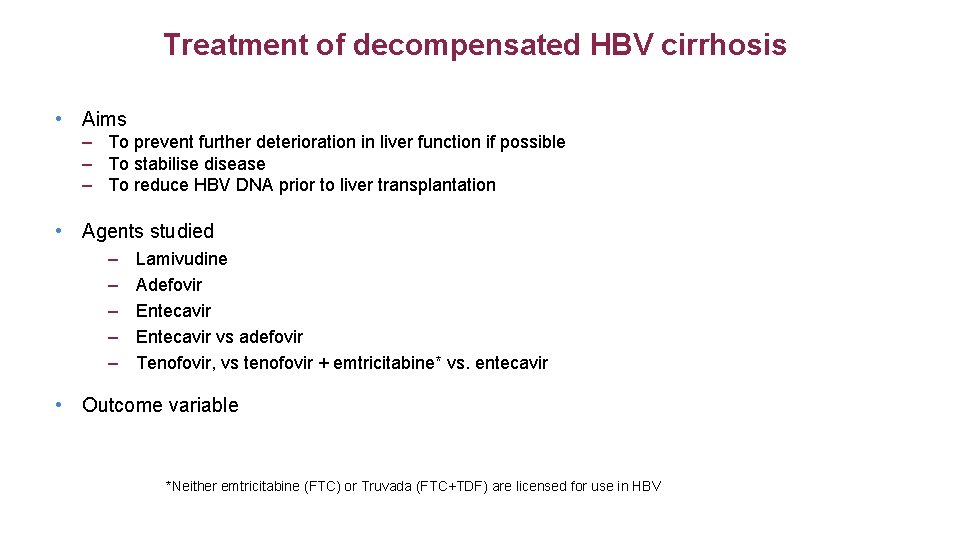
Treatment of decompensated HBV cirrhosis • Aims – To prevent further deterioration in liver function if possible – To stabilise disease – To reduce HBV DNA prior to liver transplantation • Agents studied – – – Lamivudine Adefovir Entecavir vs adefovir Tenofovir, vs tenofovir + emtricitabine* vs. entecavir • Outcome variable *Neither emtricitabine (FTC) or Truvada (FTC+TDF) are licensed for use in HBV
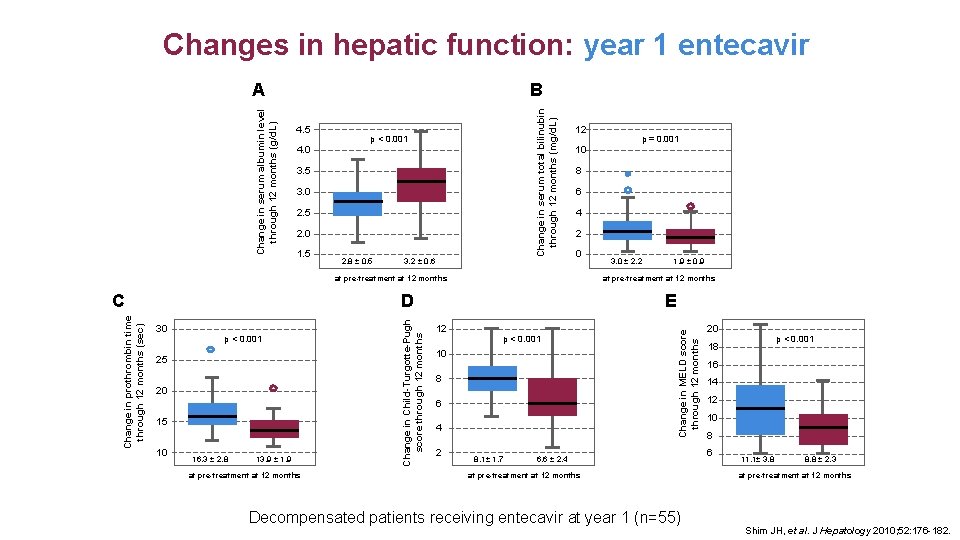
Changes in hepatic function: year 1 entecavir B p < 0. 001 4. 0 3. 5 3. 0 2. 5 2. 0 1. 5 2. 8 0. 5 3. 2 0. 6 12 8 6 4 2 0 at pre-treatment at 12 months p < 0. 001 25 20 15 10 16. 3 2. 8 13. 9 1. 9 at pre-treatment at 12 months Change in Child-Turgotte-Pugh score through 12 months Change in prothrombin time through 12 months (sec) 30 3. 0 2. 2 1. 9 0. 9 at pre-treatment at 12 months D C p = 0. 001 10 E 12 p < 0. 001 10 8 6 4 2 8. 1 1. 7 Change in MELD score through 12 months 4. 5 Change in serum total bilinubin through 12 months (mg/d. L) Change in serum albumin level through 12 months (g/d. L) A 6. 6 2. 4 at pre-treatment at 12 months Decompensated patients receiving entecavir at year 1 (n=55) 20 p < 0. 001 18 16 14 12 10 8 6 11. 1 3. 8 8. 8 2. 3 at pre-treatment at 12 months Shim JH, et al. J Hepatology 2010; 52: 176 -182.
Conclusions and unanswered questions § Complications of end-stage liver disease have a significant economic impact § Complications can be treated with varying degrees of palliation § Patients with cirrhosis (hepatitis B) may show histological improvement in fibrosis scores with long-term nucleos(t)ide therapy or clinical improvement – But how is improvement best quantified? – Is functional status or measurement of portal hypertension a better surrogate of survival? § Effect on HCC risk via antiviral therapy? § Better to treat to prevent cirrhosis
- Slides: 24