
Hazelwood School District Demographic Redistricting Study Mapping Update




- Slides: 45
Hazelwood School District Demographic Redistricting Study Mapping Update Board of Education Meeting February 19, 2019
OVERVIEW • Redistricting Priorities • Data Review • Redistricting Options • Birth Data for Pre-K Planning • Path Forward 12/1/2020 FOR DISCUSSION PURPOSES ONLY 2
REDISTRICTING PRIORITIES • Considerations • • No changes to high school boundaries Middle school changes only within same high school boundaries Redraw boundaries to achieve student enrollment balances Attempt to include existing elementary feeder areas and limit student movement • Take into account existing transportation networks and improve transportation efficiency • Eliminate non-contiguous elementary attendance areas (islands) • Develop 2 plans • Option 1: Limited student movement • Option 2: More changes to improve spatial proximity and optimize transportation 12/1/2020 FOR DISCUSSION PURPOSES ONLY 3
DATA REVIEW • Using 2018 September 30 Enrollments Geocoded to District Planning Areas • All Counts Based on Student Residence • All Boundary Modifications Based on Counts of Students Residing in Planning Areas • Total 2018 Records — 17, 150 • In-District record count — 16, 751 • Total K-12 record count — 16, 164 • Manually matched without X, Y coordinates, special program and Pre-K students not included — 986 • Planning Area Delineation • 27 unique attendance areas • Combinations of elementary and middle school areas • 306 planning areas with boundaries consistent with current attendance areas 12/1/2020 FOR DISCUSSION PURPOSES ONLY 4
MAPPING WORKING GROUP • Director of Transportation • Director of Security • Assistant Superintendent • Director of Data and Assessment • Director of Federal Programs • Chief Financial Officer 12/1/2020 FOR DISCUSSION PURPOSES ONLY 5
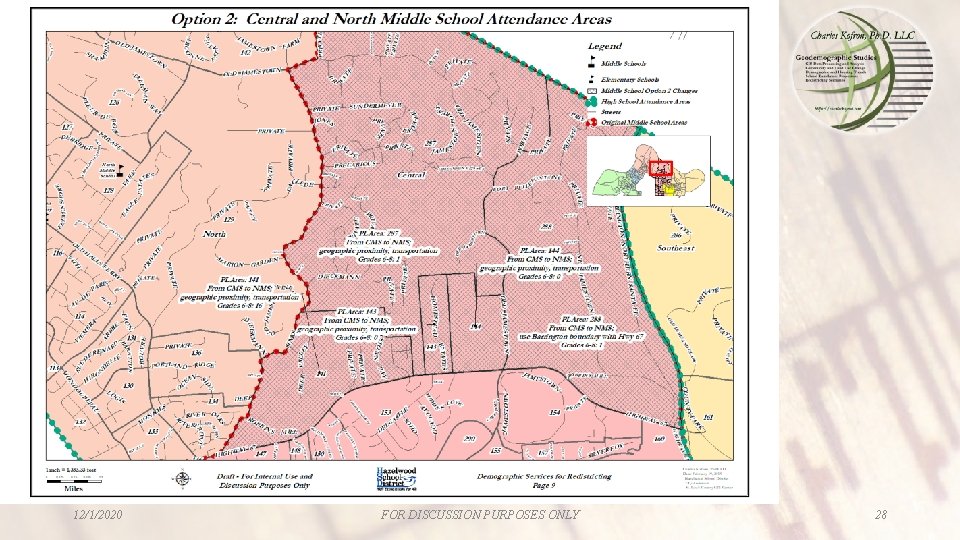
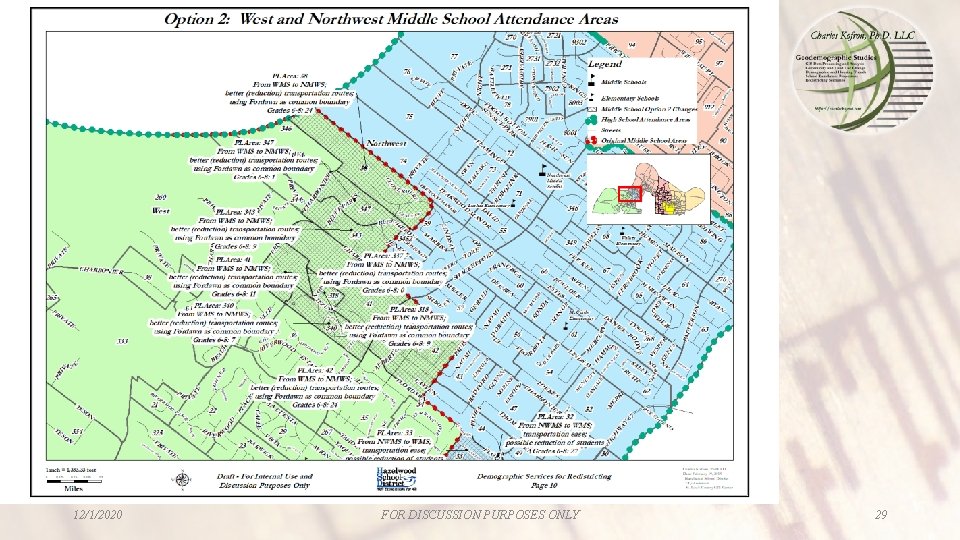
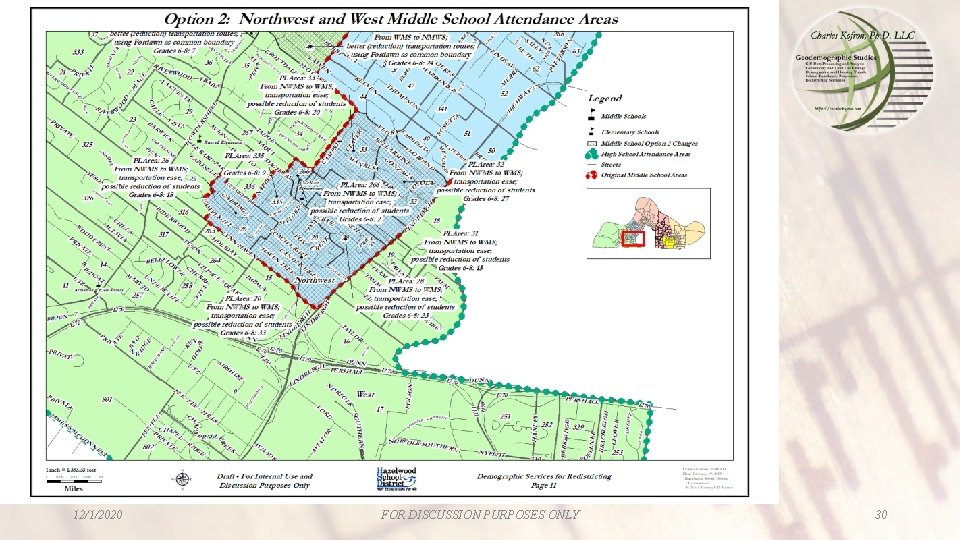
REDISTRICTING OPTIONS • Option 1 • • Very limited student movement Eliminate non-contiguous (“island”) areas Minimal improvements to bus routing efficiency Students Affected • Elementary— 138 • Middle School— 342 • Option 2 • • • 12/1/2020 Changes based on spatial proximity to school buildings Optimize transportation routes Balance enrollments More comprehensive alignment of elementary feeder areas to middle school areas Students Affected • Elementary— 353 • Middle School— 362 FOR DISCUSSION PURPOSES ONLY 6
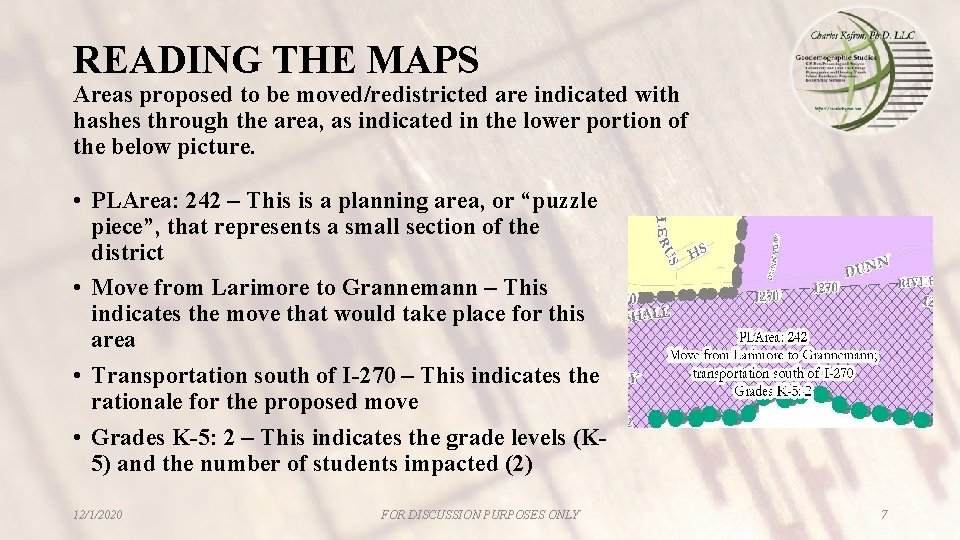
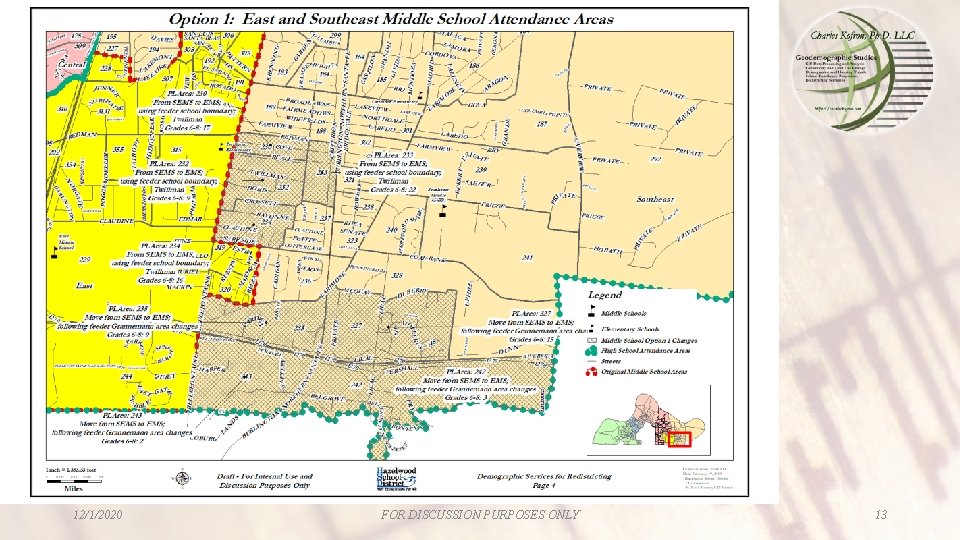
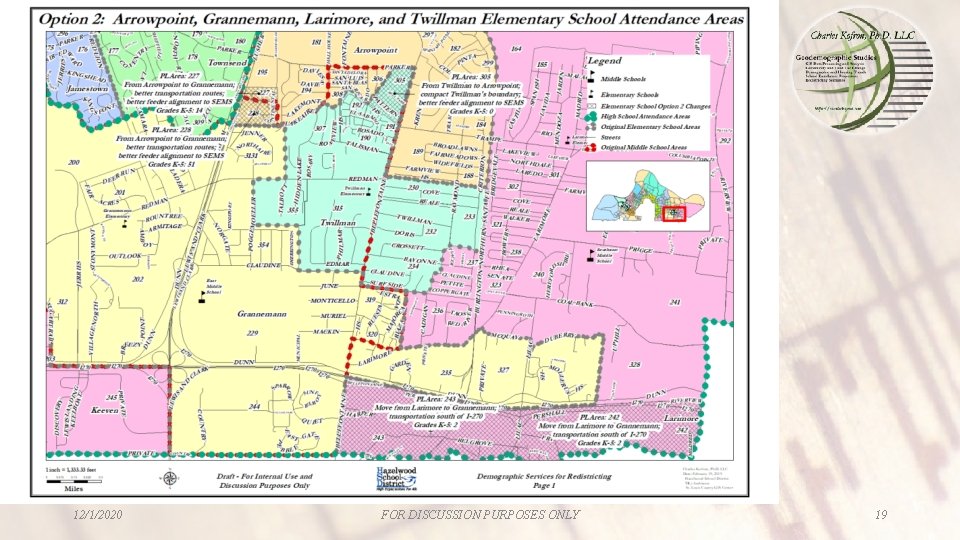
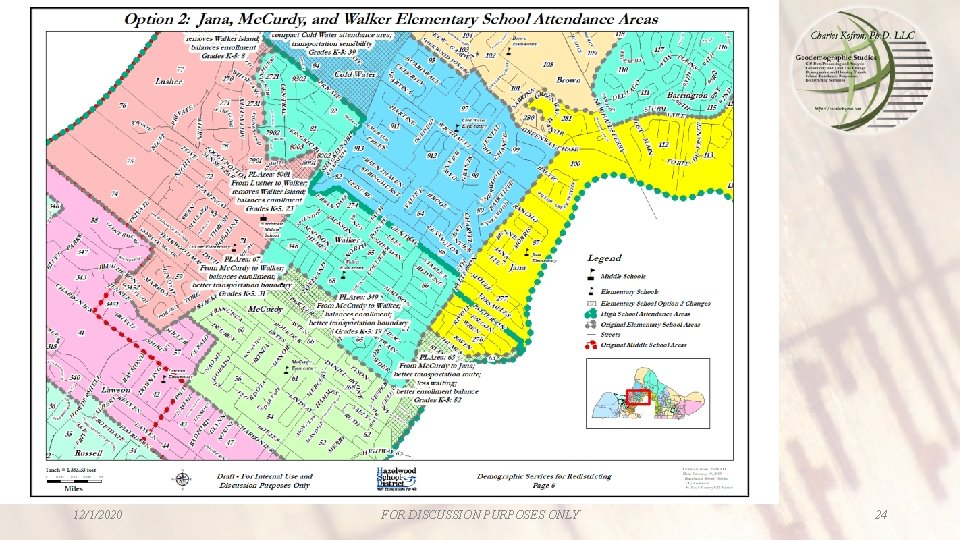
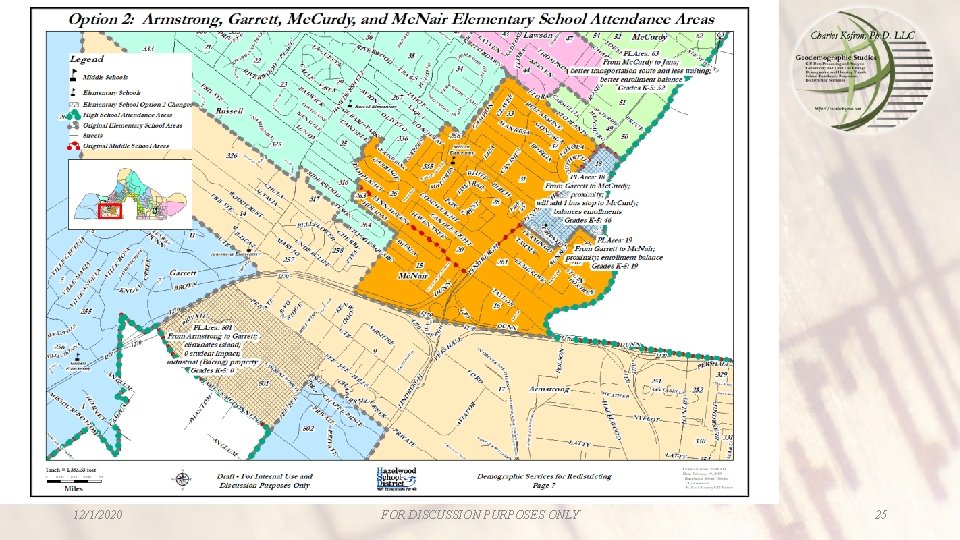
READING THE MAPS Areas proposed to be moved/redistricted are indicated with hashes through the area, as indicated in the lower portion of the below picture. • PLArea: 242 – This is a planning area, or “puzzle piece”, that represents a small section of the district • Move from Larimore to Grannemann – This indicates the move that would take place for this area • Transportation south of I-270 – This indicates the rationale for the proposed move • Grades K-5: 2 – This indicates the grade levels (K 5) and the number of students impacted (2) 12/1/2020 FOR DISCUSSION PURPOSES ONLY 7
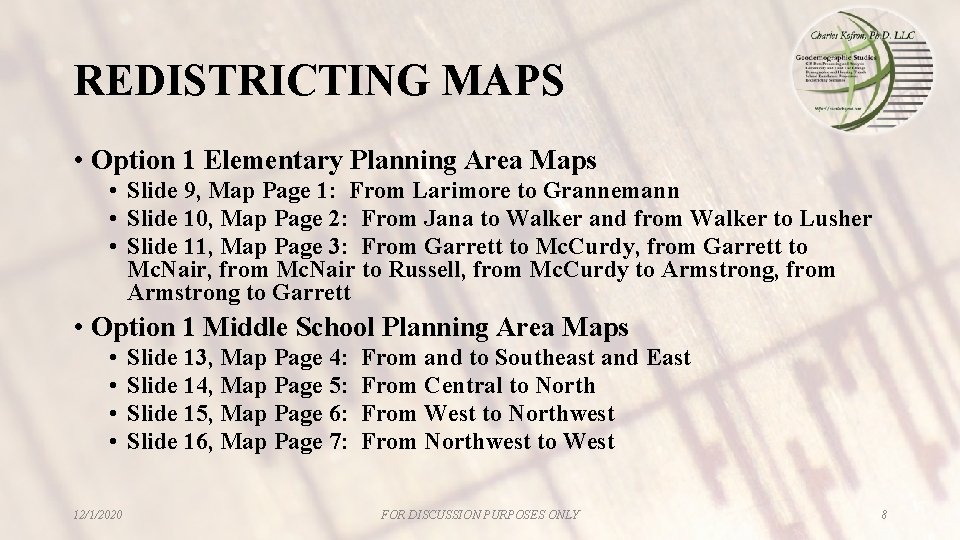
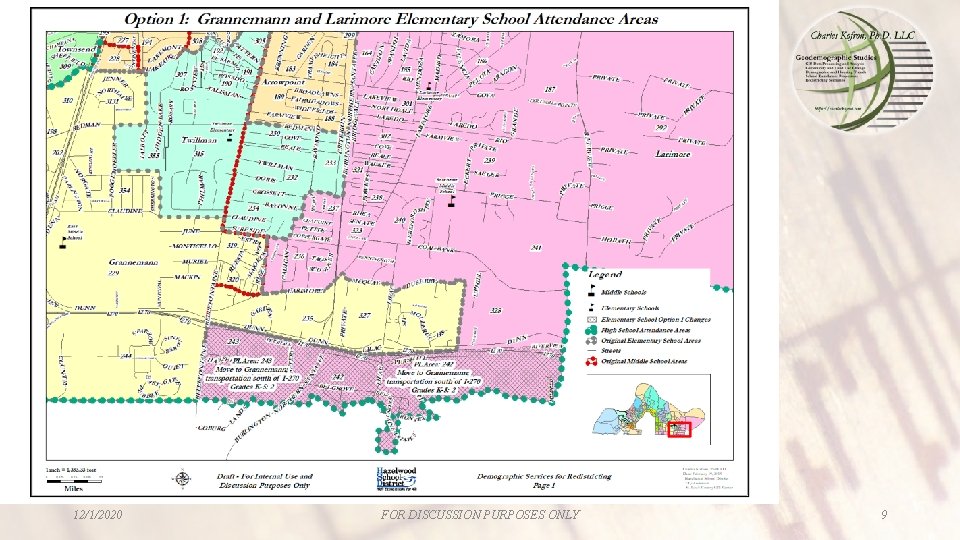
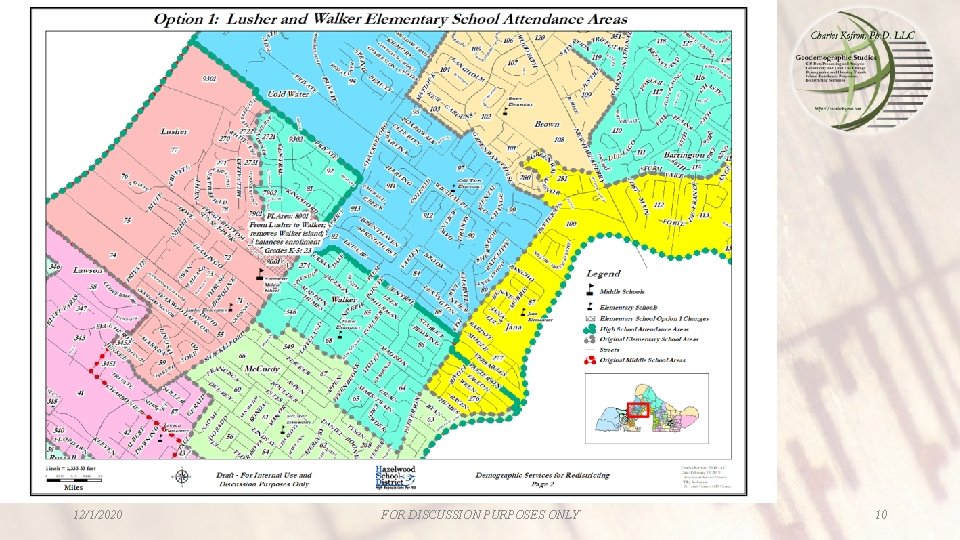
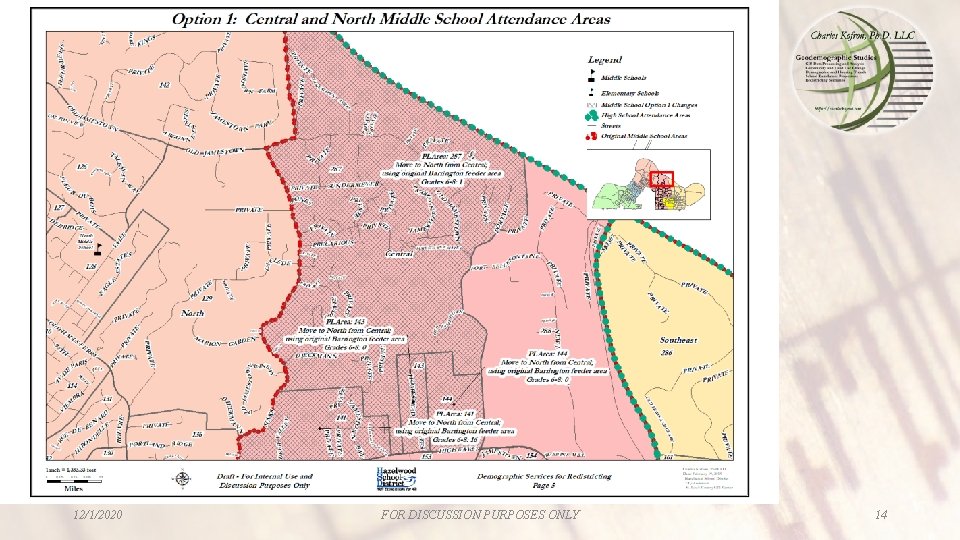
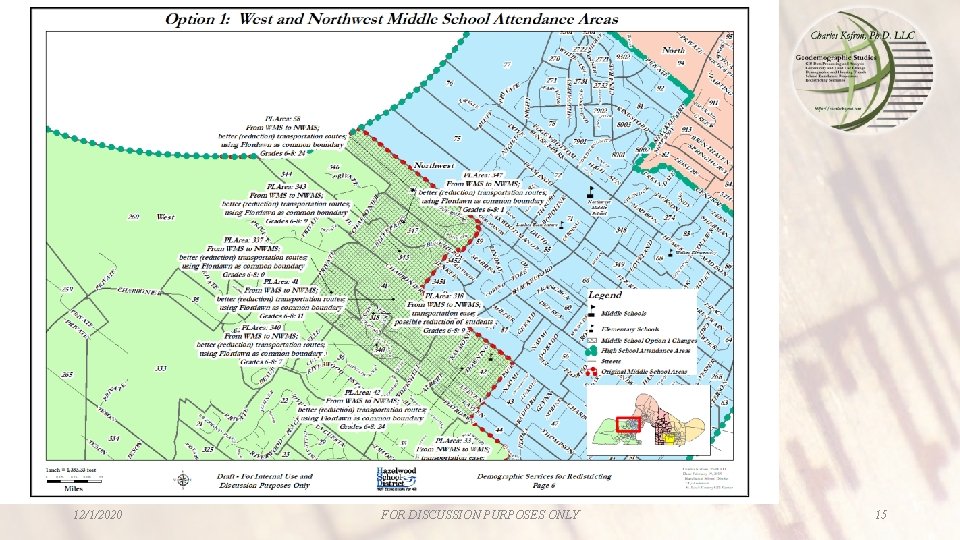
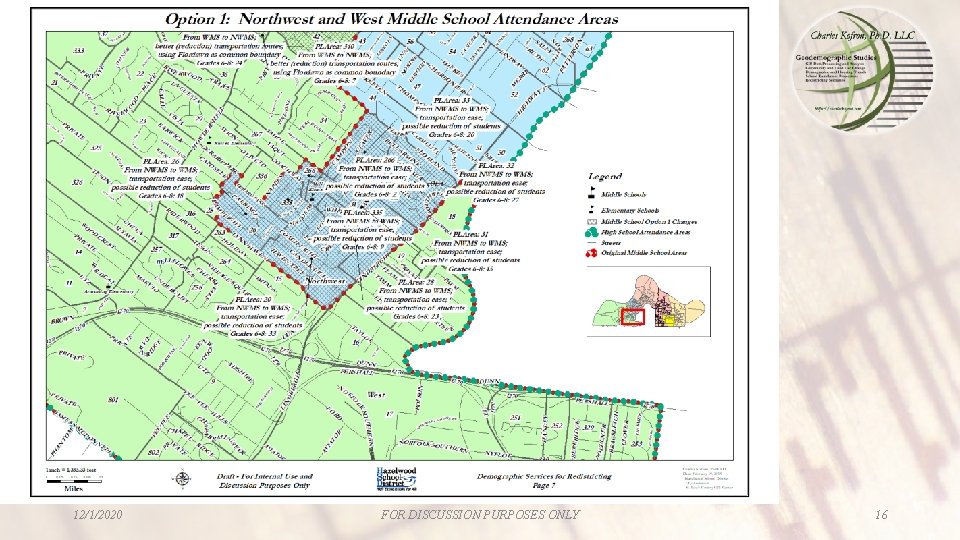
REDISTRICTING MAPS • Option 1 Elementary Planning Area Maps • Slide 9, Map Page 1: From Larimore to Grannemann • Slide 10, Map Page 2: From Jana to Walker and from Walker to Lusher • Slide 11, Map Page 3: From Garrett to Mc. Curdy, from Garrett to Mc. Nair, from Mc. Nair to Russell, from Mc. Curdy to Armstrong, from Armstrong to Garrett • Option 1 Middle School Planning Area Maps • • 12/1/2020 Slide 13, Map Page 4: Slide 14, Map Page 5: Slide 15, Map Page 6: Slide 16, Map Page 7: From and to Southeast and East From Central to North From West to Northwest From Northwest to West FOR DISCUSSION PURPOSES ONLY 8
12/1/2020 FOR DISCUSSION PURPOSES ONLY 9
12/1/2020 FOR DISCUSSION PURPOSES ONLY 10
12/1/2020 FOR DISCUSSION PURPOSES ONLY 11
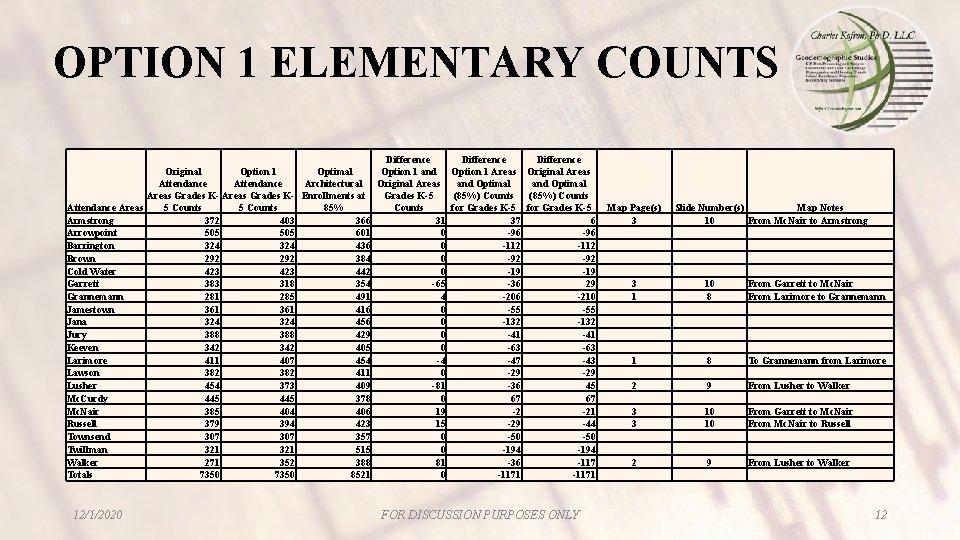
OPTION 1 ELEMENTARY COUNTS Difference Original Option 1 Optimal Option 1 and Option 1 Areas Original Areas Attendance Architectural Original Areas and Optimal Areas Grades K- Enrollments at Grades K-5 (85%) Counts Attendance Areas 5 Counts 85% Counts for Grades K-5 Armstrong 372 403 366 31 37 6 Arrowpoint 505 601 0 -96 Barrington 324 436 0 -112 Brown 292 384 0 -92 Cold Water 423 442 0 -19 Garrett 383 318 354 -65 -36 29 Grannemann 281 285 491 4 -206 -210 Jamestown 361 416 0 -55 Jana 324 456 0 -132 Jury 388 429 0 -41 Keeven 342 405 0 -63 Larimore 411 407 454 -4 -47 -43 Lawson 382 411 0 -29 Lusher 454 373 409 -81 -36 45 Mc. Curdy 445 378 0 67 67 Mc. Nair 385 404 406 19 -2 -21 Russell 379 394 423 15 -29 -44 Townsend 307 357 0 -50 Twillman 321 515 0 -194 Walker 271 352 388 81 -36 -117 Totals 7350 8521 0 -1171 12/1/2020 FOR DISCUSSION PURPOSES ONLY Map Page(s) 3 Slide Number(s) Map Notes 10 From Mc. Nair to Armstrong 3 1 10 8 From Garrett to Mc. Nair From Larimore to Grannemann 1 8 To Grannemann from Larimore 2 9 From Lusher to Walker 3 3 10 10 From Garrett to Mc. Nair From Mc. Nair to Russell 2 9 From Lusher to Walker 12
12/1/2020 FOR DISCUSSION PURPOSES ONLY 13
12/1/2020 FOR DISCUSSION PURPOSES ONLY 14
12/1/2020 FOR DISCUSSION PURPOSES ONLY 15
12/1/2020 FOR DISCUSSION PURPOSES ONLY 16
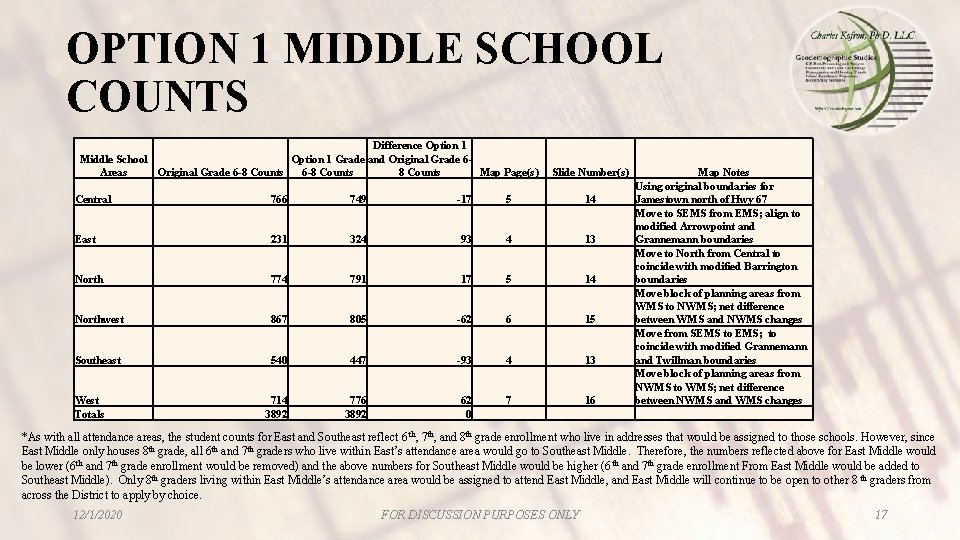
OPTION 1 MIDDLE SCHOOL COUNTS Difference Option 1 Middle School Option 1 Grade and Original Grade 6 Areas Original Grade 6 -8 Counts Map Page(s) Slide Number(s) Central 766 749 -17 5 14 East 231 324 93 4 13 North 774 791 17 5 14 Northwest 867 805 -62 6 15 Southeast 540 447 -93 4 13 714 3892 776 3892 62 0 7 16 West Totals Map Notes Using original boundaries for Jamestown north of Hwy 67 Move to SEMS from EMS; align to modified Arrowpoint and Grannemann boundaries Move to North from Central to coincide with modified Barrington boundaries Move block of planning areas from WMS to NWMS; net difference between WMS and NWMS changes Move from SEMS to EMS; to coincide with modified Grannemann and Twillman boundaries Move block of planning areas from NWMS to WMS; net difference between NWMS and WMS changes *As with all attendance areas, the student counts for East and Southeast reflect 6 th, 7 th, and 8 th grade enrollment who live in addresses that would be assigned to those schools. However, since East Middle only houses 8 th grade, all 6 th and 7 th graders who live within East’s attendance area would go to Southeast Middle. Therefore, the numbers reflected above for East Middle would be lower (6 th and 7 th grade enrollment would be removed) and the above numbers for Southeast Middle would be higher (6 th and 7 th grade enrollment From East Middle would be added to Southeast Middle). Only 8 th graders living within East Middle’s attendance area would be assigned to attend East Middle, and East Middle will continue to be open to other 8 th graders from across the District to apply by choice. 12/1/2020 FOR DISCUSSION PURPOSES ONLY 17
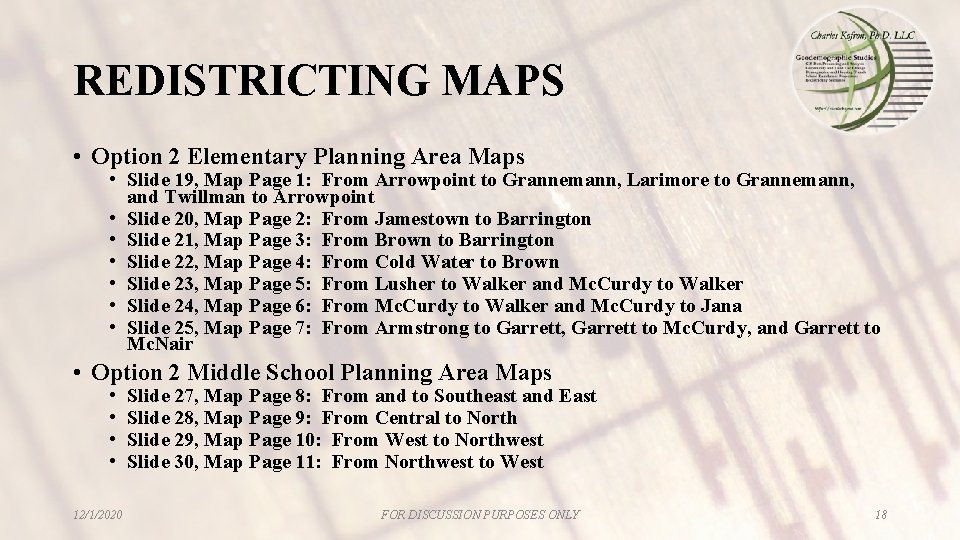
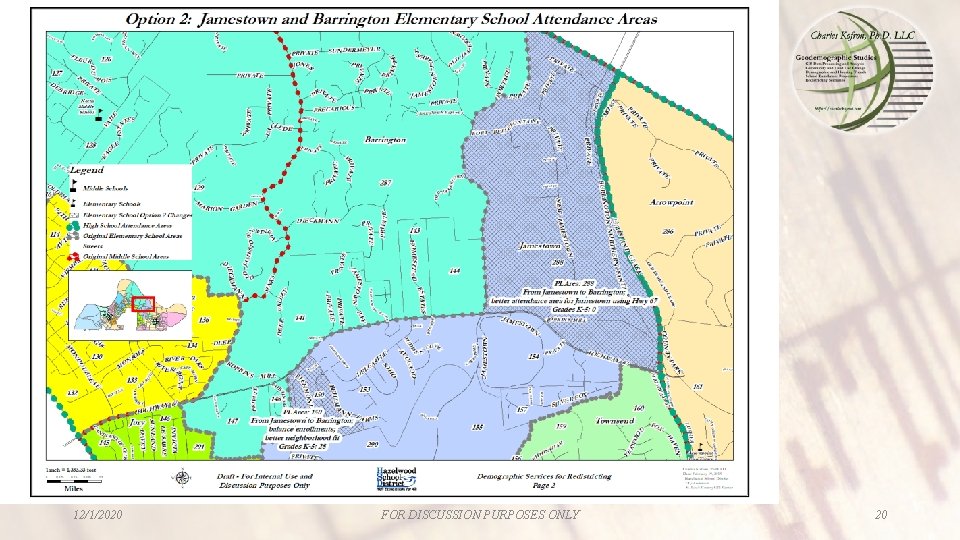
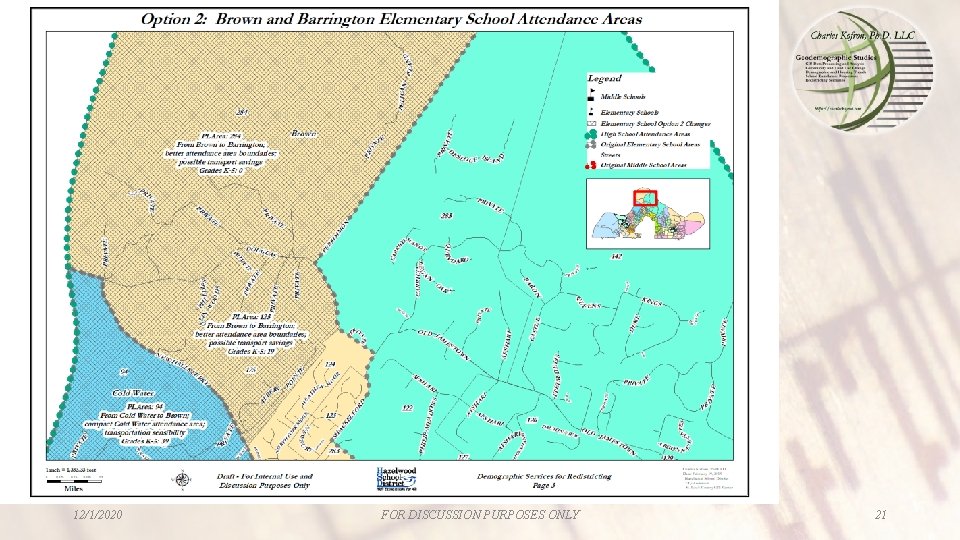
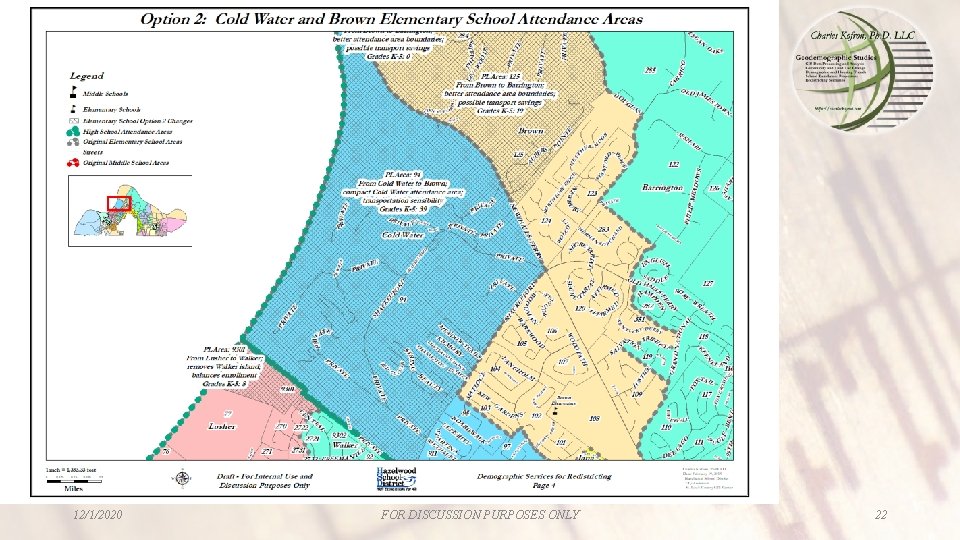
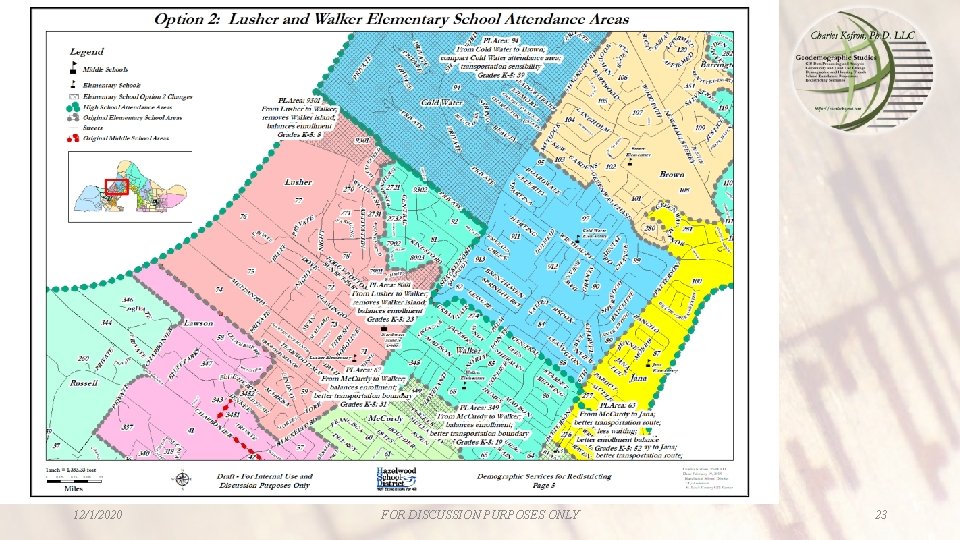
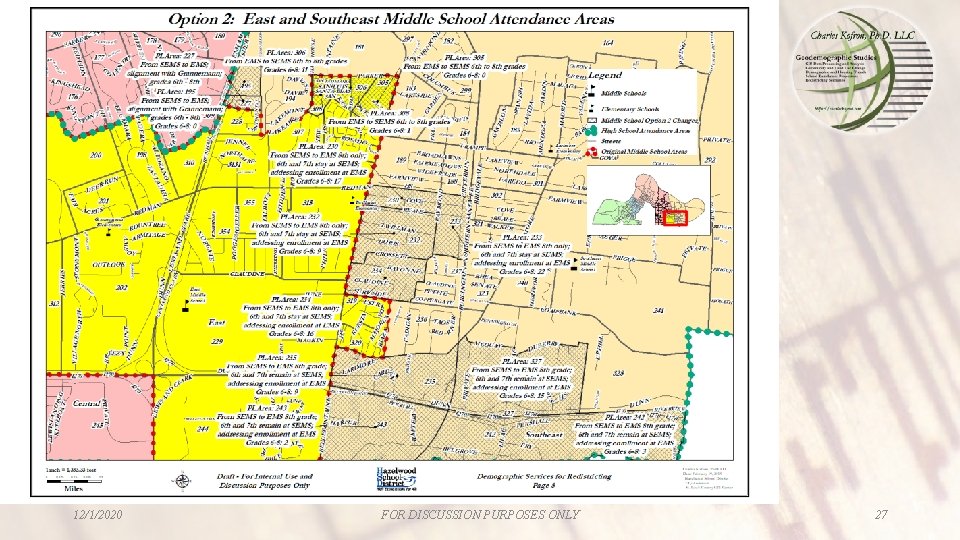
REDISTRICTING MAPS • Option 2 Elementary Planning Area Maps • Slide 19, Map Page 1: From Arrowpoint to Grannemann, Larimore to Grannemann, and Twillman to Arrowpoint • Slide 20, Map Page 2: From Jamestown to Barrington • Slide 21, Map Page 3: From Brown to Barrington • Slide 22, Map Page 4: From Cold Water to Brown • Slide 23, Map Page 5: From Lusher to Walker and Mc. Curdy to Walker • Slide 24, Map Page 6: From Mc. Curdy to Walker and Mc. Curdy to Jana • Slide 25, Map Page 7: From Armstrong to Garrett, Garrett to Mc. Curdy, and Garrett to Mc. Nair • Option 2 Middle School Planning Area Maps • • 12/1/2020 Slide 27, Map Page 8: From and to Southeast and East Slide 28, Map Page 9: From Central to North Slide 29, Map Page 10: From West to Northwest Slide 30, Map Page 11: From Northwest to West FOR DISCUSSION PURPOSES ONLY 18
12/1/2020 FOR DISCUSSION PURPOSES ONLY 19
12/1/2020 FOR DISCUSSION PURPOSES ONLY 20
12/1/2020 FOR DISCUSSION PURPOSES ONLY 21
12/1/2020 FOR DISCUSSION PURPOSES ONLY 22
12/1/2020 FOR DISCUSSION PURPOSES ONLY 23
12/1/2020 FOR DISCUSSION PURPOSES ONLY 24
12/1/2020 FOR DISCUSSION PURPOSES ONLY 25
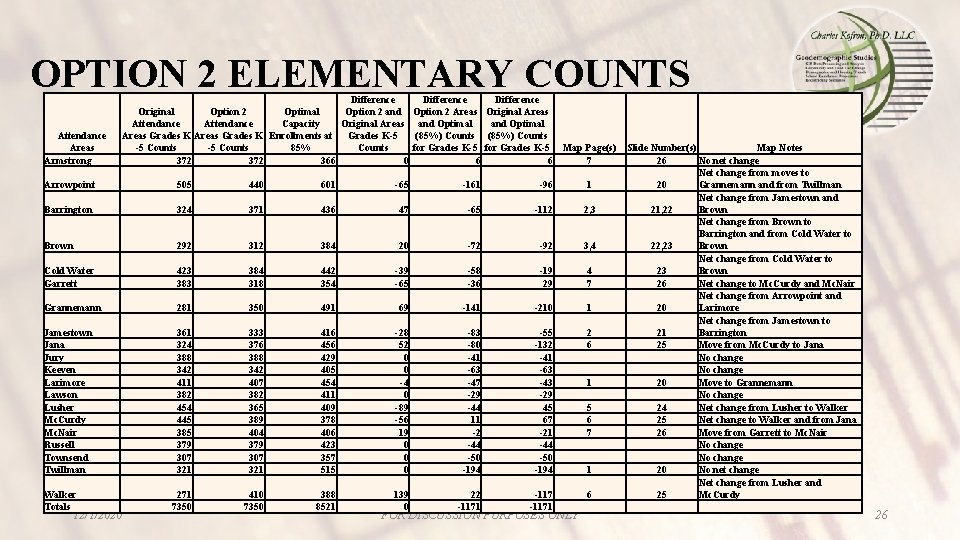
OPTION 2 ELEMENTARY COUNTS Attendance Areas Armstrong Difference Original Option 2 Optimal Option 2 and Option 2 Areas Attendance Capacity Original Areas and Optimal Areas Grades K Enrollments at Grades K-5 (85%) Counts -5 Counts 85% Counts for Grades K-5 372 366 0 6 Difference Original Areas and Optimal (85%) Counts for Grades K-5 Map Page(s) 6 7 Arrowpoint 505 440 601 -65 -161 -96 1 Barrington 324 371 436 47 -65 -112 2, 3 Brown 292 312 384 20 -72 -92 3, 4 Cold Water Garrett 423 384 318 442 354 -39 -65 -58 -36 -19 29 4 7 Grannemann 281 350 491 69 -141 -210 1 Jamestown Jana Jury Keeven Larimore Lawson Lusher Mc. Curdy Mc. Nair Russell Townsend Twillman 361 324 388 342 411 382 454 445 385 379 307 321 333 376 388 342 407 382 365 389 404 379 307 321 416 456 429 405 454 411 409 378 406 423 357 515 -28 52 0 0 -4 0 -89 -56 19 0 0 0 -83 -80 -41 -63 -47 -29 -44 11 -2 -44 -50 -194 -55 -132 -41 -63 -43 -29 45 67 -21 -44 -50 -194 2 6 271 7350 410 7350 388 8521 139 0 22 -1171 6 Walker Totals 12/1/2020 FOR DISCUSSION PURPOSES ONLY 1 5 6 7 1 Slide Number(s) Map Notes 26 No net change Net change from moves to 20 Grannemann and from Twillman Net change from Jamestown and 21, 22 Brown Net change from Brown to Barrington and from Cold Water to 22, 23 Brown Net change from Cold Water to 23 Brown 26 Net change to Mc. Curdy and Mc. Nair Net change from Arrowpoint and 20 Larimore Net change from Jamestown to 21 Barrington 25 Move from Mc. Curdy to Jana No change 20 Move to Grannemann No change 24 Net change from Lusher to Walker 25 Net change to Walker and from Jana 26 Move from Garrett to Mc. Nair No change 20 No net change Net change from Lusher and 25 Mc. Curdy 26
12/1/2020 FOR DISCUSSION PURPOSES ONLY 27
12/1/2020 FOR DISCUSSION PURPOSES ONLY 28
12/1/2020 FOR DISCUSSION PURPOSES ONLY 29
12/1/2020 FOR DISCUSSION PURPOSES ONLY 30
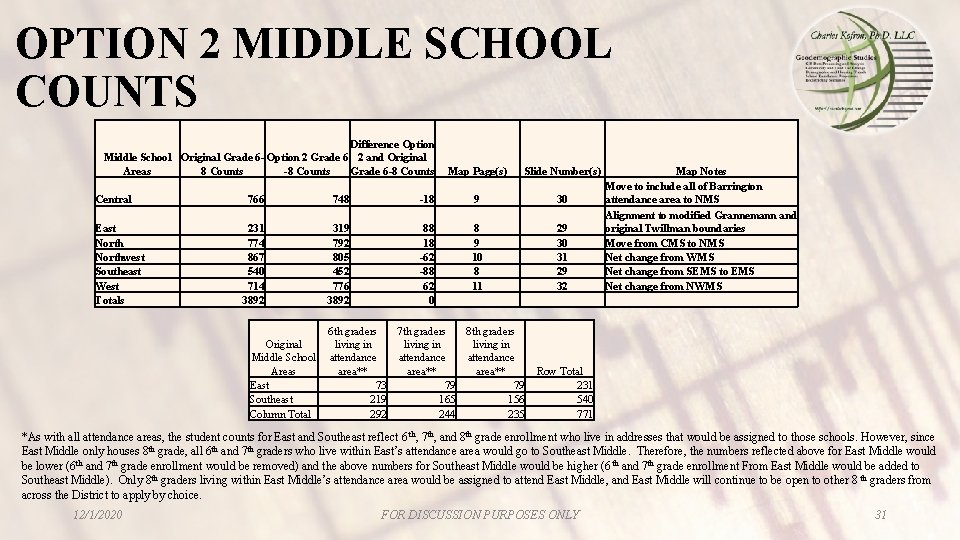
OPTION 2 MIDDLE SCHOOL COUNTS Difference Option Middle School Original Grade 6 - Option 2 Grade 6 2 and Original Areas 8 Counts -8 Counts Grade 6 -8 Counts Central East Northwest Southeast West Totals Map Page(s) Slide Number(s) 766 748 -18 9 30 231 774 867 540 714 3892 319 792 805 452 776 3892 88 18 -62 -88 62 0 8 9 10 8 11 29 30 31 29 32 Original Middle School Areas East Southeast Column Total 6 th graders 7 th graders 8 th graders living in attendance area** 73 79 79 219 165 156 292 244 235 Map Notes Move to include all of Barrington attendance area to NMS Alignment to modified Grannemann and original Twillman boundaries Move from CMS to NMS Net change from WMS Net change from SEMS to EMS Net change from NWMS Row Total 231 540 771 *As with all attendance areas, the student counts for East and Southeast reflect 6 th, 7 th, and 8 th grade enrollment who live in addresses that would be assigned to those schools. However, since East Middle only houses 8 th grade, all 6 th and 7 th graders who live within East’s attendance area would go to Southeast Middle. Therefore, the numbers reflected above for East Middle would be lower (6 th and 7 th grade enrollment would be removed) and the above numbers for Southeast Middle would be higher (6 th and 7 th grade enrollment From East Middle would be added to Southeast Middle). Only 8 th graders living within East Middle’s attendance area would be assigned to attend East Middle, and East Middle will continue to be open to other 8 th graders from across the District to apply by choice. 12/1/2020 FOR DISCUSSION PURPOSES ONLY 31
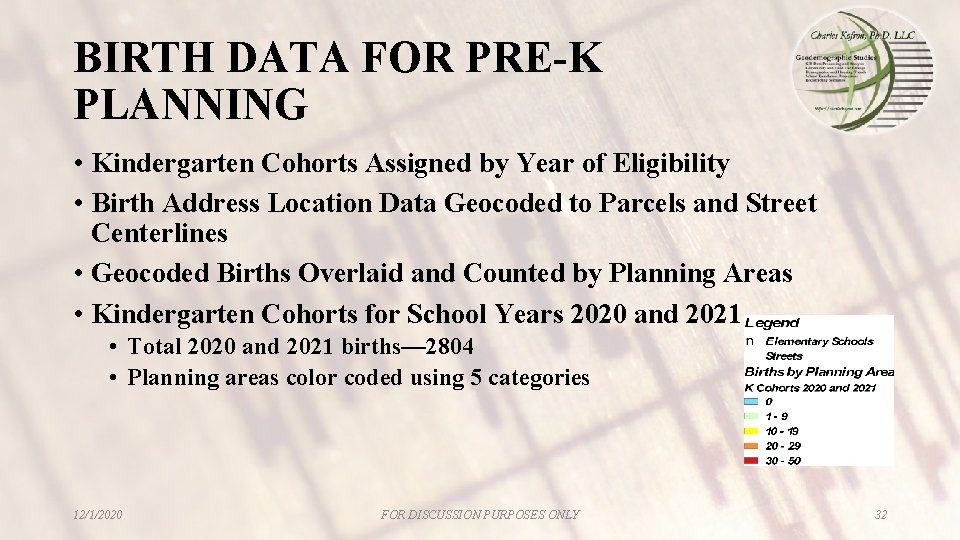
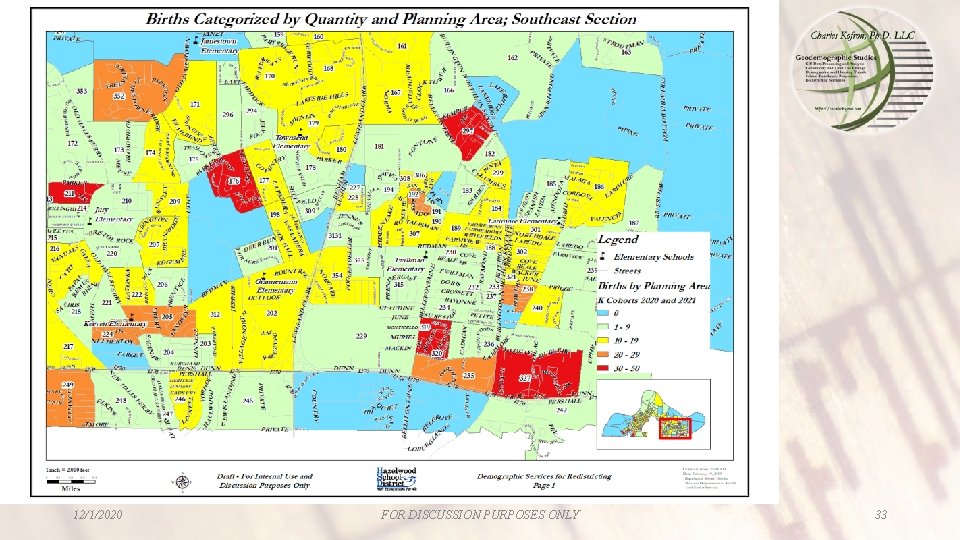
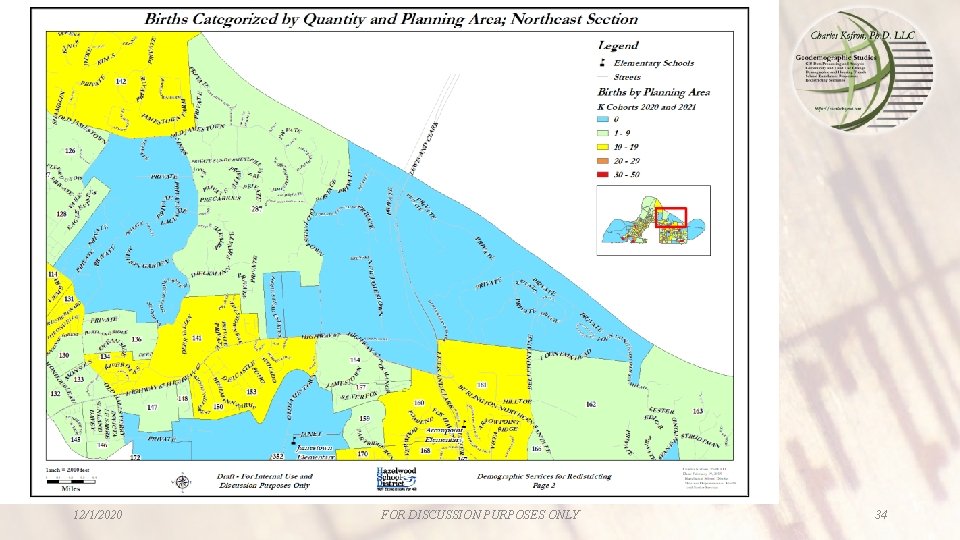
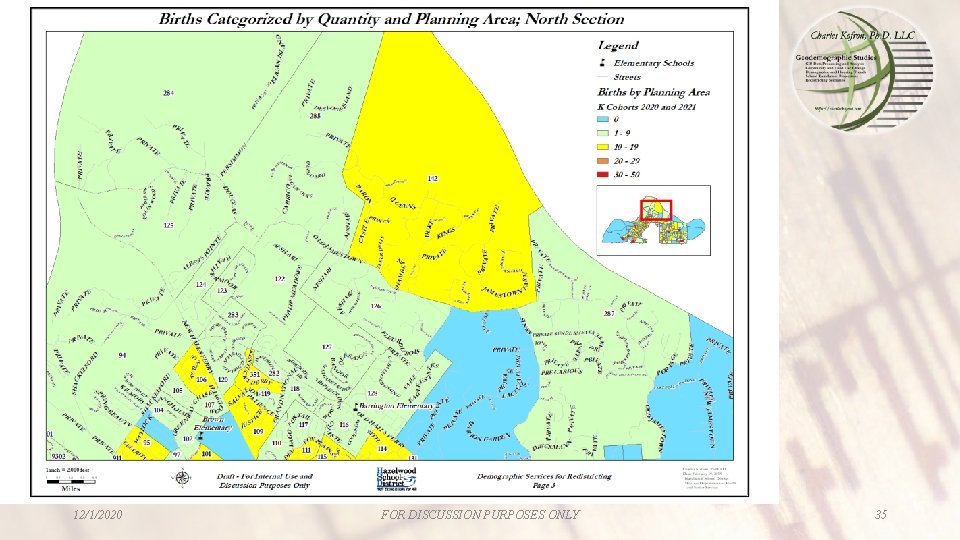
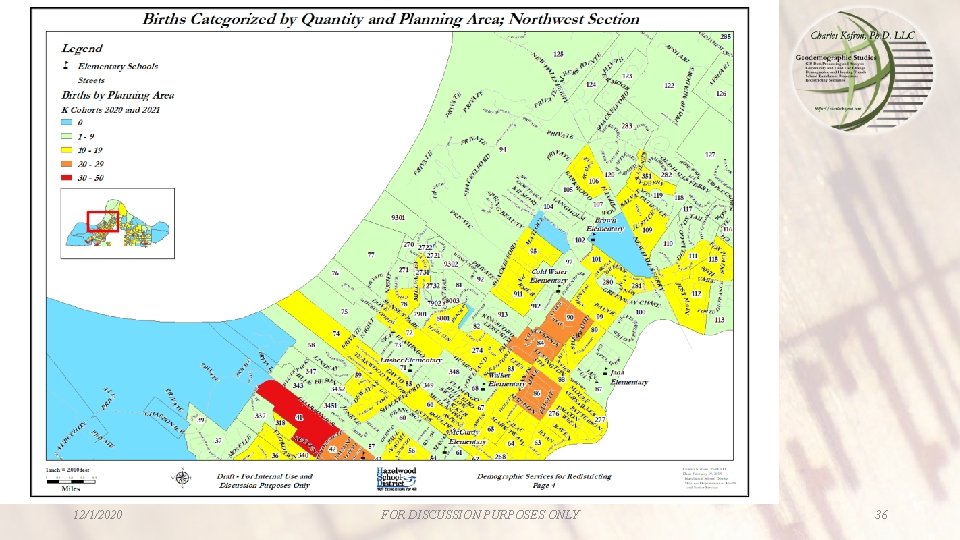
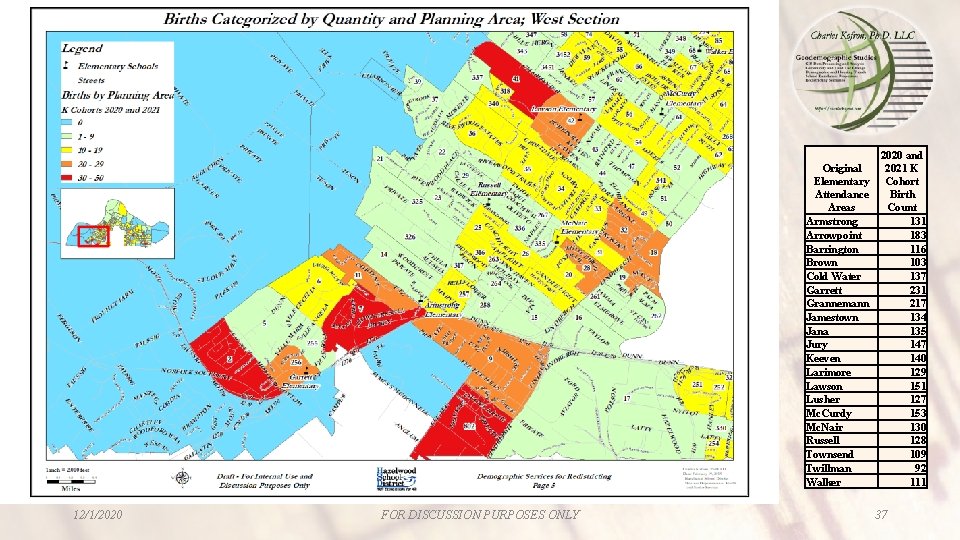
BIRTH DATA FOR PRE-K PLANNING • Kindergarten Cohorts Assigned by Year of Eligibility • Birth Address Location Data Geocoded to Parcels and Street Centerlines • Geocoded Births Overlaid and Counted by Planning Areas • Kindergarten Cohorts for School Years 2020 and 2021 • Total 2020 and 2021 births— 2804 • Planning areas color coded using 5 categories 12/1/2020 FOR DISCUSSION PURPOSES ONLY 32
12/1/2020 FOR DISCUSSION PURPOSES ONLY 33
12/1/2020 FOR DISCUSSION PURPOSES ONLY 34
12/1/2020 FOR DISCUSSION PURPOSES ONLY 35
12/1/2020 FOR DISCUSSION PURPOSES ONLY 36
Original Elementary Attendance Areas Armstrong Arrowpoint Barrington Brown Cold Water Garrett Grannemann Jamestown Jana Jury Keeven Larimore Lawson Lusher Mc. Curdy Mc. Nair Russell Townsend Twillman Walker 12/1/2020 FOR DISCUSSION PURPOSES ONLY 2020 and 2021 K Cohort Birth Count 131 183 116 103 137 231 217 134 135 147 140 129 151 127 153 130 128 109 92 111 37
QUESTIONS AND ANSWERS What are the major differences between Option 1 and Option 2? A – Option 1 involves limited changes intended to eliminate noncontiguous (“island”) areas and help transportation efficiency with little student movement. Option 2 involves broader changes intended to balance school enrollments and improve transportation efficiency. Why is 85% capacity used in the elementary counts and what building areas do they include? A – Building capacities were developed utilizing Missouri School Improvement Program (MSIP) guidelines. The capacity figures only include classrooms and do not include specialty areas such as gymnasiums, art, music, etc. 12/1/2020 FOR DISCUSSION PURPOSES ONLY 38
QUESTIONS AND ANSWERS What is the financial impact of Option 1 versus Option 2? A – For both options the potential exists for transportation efficiency that would reduce transportation costs as well as travel times in some of the boundaries. There is more opportunity for transportation efficiency with Option 2. A better balance of schools also has the potential to smooth enrollment and staffing, but that is always a year-to-year decision based on actual enrollment and staffing within Board policy. How many students would actually have to change schools? A – A chart is being developed and will be posted on the Redistricting page of the district’s website. This is anticipated to be posted before the first Community Engagement Open House on February 28 th. 12/1/2020 FOR DISCUSSION PURPOSES ONLY 39
QUESTIONS AND ANSWERS Can I see how elementary schools would progress to each middle and high school? A – A chart is being developed and will be posted on the Redistricting page of the district’s website. This is anticipated to be posted before the first Community Engagement Open House on February 28 th. I understand that the numbers in the presentation are based on student addresses, but can I see the actual enrollment at each school? A – A chart is being developed and will be posted on the Redistricting page of the district’s website. This is anticipated to be posted before the first Community Engagement Open House on February 28 th. 12/1/2020 FOR DISCUSSION PURPOSES ONLY 40
QUESTIONS AND ANSWERS Why does the study use student address and birth rate data? A – This data is used for consistency. It is not impacted by fluctuations in enrollment or mobility (students who move in and out of the district). What do the changes for East Middle School mean for the 8 th grade program? A – Nothing has changed for this program. The boundary changes serve to clarify the boundaries for East Middle School as they have been adjusted each of the last two years. 12/1/2020 FOR DISCUSSION PURPOSES ONLY 41
QUESTIONS AND ANSWERS Why is Pre-K birth rate information included? A – Pre-K planning information was included for identification of potential future enrollments in Kindergarten as well as the Early Childhood program. What are the next steps? A – Please see the next two slides. 12/1/2020 FOR DISCUSSION PURPOSES ONLY 42
PATH FORWARD • Board Retreat – Preliminary Presentation – January 11, 2019 • Board Retreat – Revised Presentation – February 8, 2019 • Regular Board Meeting Presentation – February 19, 2019 • Community Engagement Open Houses – February/March, 2019 • Additional information on next slide • Update at Regular Board Meeting – March 5, 2019 • Board Discussion on Feedback and Consideration – April 8, 2019 • Board Action – April 16, 2019 • Consideration of 5 -year Study Schedule – 2023 -24 12/1/2020 FOR DISCUSSION PURPOSES ONLY 43
COMMUNITY ENGAGEMENT OPEN HOUSES • February 28 - 5: 00 p. m. – 6: 30 p. m. at Central High School library • March 4 - 5: 00 p. m. – 6: 30 p. m. at West High School library • March 12 - 5: 00 p. m. – 6: 30 p. m. at East High School library Open House/Map Gallery Walk Summary • All events will be similar in nature; there is no need to attend all three. You may attend at any time between 5: 00 p. m. – 6: 30 p. m. (no formal presentations will be given) • We will have poster-sized maps for patrons to view • Board members, Administrators, and Consultants will be available to answer questions • Feedback forms will be available to share your thoughts/concerns with the Board • If you are unable to attend, please visit our website at www. Hazelwoodschools. org, then click on the “Redistricting” tab to view maps. To share feedback with Board members, click on this link http: //bit. ly/HSDRedistricting. 12/1/2020 FOR DISCUSSION PURPOSES ONLY 44
QUESTIONS