HAWKES LEARNING SYSTEMS math courseware specialists Section 12


 HA: Correlation of the population is")


- Slides: 41
HAWKES LEARNING SYSTEMS math courseware specialists Section 12. 2 Linear Regression Copyright © 2008 by Hawkes Learning Systems/Quant Systems, Inc. All rights reserved.
HAWKES LEARNING SYSTEMS math courseware specialists Regression, Inference, and Model Building 12. 2 Linear Regression Definitions: • If r (correlation coefficient) is statistically significant, then a regression line can be used to make predictions regarding the data. • Regression Line – the line from which the average variation from the data is the smallest. Also known as the line of best fit. There is only one regression line for each data set. b 0 = y-intercept b 1 = slope ^ Σ(Y – Y)2 = 24
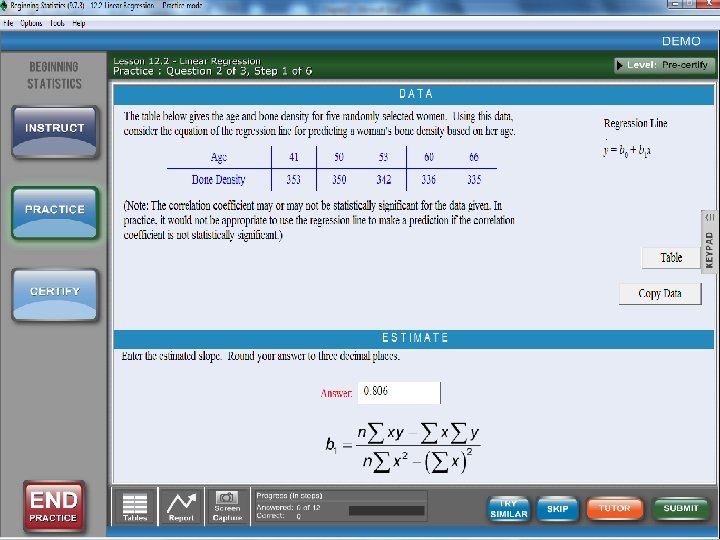
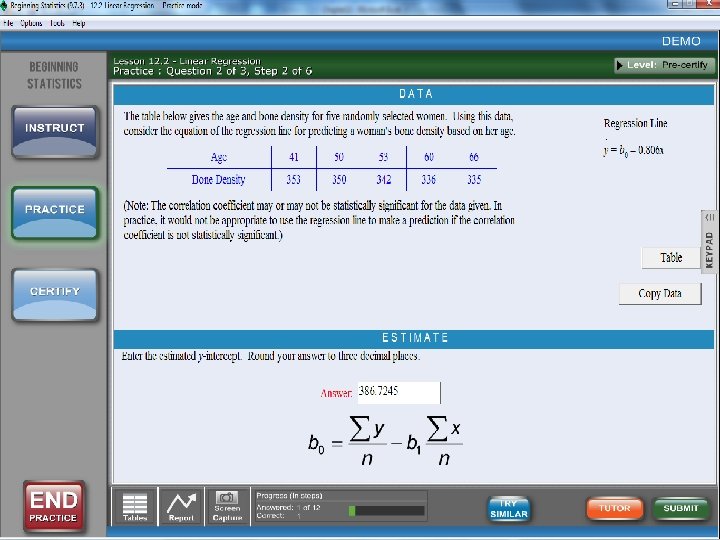
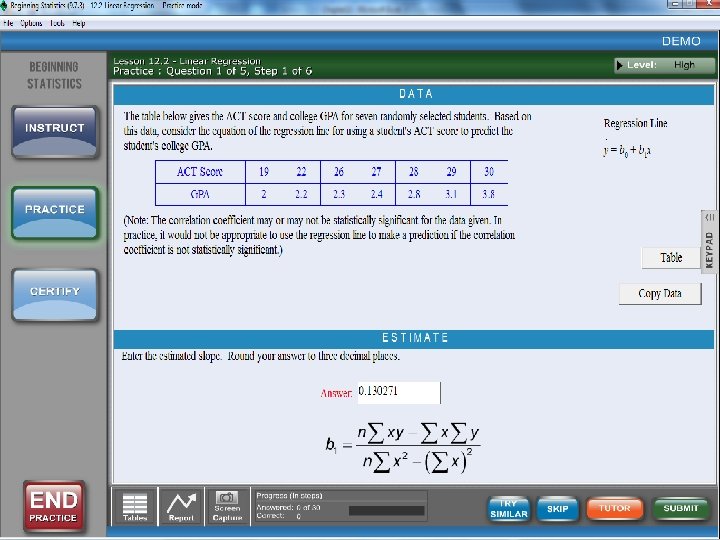
HAWKES LEARNING SYSTEMS math courseware specialists Regression, Inference, and Model Building 12. 2 Linear Regression Slope: When calculating the slope, round your answers to three decimal places. y-Intercept: When calculating the y-intercept, round your answers to three decimal places.
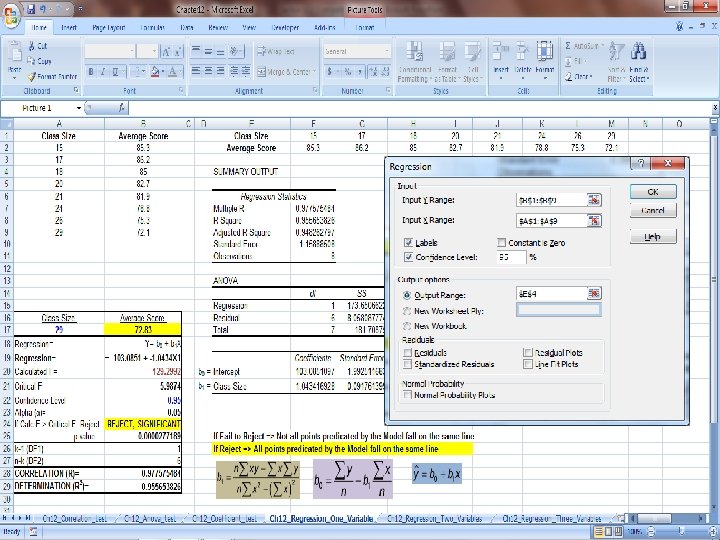
HAWKES LEARNING SYSTEMS math courseware specialists Regression, Inference, and Model Building 12. 2 Linear Regression Determine the regression line: The local school board wants to evaluate the relationship between class size and performance on the state achievement test. They decide to collect data from various schools in the county. A portion of the data collected is listed below. Each pair represents the class size and corresponding average score on the achievement test for 8 schools. Class Size 15 17 18 20 21 24 26 29 Average Score 85. 3 86. 2 85. 0 82. 7 81. 9 78. 8 75. 3 72. 1 Solution: First decide which variable should be the x variable and which variable should be y. Class size is the independent variable, x, and average score is the dependent variable, y. We can use a calculator or the equations to find the regression line.
Copy Data from Hawkes to Excel and Paste in cell A 1
HAWKES LEARNING SYSTEMS math courseware specialists Regression, Inference, and Model Building 12. 2 Linear Regression Solution (continued): Using the equations for slope and y-intercept: n = 8, ∑x = 170, ∑y = 647. 3, ∑xy = 13588. 7, ∑x 2 = 3772 – 1. 043 103. 085 Now place the slope and y-intercept into the regression line equation:
HAWKES LEARNING SYSTEMS math courseware specialists Regression, Inference, and Model Building 12. 2 Linear Regression Predictions: A prediction should not be made with a regression model if: 1. The correlation is not statistically significant. 2. You are using a value outside of the range of the sample data. 3. The population is different than that of the sample data.
HAWKES LEARNING SYSTEMS math courseware specialists Regression, Inference, and Model Building 12. 2 Linear Regression Calculate the prediction: Use the equation of the regression line, to predict what the average achievement test score will be for the following class size: a. 16 86. 390 b. 19 83. 260 c. 25 77. 000 d. 45 Since 45 is outside the range of the original data of 15 to 29, we cannot predict the test score.
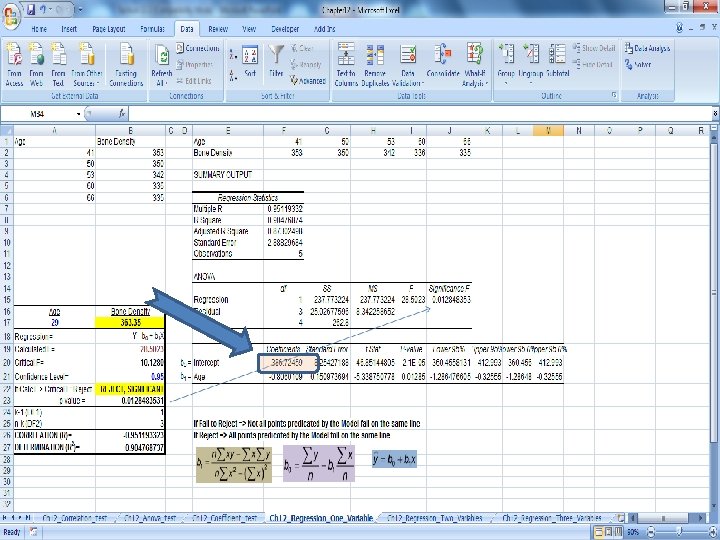
Copy Data from Hawkes to Excel and Paste in cell E 1. Select Data E 1: M 2, Copy and Paste Special, (Select option Transpose), in cell A 1. RUN REGRESSION ANALYSIS
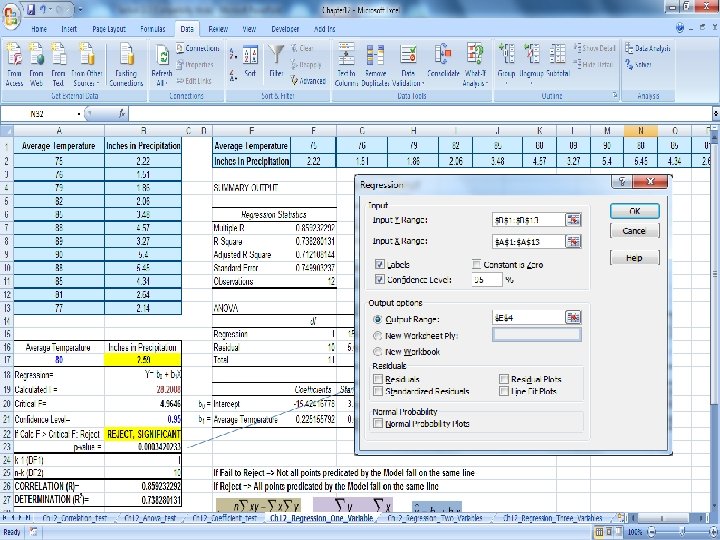
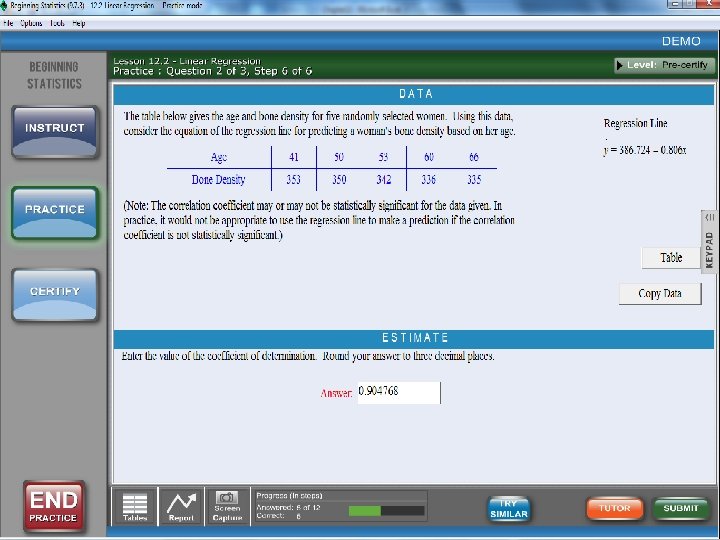
HAWKES LEARNING SYSTEMS math courseware specialists Regression, Inference, and Model Building 12. 2 Linear Regression Putting it all together: The table below gives the average monthly temperature and corresponding monthly precipitation totals for one year in Key West, Florida. Temperatures (in °F) and Precipitation (in inches) in Key West, FL Average Temperature Inches in Precipitation 75 76 79 82 85 88 89 90 88 85 81 77 2. 22 1. 51 1. 86 2. 06 3. 48 4. 57 3. 27 5. 40 5. 45 4. 34 2. 64 2. 14 a. Create a scatter plot. b. Calculate the correlation coefficient, r. c. Verify that the correlation coefficient is statistically significant at the 0. 05 level of significance. d. Calculate the equation of the line of best fit. e. Calculate and interpret the coefficient of determination, r 2. f. If appropriate, make a prediction for the monthly precipitation for a month in which the average temperature is 80 degrees. g. If appropriate, make a prediction for the monthly precipitation in Destin, FL for a month in which the average temperature is 83 degrees.
HAWKES LEARNING SYSTEMS math courseware specialists Regression, Inference, and Model Building 12. 2 Linear Regression Solution (continued): a. Create a scatter plot. The scatter plot shows a positive trend in data.
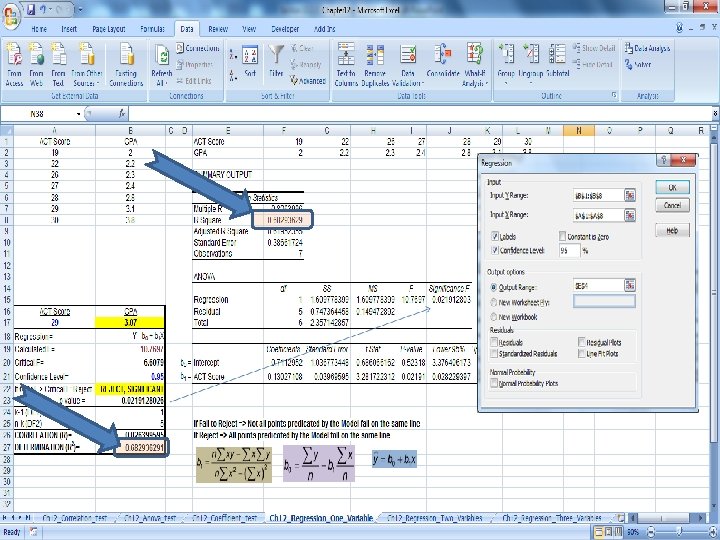
Copy Data from Hawkes to Excel and Paste in cell E 1. Select Data E 1: Q 2, Copy and Paste Special, (Select option Transpose), in cell A 1. RUN REGRESSION ANALYSIS
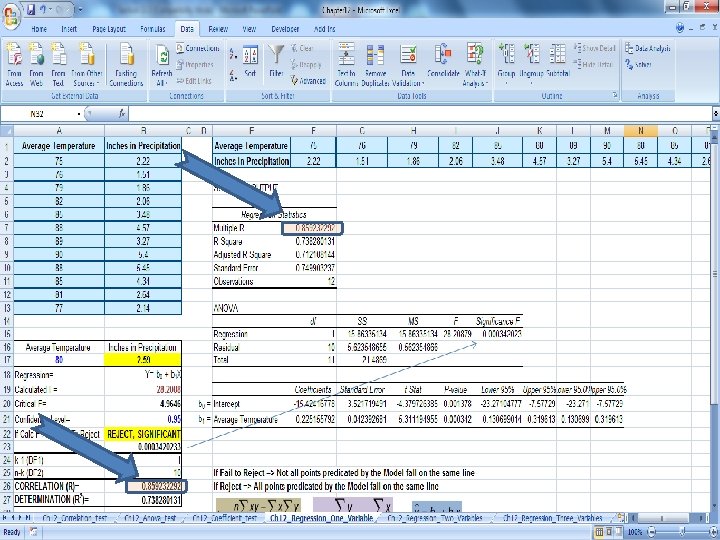
HAWKES LEARNING SYSTEMS math courseware specialists Regression, Inference, and Model Building 12. 2 Linear Regression Solution (continued): b. Calculate the correlation coefficient, r. n = 12, ∑x = 995, ∑y = 38. 94, ∑xy = 3299. 23, ∑x 2 = 82815, ∑y 2 = 147. 847 0. 859
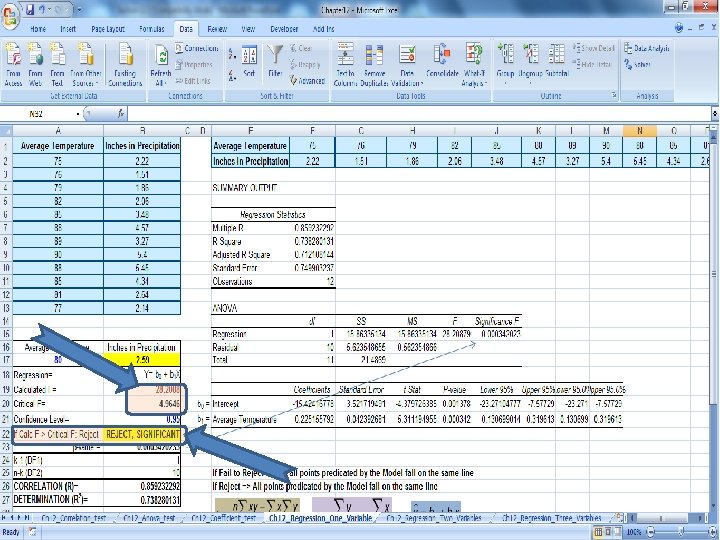
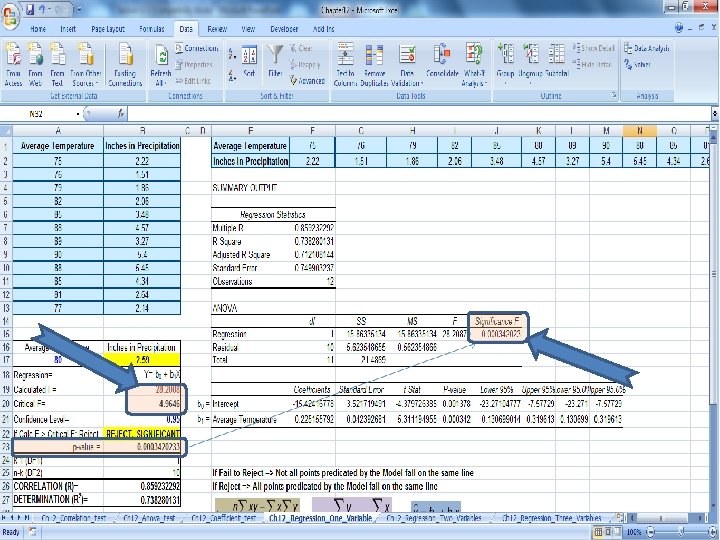
HAWKES LEARNING SYSTEMS math courseware specialists Regression, Inference, and Model Building 12. 2 Linear Regression Solution (continued): c. Verify that the correlation coefficient is statistically significant at the 0. 05 level of significance. n = 12, r 0. 859, = 0. 05 r = 0. 576 Statistically significant if |r | > r . Therefore, r is statistically significant at the 0. 05 level.
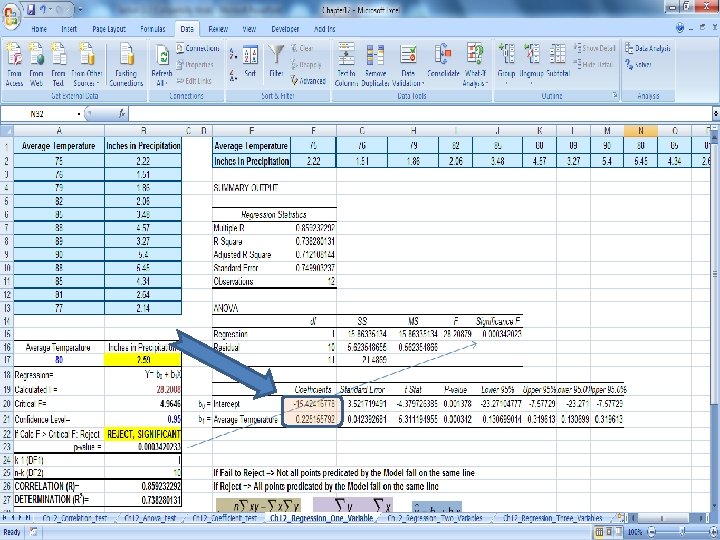
HAWKES LEARNING SYSTEMS math courseware specialists Regression, Inference, and Model Building 12. 2 Linear Regression Solution (continued): d. Calculate the equation of the line of best fit. n = 12, ∑x = 995, ∑y = 38. 94, ∑xy = 3299. 23, ∑x 2 = 82815 0. 225 – 15. 424 Now place the slope and y-intercept into the regression line equation:
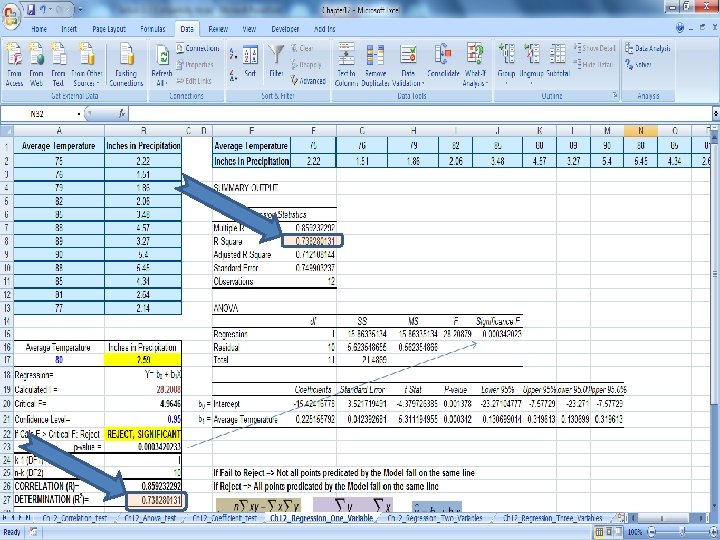
HAWKES LEARNING SYSTEMS math courseware specialists Regression, Inference, and Model Building 12. 2 Linear Regression Solution (continued): e. Calculate and interpret the coefficient of determination, r 2. r 0. 859 r 2 0. 738 So about 73. 8% of the variation in precipitation can be attributed to the linear relationship between temperature and precipitation. The remaining 26. 2% of the variation is from unknown sources.
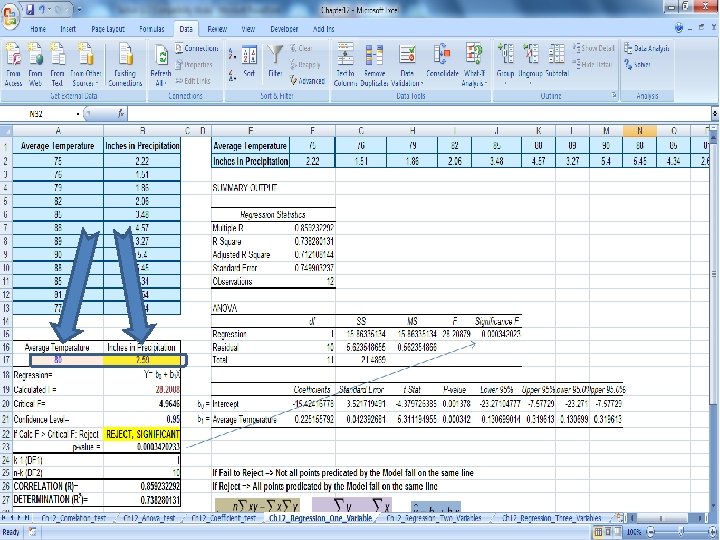
HAWKES LEARNING SYSTEMS math courseware specialists Regression, Inference, and Model Building 12. 2 Linear Regression Solution (continued): f. If appropriate, make a prediction for the monthly precipitation for a month in which the average temperature is 80 degrees. 2. 588 Thus a reasonable estimate for the precipitation for a month in which the average temperature is 80 degrees is about 2. 59 inches. g. If appropriate, make a prediction for the monthly precipitation in Destin, FL for a month in which the average temperature is 83 degrees. The data was collected in Key West, not Destin, FL. Therefore, it is not appropriate to use the linear regression line to make predictions regarding the precipitation in Destin.
Copy Data from Hawkes to Excel and Paste in cell E 1. Select Data E 1: J 2, Copy and Paste Special, (Select option Transpose), in cell A 1.
-0. 806
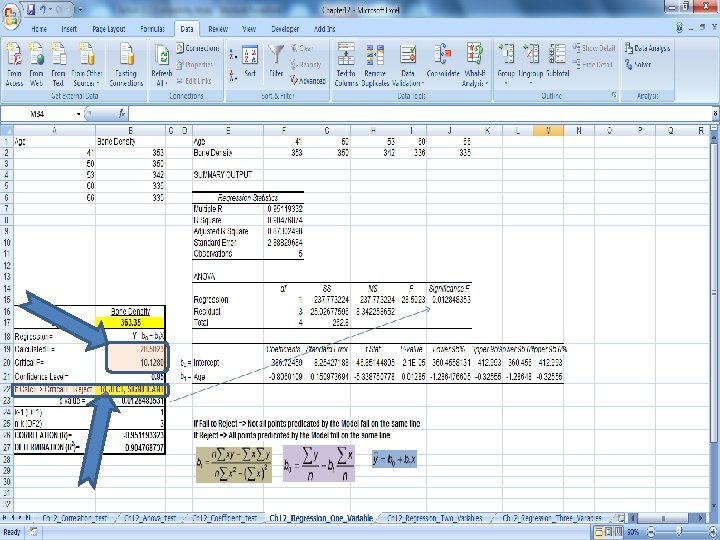
Ho: Correlation of the population is 0 (zero) HA: Correlation of the population is Not 0 (zero) If Reject => All points predicated by the Model fall on the same line
386. 724
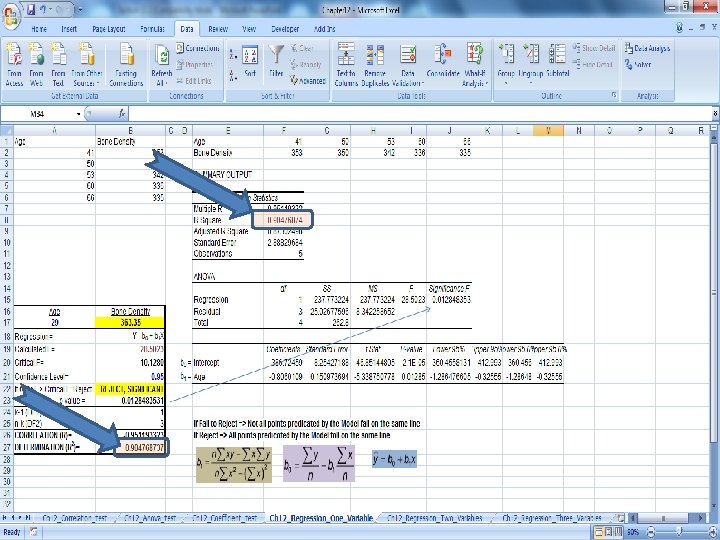
Copy Data from Hawkes to Excel and Paste in cell E 1. Select Data E 1: L 2, Copy and Paste Special, (Select option Transpose), in cell A 1.
--------y= -0. 711 + 0. 1302 x -0. 711
--------y= -0. 711 + 0. 13027 x
--------y= -0. 711 + 0. 13027 x