HAWKES LEARNING SYSTEMS math courseware specialists Copyright 2008


- Slides: 29
HAWKES LEARNING SYSTEMS math courseware specialists Copyright © 2008 by Hawkes Learning Systems/Quant Systems, Inc. All rights reserved. Section 12. 1 Scatter Plots and Correlation
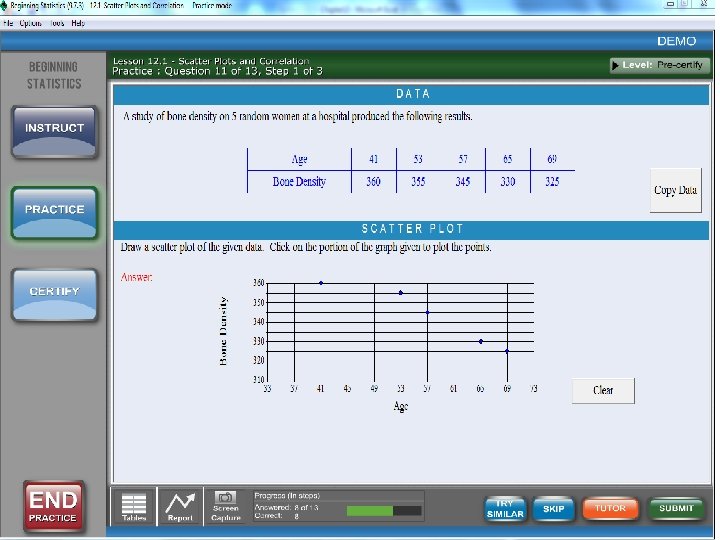
HAWKES LEARNING SYSTEMS math courseware specialists Regression, Inference, and Model Building 12. 1 Scatter Plots and Correlation Definitions: • Scatter Plot – a graph on the coordinate plane which contains one point for each pair of data. • Independent Variable – placed on the x-axis, this variable causes a change in the dependent variable. Also known as the predictor variable or the explanatory variable. (x) • Dependent Variable – placed on the y-axis, this variable changes in response to the independent variable. Also known as the response variable. (y) b 0 = y-intercept b 1 = slope
HAWKES LEARNING SYSTEMS math courseware specialists Regression, Inference, and Model Building 12. 1 Scatter Plots and Correlation Draw a scatter plot: Draw a scatter plot to represent the following data: Hours of Study 0 0. 5 1 1. 5 2 2 3 4. 5 5 Test Grade 72 84 68 85 77 81 48 90 99 88 Solution:
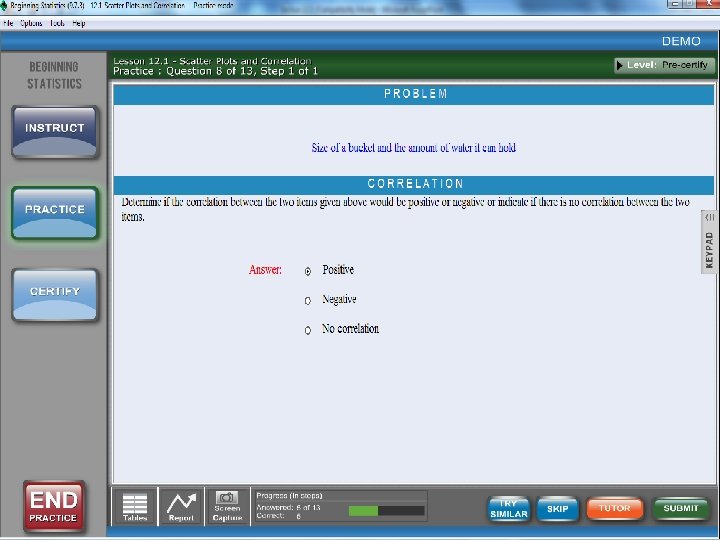
HAWKES LEARNING SYSTEMS math courseware specialists Regression, Inference, and Model Building 12. 1 Scatter Plots and Correlation Scatter Plots: • We are interested in the relationship between the two variables being studied. Like any other relationship, some relationships are stronger than others. • Linear Relationship – when a relationship seems to follow a straight line. • Positive Slope (+b 1) – indicates that as the values of one variable increase, so do the values of the other variable. (Higher Salary (x) , More Consumption (y)) • Negative Slope (-b 1)– indicates that as the values of one variable increase, the values of the other variable decrease. (Higher Price (x), Less Consumption (y))
HAWKES LEARNING SYSTEMS math courseware specialists Regression, Inference, and Model Building 12. 1 Scatter Plots and Correlation Types of Slopes: x The hours you study for a final exam and your final grade. x The price of a used car and the number of miles it was driven.
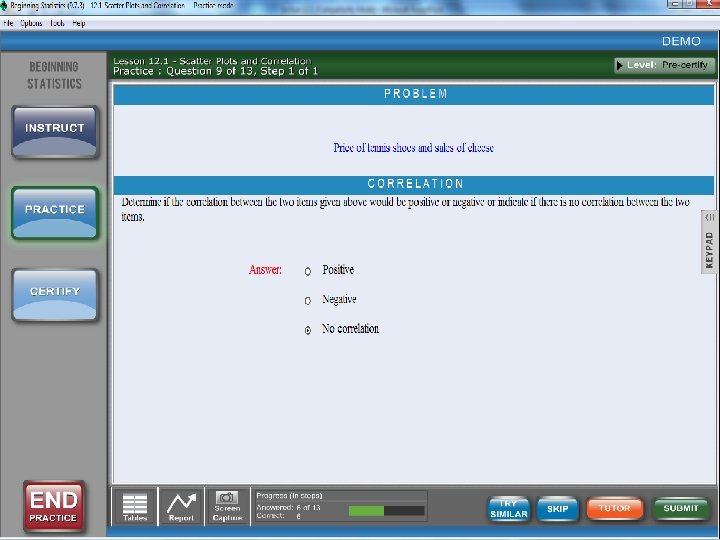
HAWKES LEARNING SYSTEMS math courseware specialists Regression, Inference, and Model Building 12. 1 Scatter Plots and Correlation: • Correlation is the mathematical term for the relationship between the two variables x and y. • Strong Linear Correlation – when a relationship seems to follow a straight line. • Weak Linear Correlation– when a relationship seems to follow a straight line, but the points are more scattered. • No Correlation– no relationship between the variables.
HAWKES LEARNING SYSTEMS math courseware specialists Types of Relationships: Regression, Inference, and Model Building 12. 1 Scatter Plots and Correlation
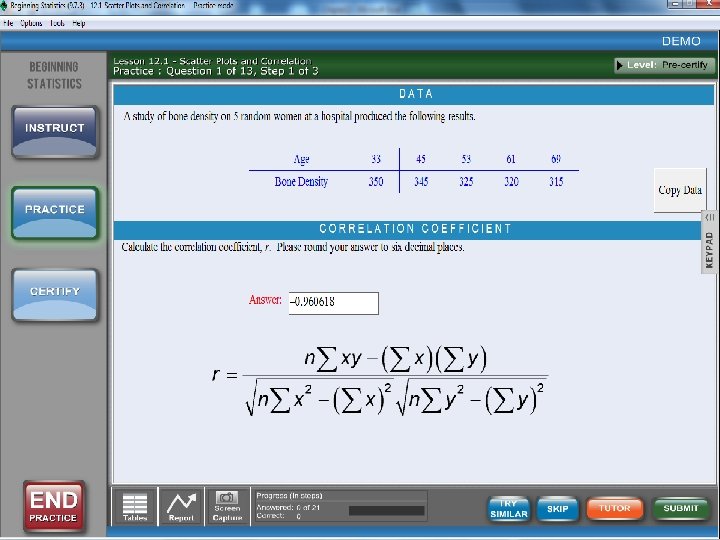
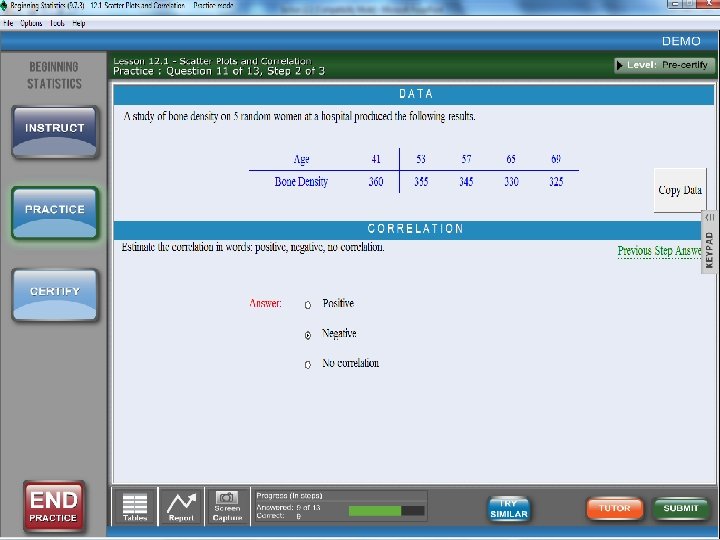
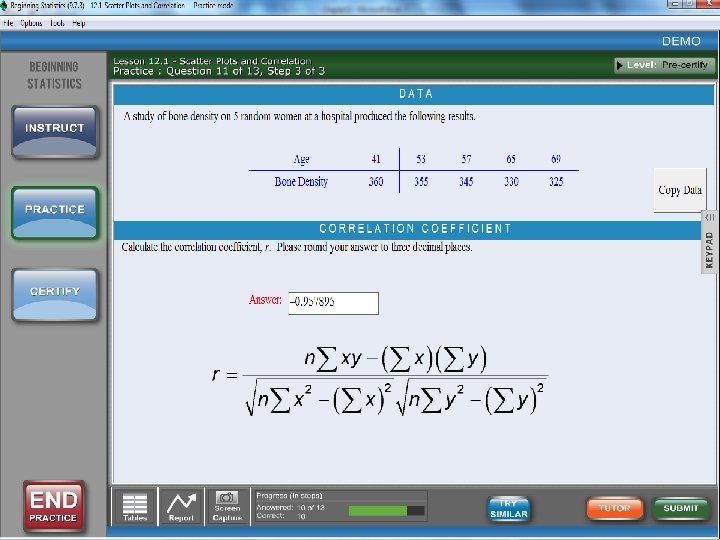
HAWKES LEARNING SYSTEMS math courseware specialists Regression, Inference, and Model Building 12. 1 Scatter Plots and Correlation coefficient: • Pearson Correlation Coefficient, – the parameter that measures the strength of a linear relationship for the population. • Correlation Coefficient, r – measures how strongly one variable is linearly dependent upon the other for a sample. When calculating the correlation coefficient, round your answers to three decimal places.
HAWKES LEARNING SYSTEMS math courseware specialists Regression, Inference, and Model Building 12. 1 Scatter Plots and Correlation Coefficient (r) • – 1 ≤ r ≤ 1 • Close to – 1 means a strong negative correlation. • Close to 0 means no correlation. • Close to 1 means a strong positive correlation.
HAWKES LEARNING SYSTEMS math courseware specialists Regression, Inference, and Model Building 12. 1 Scatter Plots and Correlation Find the value of r: Calculate the correlation coefficient, r, for the data shown below. Hours of Study 0 0. 5 1 1. 5 2 2 3 4. 5 5 Test Grade 72 84 68 85 77 81 48 90 99 88 Solution: n = 10, ∑x = 20, ∑y = 792, ∑xy = 1690, ∑x 2 = 66, ∑y 2 = 64528 0. 490
HAWKES LEARNING SYSTEMS math courseware specialists Regression, Inference, and Model Building 12. 1 Scatter Plots and Correlation Null and Alternative Hypotheses Testing for Linear Relationships: • Significant Linear Relationship (Two-Tailed Test): H 0: = 0 (Implies there is no significant linear relationship. ) Ha: ≠ 0 (Implies there is a significant linear relationship. ) • Negative Linear Relationship (Left-Tailed Test): H 0 : ≥ 0 Ha : < 0 • Positive Linear Relationship (Right-Tailed Test): H 0 : ≤ 0 Ha : > 0
HAWKES LEARNING SYSTEMS math courseware specialists Regression, Inference, and Model Building 12. 1 Scatter Plots and Correlation Testing Statistic: with d. f. = n – 2 To determine if the test statistic calculated from the sample is statistically significant we will need to look at the critical value.
HAWKES LEARNING SYSTEMS math courseware specialists Regression, Inference, and Model Building 12. 1 Scatter Plots and Correlation Rejection Rule for Testing Linear Relationships: • Significant Linear Relationship (Two-Tailed Test): Reject H 0 if |t | ≥ t /2 • Negative Linear Relationship (Left-Tailed Test): Reject H 0 if t ≤ –t • Positive Linear Relationship (Right-Tailed Test): Reject H 0 if t ≥ t
HAWKES LEARNING SYSTEMS math courseware specialists Regression, Inference, and Model Building 12. 1 Scatter Plots and Correlation Steps for Hypothesis Testing: 1. State the null of alternative hypotheses. 2. Set up the hypothesis test by choosing the test statistic and determining the values of the test statistic that would lead to rejecting the null hypothesis. 3. Gather data and calculate the necessary sample statistics. 4. Draw a conclusion.
HAWKES LEARNING SYSTEMS math courseware specialists Regression, Inference, and Model Building 12. 1 Scatter Plots and Correlation Draw a conclusion: Use a hypothesis test to determine if the linear relationship between the number of parking tickets a student receives during a semester and their GPA during the same semester is statistically significant at the 0. 05 level of significance. # of Tickets 0 GPA 0 0 0 1 1 1 2 2 2 3 3 5 7 8 3. 6 3. 9 2. 4 3. 1 3. 5 4. 0 3. 6 2. 8 3. 0 2. 2 3. 9 3. 1 2. 8 1. 7 Solution: First state the hypotheses: H 0 : = 0 Ha : ≠ 0 Next, set up the hypothesis test and determine the critical value: d. f. = 13, = 0. 05 t 0. 025 = 2. 160 Reject if |t | ≥ t /2 , or if |t | ≥ 2. 160
HAWKES LEARNING SYSTEMS math courseware specialists Regression, Inference, and Model Building 12. 1 Scatter Plots and Correlation Solution (continued): Gather the data and calculate the necessary sample statistics: n = 15, r = – 0. 587 – 2. 614 Finally, draw a conclusion: Reject if |t | ≥ t /2 , or if |t | ≥ 2. 160 Since |t | = 2. 614 is greater than t /2 = 2. 160, we will reject the null hypothesis. The correlation is statistically significant.
HAWKES LEARNING SYSTEMS math courseware specialists Regression, Inference, and Model Building 12. 1 Scatter Plots and Correlation Using Critical Values to Determine Statistical Significance: The correlation coefficient, r, is statistically significant if the absolute value of the correlation is greater than the critical value in the Pearson Correlation Coefficient Table. |r | > r
HAWKES LEARNING SYSTEMS math courseware specialists Determine the significance: Regression, Inference, and Model Building 12. 1 Scatter Plots and Correlation If |r | > r Yes, correlation is significant Determine whether the following values of r are statistically significant. a. r = 0. 52, n = 19, = 0. 05 r = 0. 456, Yes b. r = 0. 52, n = 19, = 0. 01 r = 0. 575, No
HAWKES LEARNING SYSTEMS math courseware specialists Regression, Inference, and Model Building 12. 1 Scatter Plots and Correlation Coefficient of Determination: The coefficient of determination, r 2, is the measure of the amount of variation in y explained by the variation in x.
HAWKES LEARNING SYSTEMS math courseware specialists Regression, Inference, and Model Building 12. 1 Scatter Plots and Correlation Coefficient of Determination : If the correlation between the number of rooms in a house and its price is r = 0. 65, how much of the variation in price can be explained by the relationship between the two variables? Solution: r = 0. 65 r 2 0. 423 So about 42. 3% of the variation in the price of a house can be explained by the relationship between the two variables.
Copy Data from Hawkes to Excel and Paste in cell A 1.
r = 0. 735 n 4 5 6 7 8 9 10 11 12 a =. 05 0. 95 0. 878 0. 811 0. 754 0. 707 0. 666 0. 632 0. 602 0. 576 Statistically significant if |r | > r. , But, 0. 331 < 0. 735 Therefore, r is not statistically significant at the 0. 01 level. a =. 01 0. 99 0. 959 0. 917 0. 875 0. 834 0. 798 0. 765 0. 735 0. 708
Copy Data from Hawkes to Excel and Paste in cell A 1.