Have studied INTRAmolecular forces the forces holding atoms


- Slides: 70

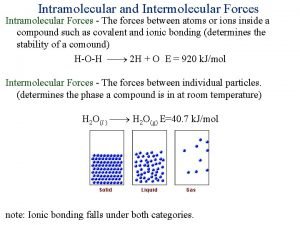
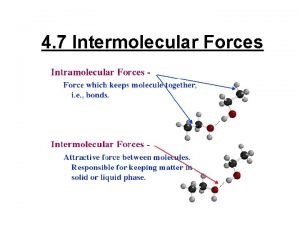
Have studied INTRAmolecular forces— the forces holding atoms together to form molecules. Now turn to forces between molecules — INTERmolecular forces. Forces between molecules, between ions, or between molecules and ions. © 2006 Brooks/Cole - Thomson Intermolecular Forces

Ion-Ion Forces for comparison of magnitude Na+—Cl- in salt These are the strongest forces. Lead to solids with high melting temperatures. Na. Cl, mp = 800 o. C Mg. O, mp = 2800 o. C © 2006 Brooks/Cole - Thomson

Covalent Bonding Forces for comparison of magnitude C=C, 610 k. J/mol C–C, 346 k. J/mol C–H, 413 k. J/mol © 2006 Brooks/Cole - Thomson CN, 887 k. J/mol

Attraction Between Ions and Permanent Dipoles Water is highly polar and can interact with positive ions to give hydrated ions in water. © 2006 Brooks/Cole - Thomson

Attraction Between Ions and Permanent Dipoles Water is highly polar and can interact with positive ions to give hydrated ions in water. © 2006 Brooks/Cole - Thomson

Attraction Between Ions and Permanent Dipoles Many metal ions are hydrated. This is the reason metal salts dissolve in water. © 2006 Brooks/Cole - Thomson

Attraction Between Ions and Permanent Dipoles Attraction between ions and dipole depends on ion charge and ion-dipole distance. Measured by ∆H for Mn+ + H 2 O --> [M(H 2 O)x]n+ -1922 k. J/mol © 2006 Brooks/Cole - Thomson -405 k. J/mol -263 k. J/mol

Dipole-Dipole Forces Such forces bind molecules having permanent dipoles to one another. © 2006 Brooks/Cole - Thomson

Dipole-Dipole Forces Influence of dipole-dipole forces is seen in the boiling points of simple molecules. Compd Mol. Wt. Boil Point N 2 28 -196 o. C CO 28 -192 o. C Br 2 160 59 o. C ICl 162 97 o. C © 2006 Brooks/Cole - Thomson

Hydrogen Bonding A special form of dipole-dipole attraction, which enhances dipole-dipole attractions. H-bonding is strongest when X and Y are N, O, or F © 2006 Brooks/Cole - Thomson

Hydrogen Bonding in H 2 O H-bonding is especially strong in water because • the O—H bond is very polar • there are 2 lone pairs on the O atom Accounts for many of water’s unique properties. © 2006 Brooks/Cole - Thomson

Hydrogen Bonding in H 2 O Ice has open lattice -like structure. Ice density is < liquid. And so solid floats on water. Snow flake: www. snowcrystals. com © 2006 Brooks/Cole - Thomson

Hydrogen Bonding in H 2 O Ice has open lattice-like structure. Ice density is < liquid and so solid floats on water. One of the VERY few substances where solid is LESS DENSE than the liquid. © 2006 Brooks/Cole - Thomson

Hydrogen Bonding in H 2 O H bonds ---> abnormally high specific heat capacity of water (4. 184 J/g • K) This is the reason water is used to put out fires, it is the reason lakes/oceans control climate, and is the reason thunderstorms release huge energy. © 2006 Brooks/Cole - Thomson

Hydrogen Bonding H bonds leads to abnormally high boiling point of water. © 2006 Brooks/Cole - Thomson

Boiling Points of Simple Hydrogen-Containing Compounds Active Figure 13. 8 © 2006 Brooks/Cole - Thomson

Hydrogen Bonding in Biology H-bonding is especially strong in biological systems — such as DNA — helical chains of phosphate groups and sugar molecules. Chains are helical because of tetrahedral geometry of P, C, and O. Chains bind to one another by specific hydrogen bonding between pairs of Lewis bases. —adenine with thymine —guanine with cytosine © 2006 Brooks/Cole - Thomson

Double helix of DNA Portion of a DNA chain © 2006 Brooks/Cole - Thomson

Base-Pairing through H-Bonds © 2006 Brooks/Cole - Thomson

Base-Pairing through H-Bonds © 2006 Brooks/Cole - Thomson

FORCES INVOLVING INDUCED DIPOLES How can non-polar molecules such as O 2 and I 2 dissolve in water? The water dipole INDUCES a dipole in the O 2 electric cloud. Dipole-induced dipole © 2006 Brooks/Cole - Thomson

FORCES INVOLVING INDUCED DIPOLES Solubility increases with mass the gas © 2006 Brooks/Cole - Thomson

FORCES INVOLVING INDUCED DIPOLES • Process of inducing a dipole is polarization • Degree to which electron cloud of an atom or molecule can be distorted in its polarizability. © 2006 Brooks/Cole - Thomson

IM FORCES — INDUCED DIPOLES Consider I 2 dissolving in ethanol, CH 3 CH 2 OH. -d I-I -d O R H +d © 2006 Brooks/Cole - Thomson I-I The alcohol temporarily creates or INDUCES a dipole in I 2. +d -d O R H +d

FORCES INVOLVING INDUCED DIPOLES Formation of a dipole in two nonpolar I 2 molecules. Induced dipole-induced dipole The induced forces between I 2 molecules are very weak, so solid I 2 sublimes (goes from a solid to gaseous molecules). © 2006 Brooks/Cole - Thomson

FORCES INVOLVING INDUCED DIPOLES The magnitude of the induced dipole depends on the tendency to be distorted. Higher molec. weight ---> larger induced dipoles. Molecule Boiling Point (o. C) CH 4 (methane) - 161. 5 C 2 H 6 (ethane) - 88. 6 C 3 H 8 (propane) - 42. 1 C 4 H 10 (butane) - 0. 5 © 2006 Brooks/Cole - Thomson

Boiling Points of Hydrocarbons C 4 H 10 C 3 H 8 C 2 H 6 CH 4 Note linear relation between bp and molar mass. © 2006 Brooks/Cole - Thomson

Intermolecular Forces Summary © 2006 Brooks/Cole - Thomson

Measuring Equilibrium Vapor Pressure Liquid in flask evaporates and exerts pressure on manometer. Active Fig. 13. 17 © 2006 Brooks/Cole - Thomson

Equilibrium Vapor Pressure Active Figure 13. 18 © 2006 Brooks/Cole - Thomson

Liquids Equilibrium Vapor Pressure FIGURE 13. 18: VP as a function of T. 1. The curves show all conditions of P and T where LIQ and VAP are in EQUILIBRIUM 2. The VP rises with T. 3. When VP = external P, the liquid boils. This means that BP’s of liquids change with altitude. 4. If external P = 760 mm Hg, T of boiling is the NORMAL BOILING POINT 5. VP of a given molecule at a given T depends on IM forces. Here the VP’s are in the order ether O C 2 H 5 H 5 C 2 dipole alcohol O H 5 C 2 H H-bonds increasing strength of IM interactions © 2006 Brooks/Cole - Thomson water O H H extensive H-bonds

Liquids HEAT OF VAPORIZATION is the heat req’d (at constant P) to vaporize the liquid. LIQ + heat ---> VAP Compd. ∆Hvap (k. J/mol) H 2 O 40. 7 (100 o. C) H-bonds SO 2 26. 8 (-47 o. C) dipole Xe 12. 6 (-107 o. C) induced dipole © 2006 Brooks/Cole - Thomson IM Force

Phase Diagrams © 2006 Brooks/Cole - Thomson

TRANSITIONS BETWEEN PHASES Section 13. 10 Lines connect all conditions of T and P where EQUILIBRIUM exists between the phases on either side of the line. (At equilibrium particles move from liquid to gas as fast as they move from gas to liquid, for example. ) © 2006 Brooks/Cole - Thomson

Phase Diagram for Water Liquid phase Solid phase Gas phase © 2006 Brooks/Cole - Thomson

Phase Equilibria — Water Solid-liquid Gas-Liquid Gas-Solid © 2006 Brooks/Cole - Thomson

Triple Point — Water At the TRIPLE POINT all three phases are in equilibrium. © 2006 Brooks/Cole - Thomson

Phases Diagrams— Important Points for Water T(˚C) P(mm. Hg) Normal boil point 100 760 Normal freeze point 0 760 Triple point 0. 0098 © 2006 Brooks/Cole - Thomson 4. 58

Critical T and P As P and T increase, you finally reach the CRITICAL T and P Above critical T no liquid exists no matter how high the pressure. At P < 4. 58 mm. Hg and T < 0. 0098 ˚C solid H 2 O can go directly to vapor. This process is called SUBLIMATION This is how a frost-free refrigerator works. © 2006 Brooks/Cole - Thomson

Critical T and P COMPD T c (o C ) Pc(atm) H 2 O 374 218 CO 2 31 73 CH 4 -82 46 Freon-12 (CCl 2 F 2) 112 41 Notice that Tc and Pc depend on intermolecular forces. © 2006 Brooks/Cole - Thomson

Solid-Liquid Equilibria In any system, if you increase P the DENSITY will go up. Therefore — as P goes up, equilibrium favors phase with the larger density (or SMALLER volume/gram). Liquid H 2 O Solid H 2 O Density cm 3/gram © 2006 Brooks/Cole - Thomson 1 g/cm 3 1 0. 917 g/cm 3 1. 09

Solid-Liquid Equilibria P Solid H 2 O Liquid H 2 O Raising the pressure at constant T causes water to melt. Normal freezing point 760 mm. Hg 0 °C The NEGATIVE SLOPE of the S/L line is unique to H 2 O. Almost everything else has positive slope. T The behavior of water under pressure is an example of LE CHATELIER’S PRINCIPLE At Solid/Liquid equilibrium, raising P squeezes the solid. It responds by going to phase with greater density, i. e. , the liquid phase. © 2006 Brooks/Cole - Thomson

CO 2 Phase Diagram © 2006 Brooks/Cole - Thomson

CO 2 Phases Separate phases Figure 13. 41 © 2006 Brooks/Cole - Thomson Increasing pressure More pressure Supercritcal CO 2

Dissolving An Ionic Solid Active Figure 14. 9 © 2006 Brooks/Cole - Thomson

Energetics of the Solution Process Figure 14. 8 © 2006 Brooks/Cole - Thomson

Energetics of the Solution Process If the enthalpy of formation of the solution is more negative that of the solvent and solute, the enthalpy of solution is negative. The solution process is exothermic! © 2006 Brooks/Cole - Thomson

Colligative Properties On adding a solute to a solvent, the props. of the solvent are modified. • Vapor pressure decreases • Melting point decreases • Boiling point increases • Osmosis is possible (osmotic pressure) These changes are called COLLIGATIVE PROPERTIES. They depend only on the NUMBER of solute particles relative to solvent particles, not on the KIND of solute particles. © 2006 Brooks/Cole - Thomson

Concentration Units MOLE FRACTION, X For a mixture of A, B, and C MOLALITY, m WEIGHT % = grams solute per 100 g solution © 2006 Brooks/Cole - Thomson

Calculating Concentrations Dissolve 62. 1 g (1. 00 mol) of ethylene glycol in 250. g of H 2 O. Calculate mol fraction, molality, and weight % of glycol. © 2006 Brooks/Cole - Thomson

Understanding Colligative Properties To understand colligative properties, study the LIQUIDVAPOR EQUILIBRIUM for a solution. © 2006 Brooks/Cole - Thomson

Understanding Colligative Properties VP of H 2 O over a solution depends on the number of H 2 O molecules per solute molecule. Psolvent proportional to Xsolvent Psolvent = Xsolvent • Posolvent VP of solvent over solution = (Mol frac solvent) • (VP pure solvent) RAOULT’S LAW © 2006 Brooks/Cole - Thomson

Raoult’s Law An ideal solution is one that obeys Raoult’s law. PA = XA • Po. A Because mole fraction of solvent, XA, is always less than 1, then PA is always less than Po. A. The vapor pressure of solvent over a solution is always LOWERED! © 2006 Brooks/Cole - Thomson

Raoult’s Law Assume the solution containing 62. 1 g of glycol in 250. g of water is ideal. What is the vapor pressure of water over the solution at 30 o. C? (The VP of pure H 2 O is 31. 8 mm Hg; see App. E. ) © 2006 Brooks/Cole - Thomson

Changes in Freezing and Boiling Points of Solvent • • For a 2 -component system where A is the solvent and B is the solute ∆PA = VP lowering = XBPo. A VP lowering is proportional to mol frac solute! For very dilute solutions, ∆PA = K • molality. B where K is a proportionality constant. • This helps explain changes in melting and boiling points. © 2006 Brooks/Cole - Thomson

Vapor Pressure Lowering Figure 14. 14 © 2006 Brooks/Cole - Thomson

The boiling point of a solution is higher than that of the pure solvent. © 2006 Brooks/Cole - Thomson

Elevation of Boiling Point Elevation in BP = ∆TBP = KBP • m (where KBP is characteristic of solvent) © 2006 Brooks/Cole - Thomson

Change in Boiling Point Dissolve 62. 1 g of glycol (1. 00 mol) in 250. g of water. What is the BP of the solution? KBP = +0. 512 o. C/molal for water (see Table 14. 3). © 2006 Brooks/Cole - Thomson

Change in Freezing Point Pure water Ethylene glycol/water solution The freezing point of a solution is LOWER than that of the pure solvent. FP depression = ∆TFP = KFP • m © 2006 Brooks/Cole - Thomson

Lowering the Freezing Point Water with and without antifreeze © 2006 Brooks/Cole - Thomson When a solution freezes, the solid phase is pure water. The solution becomes more concentrated.

Freezing Point Depression Calculate the FP of a 4. 00 molal glycol/water solution. KFP = -1. 86 o. C/molal (Table 14. 4) © 2006 Brooks/Cole - Thomson

Freezing Point Depression How much Na. Cl must be dissolved in 4. 00 kg of water to lower FP to -10. 00 o. C? . © 2006 Brooks/Cole - Thomson

Freezing Point Depression How much Na. Cl must be dissolved in 4. 00 kg of water to lower FP to -10. 00 o. C? . © 2006 Brooks/Cole - Thomson

Boiling Point Elevation and Freezing Point Depression ∆T = K • m • i A generally useful equation i = van’t Hoff factor = number of particles produced per formula unit. Compound Theoretical Value of i glycol 1 Na. Cl 2 Ca. Cl 2 3 © 2006 Brooks/Cole - Thomson

Osmosis The semipermeable membrane allows only the movement of solvent molecules. Solvent molecules move from pure solvent to solution in an attempt to make both have the same concentration of solute. Driving force is entropy © 2006 Brooks/Cole - Thomson

Osmosic Pressure, ∏ Osmotic pressure © 2006 Brooks/Cole - Thomson Equilibrium is reached when pressure — the OSMOTIC PRESSURE, ∏ — produced by extra solution counterbalances pressure of solvent molecules moving thru the membrane. ∏ = c. RT (c is conc. in mol/L)

Osmosis and Living Cells © 2006 Brooks/Cole - Thomson

Reverse Osmosis Water Desalination Water desalination plant in Tampa © 2006 Brooks/Cole - Thomson

Osmosis Calculating a Molar Mass Dissolve 35. 0 g of hemoglobin in enough water to make 1. 00 L of solution. ∏ measured to be 10. 0 mm Hg at 25 ˚C. Calculate molar mass of hemoglobin. © 2006 Brooks/Cole - Thomson
 Intermolecular forces vs intramolecular forces
 Intermolecular and intramolecular forces
 Intramolecular forces vs intermolecular forces
 Intermolecular forces in water
 Intermolecular forces
 Why intermolecular forces are weaker than intramolecular
 Intramolecular forces
 Intramolecular forces
 Intramolecular vs intermolecular forces
 Intramolecular forces list
 Strength of intermolecular forces
 Vocabulary workshop level d unit 6
 Compared to atoms of metals, atoms of nonmetals generally
 If you studied hard you would have passed the exam
 Much madness is divinest sense paraphrase
 What were the forces holding feudal society together?
 Intramolecular claisen condensation
 Condensation
 Intramolecular vibrational energy redistribution
 Intramolecular interactions
 Williamson ether synthesis
 Strongest intramolecular force
 Amide acid hydrolysis
 6 faces 12 edges
 Why do atoms form bonds? *
 More protons than electrons
 Nf3 lewis
 Which elements have expanded octets
 Metallic bonding occurs between
 Atoms always have
 If you did your homework last night
 Quantitative and qualitative examples
 Sociologist who studied dating patterns
 The most studied group is
 Qualitative vs quantitative
 Have been ving kullanımı
 Natural history of disease is best studied by
 Dugdale
 Dugdale
 We've recently studied the
 The motion of a projectile is often studied in terms of
 Chapter 4 cell theory and cell study
 We've recently studied the
 Requirement analysis case study
 Complementary attraction
 As darwin studied fossils what new questions arose
 Hát kết hợp bộ gõ cơ thể
 Lp html
 Bổ thể
 Tỉ lệ cơ thể trẻ em
 Gấu đi như thế nào
 Tư thế worm breton
 Chúa yêu trần thế
 Các môn thể thao bắt đầu bằng tiếng nhảy
 Thế nào là hệ số cao nhất
 Các châu lục và đại dương trên thế giới
 Cong thức tính động năng
 Trời xanh đây là của chúng ta thể thơ
 Cách giải mật thư tọa độ
 Phép trừ bù
 Phản ứng thế ankan
 Các châu lục và đại dương trên thế giới
 Thơ thất ngôn tứ tuyệt đường luật
 Quá trình desamine hóa có thể tạo ra
 Một số thể thơ truyền thống
 Bàn tay mà dây bẩn
 Vẽ hình chiếu vuông góc của vật thể sau
 Biện pháp chống mỏi cơ
 đặc điểm cơ thể của người tối cổ
 Giọng cùng tên là
 Vẽ hình chiếu đứng bằng cạnh của vật thể
