Harford County Health Department The Health of Harford


 Mission, Vision, and Values Mission To protect, promote, and")


 Robert Neall, Secretary Fran")


 Rates Harford County & Maryland, 2000 -2017 Harford County rates")
")


 84. 9")
 84. 9")
 Edgewood")
 Edgewood")


- Slides: 54
Harford County Health Department The Health of Harford County Russell Moy, MD, MPH, Health Officer June 3, 2019
Health Department Locations 17 120 S. Hays St. , Bel Air 1 N. Main St. , Bel Air 2204 Hanson Rd. , Edgewood 1321 Woodbridge Station Way, Edgewood 2015 Pulaski Hwy, Havre de Grace 2027 Pulaski Hwy, Havre de Grace
Harford County Health Department (HCHD) Mission, Vision, and Values Mission To protect, promote, and improve the health, safety, and environment of Harford County residents. Vision To make Harford County the healthiest community in Maryland. Values Teamwork, Leadership, Collaboration, Integrity, Commitment, Cultural Sensitivity 11
HCHD Services s n o i ict s d e d c i A v s eer c s s i e v S t r a R e s. E ic f A i t r e c h t Bir r on i e t c a n nin Ca o d i r t o o en v C e e r le b a Cpar c ni u s m u CPol m secare aal e t s i n de D cy n e rg e al t m n E e e sm n n o g o p n svir i e n r n E an l p n h y o t l i t a em ca h u Fa d he t l a He 4 ing n n pla lth a e H TI S / HIV mveinsitting te s n reoam o t. H i at z i n u m m I th l a e h th D l a e M e c h n l a a r t u insen M k a e r b n o i t n Out taig a o ti l s u e inovp P tchco l a a n e o b i t a Tho n t o r i t a p ssns n c. Tera o i tr u n WIC
16
Shared Local Public Health Governance Maryland Department of Health (MDH) Robert Neall, Secretary Fran Phillips, Deputy Secretary Maryland Department of Environment (MDE) Administr ative Services 4 Harford County Council (Ex Officio Board of Health) Patrick Vincenti - Council President Andre Johnson, Joseph Woods, Tony Giangiordano, Chad Shrodes Robert Wagner, Curtis Beulah County Health Harford Department Russell Moy, MD, MPH, Health Officer Marcy Austin, Deputy Health Officer Environme ntal Health Family Health Behavioral Health Clinical Health Care Coordinati on
How healthy are Harford County residents? Of Maryland’s 24 jurisdictions, what is Harford County’s 2019 health ranking? (A) # 1 (most healthy) (B) # 7 (C) # 10 (D) # 16 (E) # 24 (least healthy)
RWJF’s County Health Rankings Methodology HEALTH FACTORS - Health Behaviors 30% Clinical Care 20% Socio-Economic 40% Physical Environment 10%
2019 County Health Rankings: By Maryland Jurisdiction
Health Indicators Harford County Maryla nd Top U. S. Performers HARFORD COUNTY DOING BETTER Infant mortality (per 1 k) 4 7 4 Teen births (per 1 k) 11 19 14 5 7 6 Uninsured (%) HARFORD COUNTY DOING WORSE Drug overdose deaths (per 100 k) 34 31 10 Adult smoking (%) 15 14 14 Adult obesity (%) 30 30 26 Poor mental health days 3. 6 3. 5 3. 0 Source: RWJF County Health Rankings
Impact of the Overdose Crisis
Drug & Alcohol Intoxication Deaths By place of occurrence, Harford County, 2013 -2017* Number of Deaths All Drugs/Alcohol Heroin t s a p e ver th o e s a e cr n i % s 0 18 5 year 36 2013 43 2014 Fentanyl 101* 84 50 2015 2016 2017* Source: Maryland Vital Statistics: Drug- and Alcohol-Related Intoxication Deaths in Maryland, 2016 * 2017 estimates based on 3 quarters of 2017 data, Maryland Vital Statistics 12
Opioid-Related Overdose Deaths # of Opioid-Related Deaths Harford County, 2009 -2018* 100 90 80 70 60 50 40 30 20 10 0 Harford rate down 3. 2%, while MD rate up 5. 2% over the past 1 year. 38 28 28 32 34 93 90 76 38 45 2009 2010 2011 2012 2013 2014 2015 2016 2017 2018 Year 13
Harford County has the 9 th worst death rate for opioid overdose deaths in Maryland.
Fentanyl is the primary overdose killer 15
Harford Crisis Center – Phase 2 Opening June 2019 410 -874 -0711 – 1 -800 -NEXT-STEP 16
17
Why Do We Need a Behavioral Health Crisis Center? MY LOVED ONE NEEDS HELP NOW IS THIS AN NOT SURE OR EMERGENCY? YES NO CALL 911 Call 24/7 Harford Crisis Center -Crisis worker will ask questions talk you through 410 -874 -0711 or and 1 -800 NEXT-STEP the situation. -If needed, a Mobile Crisis Worker will meet you where you are. -If needed, you can come in to the Walk-In Center 24/7 for help. -If needed, you can stay for stabilization services and observation. -If needed, you may be admitted to a short-term
410 -874 -0711 802 Baltimore Pike, Bel Air, MD 21014 Out Patient Substance Use Treatment Clinic FRONT DOOR
Substance Exposed Newborn (SEN) Rates Harford County & Maryland, 2000 -2017 Harford County rates increased by 185% over the past 10 years. NOTE: ICD 9 Codes used 760. 70, 760. 71. 760. 72, 760. 73, 760. 75, 760. 77, 779. 5 ICD 10 Codes used P 04. 3, P 04. 41, P 04. 49, P 04. 8, P 04. 9, P 96. 1 * 2017 DATA IS PRELIMINARY – Data compiled by MCHB/MDH. Chart prepared by HCHD. Source: HSCRC Hospital Data, 2000 -17, Maryland resident births only, does not include Maryland resident births born out of state. 20
Number NAS per 1, 000 newborns 80 70 Rate of Neonatal Abstinence Syndrome (NAS) births, by jurisdiction of residence, Maryland, 2008 -2017 72. 9 63. 1 60 50 44. 8 41. 7 40 30 20 22. 1 21. 9 19. 6 19. 2 18. 9 18. 4 18. 3 18. 2 18. 1 17. 7 17. 6 17. 0 13. 4 12. 4 11. 5 10. 9 10 0 2008 -2012 2013 -2017* Source: Health Services Cost Review Commission (HSCRC). Data reflect Maryland newborn residents in Maryland hospitals only. NAS based on a diagnosis of the following on the newborn discharge record: ICD-9 779. 5: drug withdrawal syndrome in newborn, or ICD-10 P 96. 1: neonatal withdrawal symptoms from maternal use of drugs of addiction. *Changes in NAS coding from ICD-9 to ICD-10 in October 2015 may have influenced the number of NAS newborns in these years Data suppressed for jurisdictions with less than 11 NAS newborns. ^Rates for 2008 -2012 and 2013 -2017 differ significantly (p<0. 05) 21 5. 4 1. 6 1. 4
Why do some SEN babies develop NAS and others don’t? How can mothers be supported? • • SEN≠NAS. It’s a complex picture. NAS is a lot more than opioid exposure. Smoking cessation. Focus on the modifiable behaviors, in particular, smoking cessation. At least 80% of women with opioid use disorder smoke cigarettes. It’s a great opportunity to talk about smoking cessation, even cutting back cigarettes is beneficial. Breastfeeding. It’s also a great opportunity to talk about breastfeeding and skin-to-skin contact: holding the baby, rooming in if possible, and breastfeeding as ways to reduce the severity and duration of NAS. Continuity of care – through WIC, care coordination, women’s health, and behavioral health services. From: ACOG Update, Volume 43, Edition 5 22
13
MEGAN’s Place: Meaningful Environment to Gather and Nurture What is MEGAN’s Place? • • • 153 A safe, non-judgmental place for at-risk pregnant and postpartum women and their families who need assistance – with information/guidance, resources/services, and care coordination/support – in Harford County. A supportive and restorative place for building family resilience. Evidence-based practices: – Helping Families Recover peer support and wraparound services – Healthy Families America model of home visiting and care coordination
Relationship between untreated substance abuse disorders and suicide Attempt suicide, according to one study
Suicide Mortality Rates Harford County & Maryland, 2013 -2017 Per 100, 000 Population 13 12, 3 11, 6 12 11 10, 7 Harford Maryland 10 9 9, 0 8 2011 -13 9, 2 9, 1 2012 -14 2013 -15 * Age-Adjusted Rates Source: Maryland Vital Statistics Reports 26 11, 6 9, 2 2014 -16 9, 3 2015 -17
U. S. Life Expectancy Has Declined for 3 Years in a Row 153
What is the average life expectancy of a Harford County resident? (a) 84. 9 years (b) 79. 5 years (c) 79. 4 years (d) 76. 8 years (e) 73. 4 years
What is the average life expectancy of a Harford County resident? (a) 84. 9 years – Montgomery County (b) 79. 5 years – Maryland State average (c) 79. 4 years – Harford County (d) 74. 7 years – Cecil County (e) 73. 4 years – Baltimore City Location – Location - Location There’s an 11. 5 year geographic disparity in average life expectancy within Maryland. Source: Maryland Vital Statistics, 2016
Which Harford County zip code area has the highest average life expectancy? (a) Edgewood (b) Aberdeen (c) Havre de Grace (d) Joppa (e) Bel Air
Which Harford County zip code area has the highest average life expectancy? (a) Edgewood – 74. 7 years (b) Aberdeen – 75. 5 years (c) Havre de Grace – 76. 6 years (d) Joppa – 78. 5 years (e) Bel Air – 81. 5 years Source: www. rwjf. org
Average Life Expectancy By Harford County Zip Codes, 2016 Bel Air 21015 Abingdon 21009 Forest Hill 21050 MARYLAND HARFORD COUNTY Fallston 21047 Whiteford 21160 Pylesville 21132 U. S. Joppa 21085 Churchville 21028 Jarrettsville 21084 Belcamp 21017 White Hall 21161 Havre de Grace 21078 Street 21154 Darlington 21034 Aberdeen 21001 Edgewood 21040 81, 5 81, 0 80, 1 79, 5 79, 4 79, 3 78, 9 78, 8 78, 5 78, 4 77, 9 77, 8 77, 1 76, 6 76, 5 76, 3 75, 5 74, 7 74 Source: www. rwjf. org 32 75 76 77 78 79 Average Life Expectancy in Years 80 81 82 83
Leading Causes of Death Harford County, 2017 600 492 # of Deaths 500 nic o r h c om r f e r a hs t a e d t U. . s Mos e s a e dis 481 400 300 200 124 110 101 101 62 54 53 31 33 Source: Maryland Vital Statistics, 2017 Source: * Maryland Drug and Alcohol-Related Intoxication Deaths, 2017 de ici Su za In flu en 's ei m er es Di ab et ts en Ac cid er do se * ke St PD CO er nc Ca ro Ov Al zh He ar t. D ise as e 0
Behavioral Health Conditions Impact Physical Health Conditions
The Leading Actual Underlying Causes of Death l a u t c a ing d a e U. l. e S. h t U s e i g th n i k h o t m a S e d f o e s cau g n i y l r nde u 35 Source: Mokdad et al, “Actual Causes of Death in the U. S. , 2000” JAMA, 3/19/2004
Impact of Tobacco
37
Adult Smoking Rates Harford County & Maryland, 2012 -2016 30 21, 7 Percent 20 16, 9 16, 2 16, 4 10 0 2010 -12 2011 -13 18, 9 16, 7 Harford 14, 6 15, 1 2012 -14 2013 -15 Source: CDC Maryland Behavioral Risk Factor Surveillance System (BRFSS) 38 20, 7 Harford County rates worse than the State. 13, 7 2014 -16 Maryland
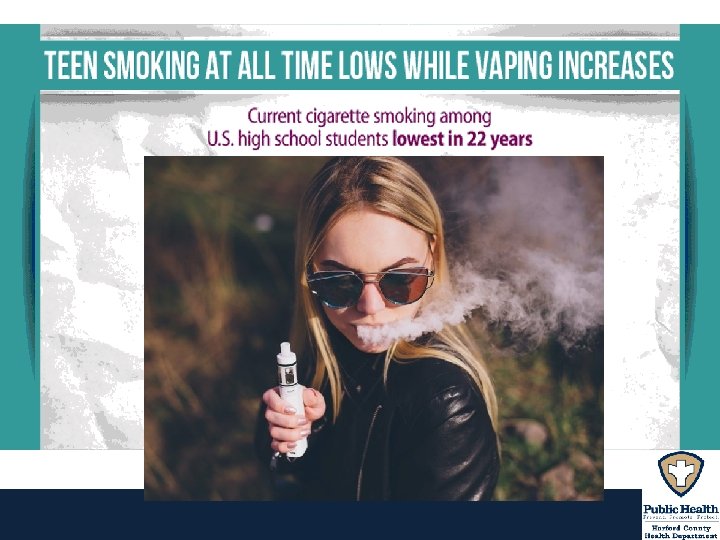
Adolescent Tobacco Use Rates* Harford County & Maryland, 2010 -2016 30 Harford County rates better than the State. 26, 8 23, 0 Percent 20 24, 8 20, 2 16, 9 19, 2 16, 4 14, 9 10 0 2013 2014 Source: Maryland Youth Risk Behavior Survey (YRBS) Note: Students, Gr 9 -12 who smoked at least 1 cigarette in the past 30 days * Data gap between 2010 -2013 and 2014 -2016 39 2016 Harford Maryland
Cancer Mortality Rates Harford County & Maryland, 2013 -2017 Per 100, 000 Population 180 Harford County rates worse than the State. 171 170 169 168 164 166 162 2012 -14 2013 -15 * Age-Adjusted Rates Source: Maryland Vital Statistics Reports 41 157 155 2011 -13 Harford Maryland 159 150 164 2014 -16 2015 -17
Cancer Incidence Rates by Type
Cancer Incidence Rates by Race
COPD Mortality Rates Harford County & Maryland, 2013 -2017 Per 100, 000 Population 50 40 Harford County rates worse than the State. 37 39 37 37 Harford 30 20 33 2011 -13 Maryland 31 31 2012 -14 2013 -15 * Age-Adjusted Rates Source: Maryland Vital Statistics Reports 44 39 30 2014 -16 30 2015 -17
Alzheimer’s Mortality Rates Harford County & Maryland, 2013 -2017 22 Per 100, 000 Population 21 Harford County rates have increased by 19% over past 5 years. 20 18, 8 19 18 17, 1 19, 0 17, 4 Harford 17 16 16, 1 15 14 13 14, 6 2011 -13 14, 3 2012 -14 * Age-Adjusted Rates Source: Maryland Vital Statistics Reports 45 20, 3 17, 0 15, 0 2013 -15 2014 -16 2015 -17 Maryland
Child Maltreatment Rates Harford County & Maryland, 2012 -2016 Rate of Children < Age 18 who are Maltreated Per 1, 000 Population 20 Harford County rate exceeds the State average. 15 14, 1 11, 7 10 10, 2 9, 2 Harford 9, 9 Maryland 7, 3 5 0 2012 2013 Source: Maryland DHR http: //ship. md. networkofcare. org/ph/ship 46 12, 9 2014 2015 6, 6 2016
Domestic Violence Rates Harford County & Maryland, 2012 -2016 Crimes Per 100, 000 Population 600 Harford County rate now exceeds the State average. 510, 9 500 468, 6 456, 8 512, 6 518, 2 Harford 400 384, 8 300 200 Maryland 384, 6 299, 3 239, 3 2012 2013 2014 Source: Maryland Uniform Crime Reporting Program http: //ship. md. networkofcare. org/ph/ship 47 550, 9 2015 2016
Chlamydia Rates Harford County & Maryland, 2013 -2017 700 86% increase over the past 5 years Per 100, 000 Population 600 500 481 300 200 459 173 189 2013 2014 457 280 510 321 552 322 Maryland 100 0 * Age-Adjusted Rates Source: Maryland Vital Statistics Reports 48 Harford 2015 2016 2017
Gonorrhea Rates Harford County & Maryland, 2013 -2017 Per 100, 000 Population 200 282% increase over the past 5 years 181 158 100 101 22 0 2013 102 51 84 62 2014 2015 2016 Harford Maryland 30 * Age-Adjusted Rates Source: Maryland Vital Statistics Reports 49 114 2017
Chlamydia & Gonorrhea Cases by High School Attendance Area, Harford County, 2016 -2017, Ages 15 -19 50
Most Pressing Health Issues
The Measles Epidemic
Vaccines Do Not Cause Autism. Measles Do Cause Deaths.
Thank you! 410 -838 -1500 www. harfordcountyhealth. com