Happiness Research Part I Correlation and Causation Variables

Happiness Research: Part I

Correlation and Causation
 is any category with exclusive and exhaustive subcategories. Examples:")
Variables A variable (for us) is any category with exclusive and exhaustive subcategories. Examples: Marital status = {married, single, divorced, widowed} Income = HKD $[0, ∞)

Correlation Two variables are correlated when the value of one variable gives you information about the value of the other. Examples: Height and weight Smoking and drinking Pets and happiness?

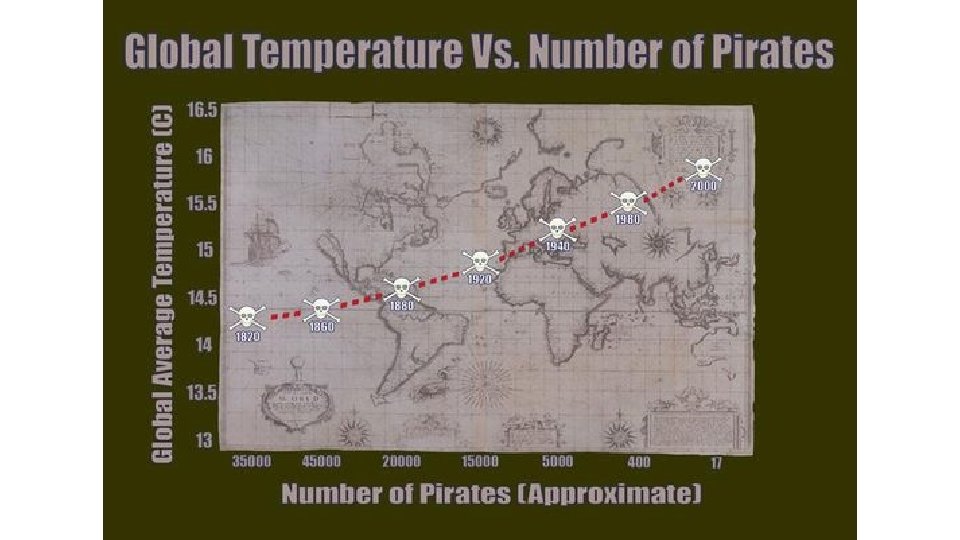
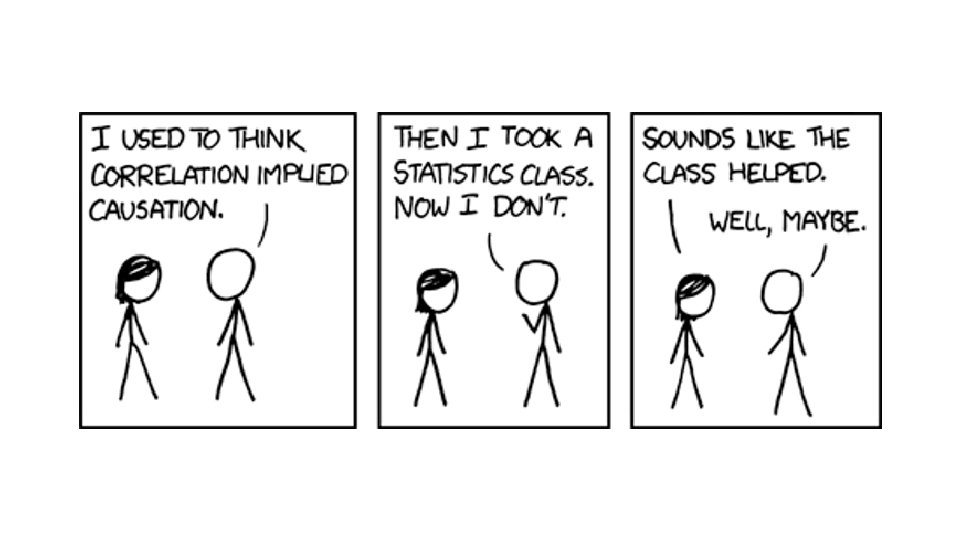
Correlation and Causation When two variables A and B are correlated, there are several possible explanations: • A causes B • B causes A • Another variable C causes A and also C causes B • It’s an accident

Happiness and Marriage For example, suppose you find that marital status and happiness are correlated: married people are more likely to be happy: 1. M causes H 2. H causes M 3. A third variable like income causes H and M 4. It’s an accident
 correlations.")
Accidental Correlation In any data set there will be infinitely many spurious (“accidental”) correlations.

Science

The Scientific Method Science proceeds by the hypothetico-deductive method: 1. 2. 3. 4. Formulate a hypothesis Generate testable predictions Gather data Check predictions against observations
")
The Randomized Controlled Trial (RCT)

Why are double-blind RCTs Gold Standard? • Random sampling & assignment eliminates selection bias • Control group allows you to control for confounds • Blinding ameliorates subject bias • Double blinding eliminates subject and experimenter bias

Selection Bias Example: Philosophy undergraduate students do better on law school applications (in particular, on LSAT).

Random Sampling Unfortunately, too much research is done on undergraduates who are W. E. I. R. D. = Western, Educated, Industrialized, Rich, and Democratic

Confounding Variables Confounding variables are possible “third causes”. Control groups allow you to show these confounds aren’t driving your effects.

Subject Bias & Blinding People want to answer what you want to hear. Solution: don’t tell people what you’re asking, why you’re asking, and lie to them if need be.
 are good at figuring out what")
Double Blinding & Clever Hans People (and horses) are good at figuring out what you want them to say. (Also experimenter bias. )
 by operationalizing. Are")
Operationalization Finally, bias can be eliminated (not without cost to verisimilitude!) by operationalizing. Are people happy with their lives? Ask them to mark it on a 7 -point scale.

Non RCTs There are many reasons not to live up to the gold standard (RCT), mostly falling in two domains: moral and practical
 have a vaccination control group that doesn’t receive vaccinations.")
Moral Reasons You can’t (morally) have a vaccination control group that doesn’t receive vaccinations. That would unnecessarily put people’s– children’s– lives in danger.

Practical Reasons Consider lottery winnings effects on happiness.

Alternative: Observational Studies • Cross-sectional study • Cohort study • Case-control study
. You look at a")
Cross-Sectional Study A cross-sectional study is just a survey (census). You look at a lot of data and find correlations. Pros: lots of data! Cons: mere correlations.
 Study")
Cohort (Longitudinal) Study

Case-Control Study
, one-off studies")
Reviews & Meta-analyses For reasons we saw last time (power, prior probability), one-off studies often tell us very little. For this reason, the empirical literature contains review articles and meta-analyses.

Blobbogram

Happiness, Particularly

Oxford Happiness Inventory http: //www. happiness-survey. com/

Measures of Happiness • Oxford Happiness Inventory • Depression-Happiness Scale • Pemberton Happiness Index • Cantril Ladder • Subjective Happiness Scale • Students’ Life Satisfaction Scale • Temporal Life Satisfaction Scale And so on…
- Slides: 31