Hand in your Scantron ONLY PSYCHSIM CORRELATION DUE
 SHHHHHHH")


 is observed in depth. Used by")
 As a source of insight and ideas")


 will make Pittsford Mendon high school")


 2) 3) 4) 5) 6)")

 Scatterplot is a graph comprised of points that")
 No relationship (0. 00) The Scatterplot on the")


. Use measures of")


- Slides: 87
Hand in your Scantron ONLY PSYCHSIM: CORRELATION DUE TOMORROW Take the Survey (Independntly) SHHHHHHH
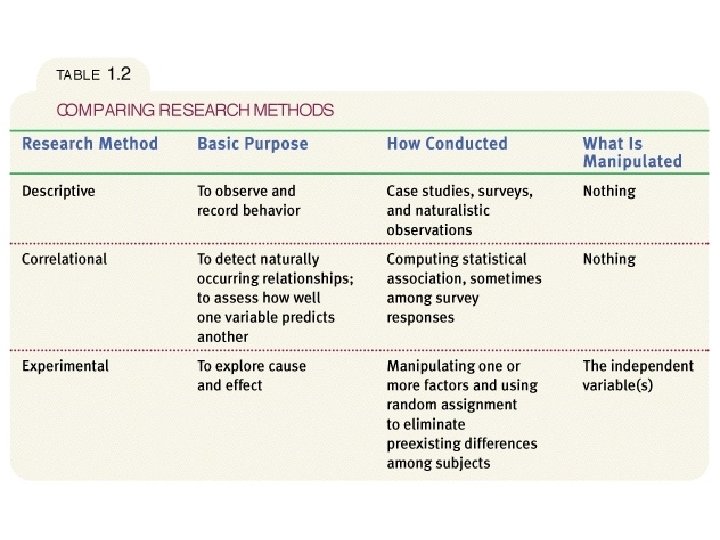
Types of Descriptive Research Naturalistic Observation The Case Study The Survey
Naturalistic Observation Observing and recording behavior in natural environment. No control- just an observer. What are the benefits and detriments of Naturalistic Observation?
Positives Less intrusive than some other research methods Used when intrusive methods might alter the behavior you want to study or create false impressions about it Example: You wanted to study peoples fitness efforts You could ask people to keep track of how often they exercise, but your request might prompt them to suddenly begin working out more than usual, thus providing an inaccurate picture of their typical behavior
Negatives Can not control variables Single causes can be misleading, can not rule out confounding variables Ethics is sometimes a problem Does not explain behavior, describes it
Examples Observing the pace of life in different countries Walking speed, time to complete simple tasks, accuracy of clocks Video taping parent child relationships Recording student self seating patterns in the lunchroom Watching chimps in the wild Apes are capable of murder even for minor incidents
Naturalistic Observation Think of behaviors you could observe In the classroom At the grocery store On the road Things to keep in mind Must try to maintain confidentiality Must be able to repeat observation
Operationalization To clarify for replication.
The Case Study Where one person (or situation) is observed in depth. Used by Freud What are the strengths and weaknesses of using a tragedy like the Columbine School Shootings as a case study?
Four uses of Case Study 1. ) As a source of insight and ideas 2. ) Used to describe rare or unusual phenomenon 3. ) For psychobiographies where application of psychological concepts takes place in an effort to understand the ideas of famous people 4. ) To provide illustrative anecdotesconcrete examples of abstract concepts or principles
Examples Man with perfect memory Much early knowledge of the Brain comes from case studies Can suggest future hypothesis for study Synesthesia
Negatives Can be unrepresentative Dramatic stories & personal experiences have a way of overwhelming general truths Can be very misleading Bias is likely because of how close the research gets with the subject(s)
The Survey Method Used in both descriptional and correlational research. Use Interview, mail, phone, internet etc… Have you ever taken a survey?
The Survey Method Take a moment and answer this survey Agree or disagree with the following statements. 1. I oppose raising taxes. 2. I see the value in affirmative action. 3. I value our countries humanitarian efforts. 4. I understand not allowing facebook access during school. 5. I never lie. 6. I am in support of high school athletics. 7. I support aid for the needy. 8. I oppose welfare programs. 9. I am against preferential treatment. 10. I agree with forbidding social networking sites in education. 11. I consider myself a nice person who thinks of others feelings. 12. I oppose continued U. S. foreign aid.
Go over Survey
The Survey Method Take a moment and answer this survey Is the Mississippi River Longer or Shorter than 500 miles? How long is it? 2348 Is the population of Argentina greater or smaller than 2 million? What is the population? 36 million Was the average on the first quiz greater or smaller than 45% What was the class average on the first quiz? 76%
The Survey Method Take a moment and answer this survey Is the Mississippi River Longer or Shorter than 500 miles? How long is it? Is the population of Argentina greater or smaller than 2 million? What is the population? Was the average on the first quiz greater or smaller than 45% What was the class average on the first quiz?
The Survey Method Take a moment and answer this survey Is the Mississippi River Longer or Shorter than 300 miles? How long is it? Is the population of Argentina greater or smaller than 100 million? What is the population? Was the average on the first quiz greater or smaller than 81% What was the class average on the first quiz?
Survey Method: The Bad Low Response Rate People Lie or just misinterpret themselves. Social Desirability Bias People tend to answer with what they think is the right answer instead of the honest answer. Wording Effects - leading questions How accurate would a survey be about the frequency of having to use a plunger?
The Survey Method What is good about a survey? cheap, anonymous, diverse population, and easy to get random sampling a sampling that represents your population you want to study
Why do we sample? One reason is the False Consensus Effect: the tendency to overestimate the extent to which others share our beliefs and behaviors. We tend to hang out with people that think the same way we do.
What would probably be used 1. Wanted to study what bears do during hibernation 2. Wanted to study how winning the lottery could change relationships 3. Wanted to study NY states perception of which NFL football team would win the Super Bowl. 4. Wanted to study children’s play interactions in the sandbox. 5. Wanted to study peoples opinions on building Renaissance Square 6. Wanted to study how parents cope when they have had a missing child NO CS S NO S CS
Conducting Psychology Experiments
IV versus DV If you are a girl then you are more likely to participate in class. If you are old then you are more likely to be patient when waiting in line. If you are an underclassman then you are more likely to be considerate If you are in a large car then you are more likely to follow the rules of the road. If you are alone you are more likely to check your phone
Experimental Research Explores cause and effect relationships.
Steps in Designing an Experiment 1. 2. 3. 4. 5. 6. 7. 8. 9. 10. Hypothesis Pick Population: Random Selection then Random Assignment. Operationalize the Variables Identify Independent and Dependent Variables. Look for Confounding Variables Type of Experiment: Blind, Double Blind etc. . Gather Data Analyze Results Replicate Form conclusions
Hypothesis Scientific method Hypothesis formulation: a statement making a prediction about something, must be falsifiable- written in a way that someone could prove it untrue =
Operationalization: to put an experiment into a form that allows researchers to test the hypothesis- to clarify for replication.
Shoes Women have 50% more shoes than men. Lets test it.
Defining Variables Independent variable: the variable that researchers control Follows the if. We think it makes a difference. Independent variable Dependent variable: the variable that researchers are studying Follows then. Dependent variable
Practice 1. Mario studied how far room temperature water would spurt out of a plastic milk carton when 3 mm holes were punched at different heights from the bottom of the container. Identify the dependent variable. 2. Nick wanted to see how high an ice cube would float in different temperatures of water. Identify the independent variable 3. Tiffany was investigating how fast it took Hayden to react to different sounds. Identify the dependent variable. 4. Mrs. Crain wanted to see how different types of music affected students' pulse rates. She played different types of music: heavy metal, rap, R&B, alternative, pop, country, and classical music. Identify the independent variable.
Other factors that might compromise or complicate the experiment Experimenter Subject Bias
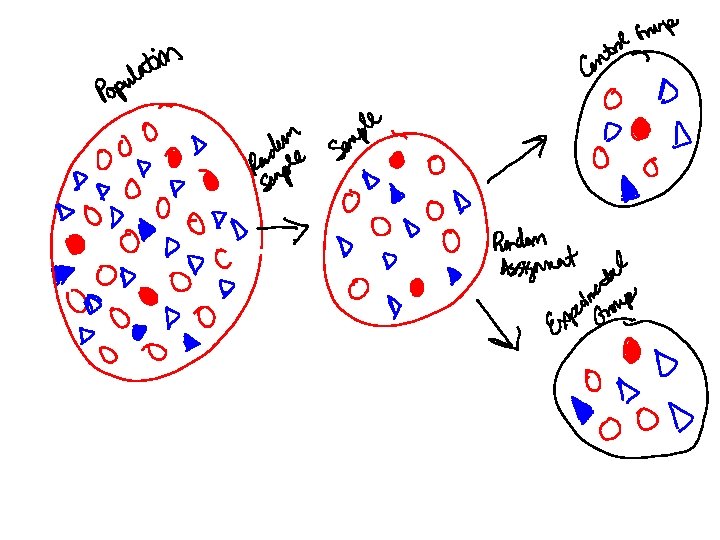
Gathering Subjects Identify Population- larger group that you plan to generalize your findings on
Gathering Subjects Gather a random Sample - taken from the population that represents the population
Gathering Subjects Randomly assign subjects to control group- group that does not receive the independent variable and experimental group- group that receives the ind. Variable
If students take Aspirin they will have better memories. Control Group takes a sugar pill Called a placebo Experimental Group takes an actual Aspirin If the subjects do not know if they are taking an Aspirin or a sugar pill this is a blind study If the subjects and the researchers collecting the data do not know during the experiment than this is a double blind study
Placebo Effect Placebo Effect: a measurable, observable, or felt improvement not attributable to the actual treatment (independent variable)
Experimenting, Recording Results, Conclusion Conducting the experiment Drawing conclusions does cause Recording the results
Confounding variables- confusing variables that may be responsible for the experiments results Reliability- can the experiment be performed over and produce the same/similar results Validity- does the experiment actually measure what it set out to measure SCARY = ? What makes a movie scary? What else might cause nightmares? How can we tell if a child has had a nightmare?
Replication and Theory Development Replication Theory developme nt Experiment 1 results Experiment 2 results Experiment 3 results THEORY: = =
Correlation vs. Causation Correlation versus causation: just because two things are related doesn’t mean one thing caused the other Just because happened and then doesn’t necessarily mean that caused happened
Research Process
Theory A Theory is an explanation that integrates principles and organizes and predicts behavior or events. For example, low self-esteem contributes to depression.
Experimental Vocabulary Operationalize: to clarify and define for purposes of replication. Independent Variable: factor that is manipulated Dependent Variable: factor that is measured Confounding Variables: factors that effect DV, that are not IV. Experimental Group: Group exposed to IV Control Group: Group not exposed to IV Placebo: inert substance that is in place of IV in Control Group Blind Study: Subjects do not know whether they were given the IV or a placebo. Double Blind: Subjects and experimenters conducting the data do not know whether subjects were given the IV or the placebo.
People who earn a lot of money have fewer children than people who earn less money. Peanut Butter and Jelly Sandwiches makes young boys dance uncontrollably. A multicultural education curriculum will raise graduation rates in diverse, urban districts.
I think my new drug (Drug W) will make Pittsford Mendon high school students smarter. Create a hypothesis Operationally define variables Identify the independent and dependent variable Choose your subjects and design an experiment that has the lowest level of bias. Make sure to use the words population, random sample, random assignment, control group, experimental group, placebo, blind/double blind.
Proverbs Identify the underlying theory Generate a testable hypothesis Suggest a design to test the hypothesis Grass is always greener on the other side
Example Theory implies that: People always want what others have Hypothesis: Children will rate toys that were given to them lower than toys given to other children. Randomly distribute toys to a group of children have them rate their toy and the toys of others.
ETHICS Anonymity Privacy Safe
Correlational Research Detects relationships between variables. Does NOT say that one variable causes another. There is a positive correlation between ice cream and shark attacks. Does that mean that ice cream causes shark attacks?
Pick one and try A letter takes three times as long to write as to say. People with Arthritis can tell when it is going to rain. Absence makes the heart grow fonder. What goes around comes around. Do not change your first guess on a multiple choice test when looking over answers. A chain is no stronger than its weakest link
Measured using a correlation coefficient. A statistical measure of the extent to which two factors relate to one another
Which of the following has the strongest relationship? 1) 2) 3) 4) 5) 6) . 5 -. 98 -. 75. 005
How to Read a Correlation Coefficient
Scatterplots Perfect positive correlation (+1. 00) Scatterplot is a graph comprised of points that are generated by values of two variables. The slope of the points depicts the direction, while the amount of scatter depicts the strength of the relationship.
Scatterplots Perfect negative correlation (-1. 00) No relationship (0. 00) The Scatterplot on the left shows a negative correlation, while the on the right shows no relationship between the two variables.
Correlational Research Correlation is the relationship between two variables. Positive correlation – both values increase Negative correlation – One variable increases, while the other decreases. Correlational Coefficient – strength of the relationship 0= no relationship +1 or – 1 = perfect relationship Examples: SAT scores and success in college; Red wine and heart attacks; Prejudice and age; length of marriage and hair loss, etc.
Scatterplot The Scatterplot below shows the relationship between height and temperament in people. There is a moderate positive correlation of +0. 63.
Correlation and Causation or
Order in Random Events Given random data, we look for order and meaningful patterns. Are your chances better for getting dealt hand A or B? Your chances of being dealt either of these hands is precisely the same: 1 in 2, 598, 960.
Order in Random Events Given large numbers of random outcomes, a few are likely to express order. Angelo and Maria Gallina won two California lottery games on the same day.
Illusory Correlation The perception of a relationship where no relationship actually exists. Parents conceive children after adoption. Do not conceive Adopt Confirming evidence Disconfirming evidence Do not adopt Disconfirming evidence Confirming evidence Michael Newman Jr. / Photo Edit Conceive
What do each of these show? The bigger they are, the harder they fall. The more you save, the less you spend.
Descriptive Statistices
Analyze Results Use measures of central tendency (mean, median and mode). Use measures of variation (range and standard deviation).
Measures of Central Tendency Single score that represents a whole set of scores Mode Mean Median
Mode Simplest Most frequently occurring score in a data set 40, 67, 72, 76, 83, 83, 88, 93, 98 What is the Mode? 83
When the Mode does not tell the whole story Scores: 55, 55, 81, 85, 90, 91, 92, 93, 94, 95, 98, 100 Why does the Mode misrepresent our data?
Mean Most reported measure of central tendency The average of a data set Total sum of all of the scores/divided by the number of scores Mean is most accurate when there is least variation (range).
Good/Bad Test Scores 65, 70, 73, 82, 85, 89, 94 Mean = 80 Income 100, 000, 60, 000, 75, 000, 80, 000, 000. Mean = 1, 663, 000 8,
Median The midpoint or 50 th percentile Arrange all data from highest to lowest Find Center Incomes 100, 000, 60, 000, 75, 000, 80, 000, 000. 8,
A Skewed Distribution Are the results positively or negatively skewed?
MEASURES OF VARIATION Range- the gap between the lowest and highest scores Standard Deviation- whether scores are packed together or dispersed
Standard Deviation The standard deviation is kind of the "mean of the mean, " Can help you find the story behind the data. To understand this concept, it can help to learn about what statisticians call normal distribution of data.
The standard deviation is a statistic that tells you how tightly data are clustered around the mean. When the sizes are tightly clustered and the distribution curve is steep, the standard deviation is small. When the sizes are spread apart and the distribution curve is relatively flat, that tells you that there is a relatively large standard deviation.
But let me show you graphically what a standard deviation represents. . .
One standard deviation away from the mean in either direction on the horizontal axis (the red area on the below graph) accounts for somewhere around 68 percent of the people in this group. Two standard deviations away from the mean (the red and green areas) account for roughly 95 percent of the people. And three standard deviations (the red, green and blue areas) account for about 99 percent of the people.
Computing Compute the mean for the data set. Compute the deviation by subtracting the mean from each value. Square each individual deviation. Add up the squared deviations. Divide by one less than the sample size. Take the square root.
Practice Questions Amy’s SAT score is in the 99 th percentile. (Remember SAT scores have a mean of 1100 and a standard deviation of 160. Of the following, which score is closest to this? A) 950 B) 1100 C) 1580 D) 1400 E) 1260
Question 2 In a normal distribution of scores with a mean of 82 and a standard deviation of 7, what percentage of people would score above 68? A) 85% B) 27% C) 75% D) 94% E) 99%
Replication and Theory Development Replication Theory developme nt Experiment 1 results Experiment 2 results Experiment 3 results THEORY: = =
Research Process
Theory A Theory is an explanation that integrates principles and organizes and predicts behavior or events. For example, low self-esteem contributes to depression.
Review of Experimentation If Pittsford Mendon High School students take Advil then it will perform better on cognitive tasks. Identify the independent variable. Identify the dependent variable. Identify something that has to be operationally defined. Design an experiment based on this hypothesis and be sure to use the following terms: Population, Random Sample, Random Assignment, Control Group, Experimental Group, Placebo, Double Blind Study
Independent Variable Advil Dependent Variable Performance on Cognitive Tasks Cognitive Task- speed of putting together a puzzle To get a random sample you could choose every third person from your population to participate in the experiment. This would eliminate sampling bias. Once your subjects were picked now you must use random assignment into control group and experimental group. The Experimental group will be given the Advil the Control group will be given a placebo (sugar pill). A half an hour after consumption of the drug or placebo the subjects will be timed on the completion of a puzzle. To eliminate experimenter bias and reduce the placebo effect, subjects will not know whether they have been given the placebo or the IV. The researchers timing the students on the cognitive tasks will not know either.