Habitat suitability and availability for rainbow trout Oncorhynchus

Habitat suitability and availability for rainbow trout Oncorhynchus mykiss in the Canyon Reservoir tailrace Greg Cummings

Habitat Study Objectives • Develop hydraulic models by integrating river features • Assess changes in rainbow trout habitat suitability and availability with flow • Provide recommendations for flow and habitat restoration
 •")
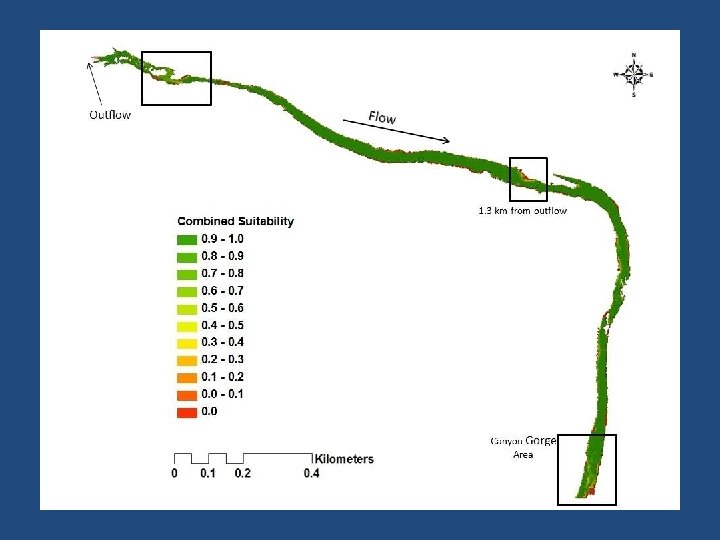
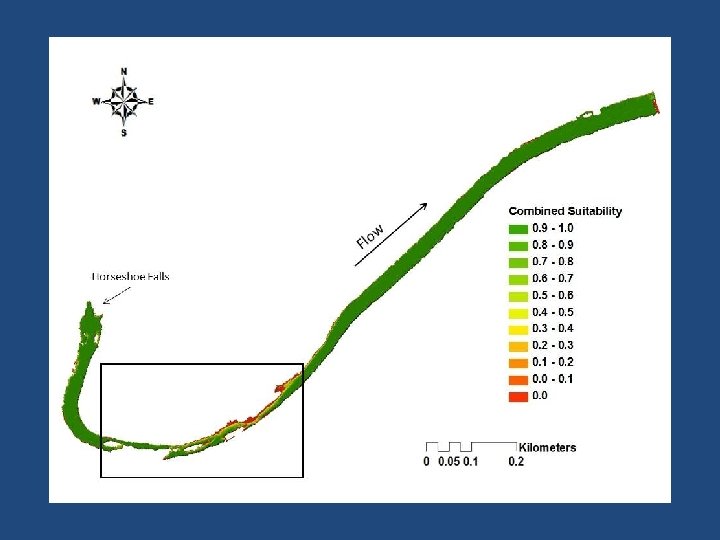
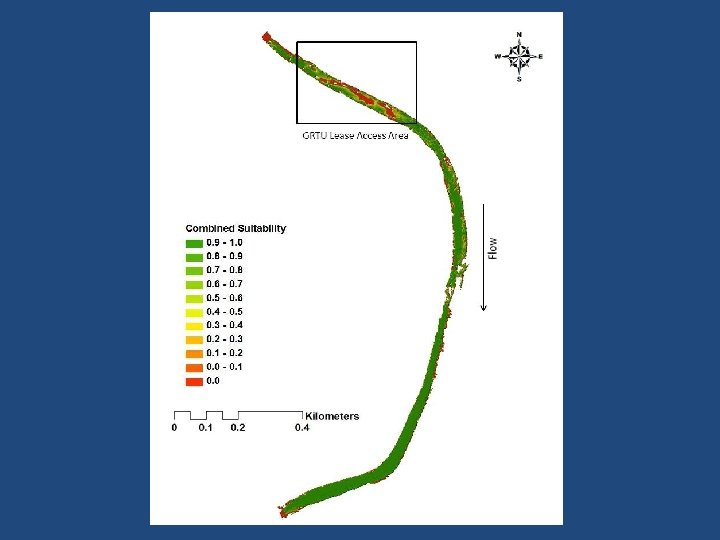
Study Area • 10. 5 miles below dam • Extensive pool habitat (75%) • Dominant substrate is bedrock (61%) • 3 study sections • Each approx. 1 mile long
 – Process to evaluate the effects of")
Methods • Physical Habitat Simulation System (PHABSIM) – Process to evaluate the effects of flow manipulation on riverine habitats – Based on habitat suitability criteria (HSC) for rainbow trout – Hydraulic modeling used to assess habitat quality and quantity at various flows

Methods • Habitat Suitability Criteria – Literature sources and field collection – Collected for spawning, juvenile, and adult rainbow trout – Depth, velocity, and substrate

Methods • Habitat Mapping – Traditional surveying – Bathymetric surveying – Side scan sonar – LIDAR (Light Detection and Ranging) – Aerial photography – GIS

Methods • Hydraulic modeling – Topography, substrate, water surface elevations – Depth and velocity modeled at chosen discharge rates – Based on flow agreements, permits, and model construction Flow Rate (cfs) Flow Rate (cms) 20 0. 57 40 1. 13 60 1. 70 80 2. 27 100 2. 83 120 3. 40 140 3. 96 160 4. 53 180 5. 10 200 5. 66 240 6. 80 260 7. 36 340 9. 63 400 11. 33 470 13. 31 580 16. 43 800 22. 66

Results 1. 0 0. 9 0. 8 0. 7 0. 6 0. 5 0. 4 0. 3 0. 2 0. 1 0. 0 4. 0 0. 2 0. 4 0. 6 Velocity (m/s) 0. 8 1. 0 Substrate LWD Vegetation Bedrock Boulder Cobble Large Gravel 1. 0 0. 9 0. 8 0. 7 0. 6 0. 5 0. 4 0. 3 0. 2 0. 1 0. 0 Small Gravel 3. 0 Sand 2. 0 Depth (m) Clay/Silt 1. 0 Suitability Index 0. 0 Organic Matter Suitability Index • HSC for telemetry study

Results • HSC envelope curves for depth 1. 0 0. 9 0. 8 Suitability Index 0. 7 0. 6 Spawning 0. 5 Juvenile 0. 4 Adult 0. 3 0. 2 0. 1 0. 0 0. 5 1. 0 1. 5 Depth (m) 2. 0 2. 5 3. 0

Results • HSC envelope curves for velocity 1. 0 0. 9 Suitability Index 0. 8 0. 7 0. 6 Spawning 0. 5 0. 4 Juvenile 0. 3 Adult 0. 2 0. 1 0. 0 0. 5 1. 0 Velocity (m/s) 1. 5 2. 0

Results • HSC envelope curves for substrate 1. 0 0. 9 0. 8 Suitability Index 0. 7 Spawning 0. 6 Juvenile 0. 5 0. 4 Adult 0. 3 0. 2 0. 1 D tio ta ge Ve Substrate LW n k oc dr ul Bo Be de r le bb Co l ge La r ra l. G al Sm Gr ve av e l nd Sa ilt /S ay Cl Or ga ni c. M at te r 0. 0
 80% 50% Adult 20% 250000 Area")
Results • Overall Habitat Quantity and Quality (Adults) 80% 50% Adult 20% 250000 Area (m 2) 200000 Poor 150000 Fair 100000 Good 50000 0 0. 00 5. 00 10. 00 15. 00 Discharge (cms) 20. 00 25. 00

Results • Overall optimal habitat 80% 50% 20% 100. 00 90. 00 % of Stream Area 80. 00 70. 00 60. 00 Spawning 50. 00 Juvenile 40. 00 Adult 30. 00 20. 00 10. 00 5. 00 10. 00 15. 00 Discharge (cms) 20. 00 25. 00
 0. 57 1. 13 1. 70 2.")
Results Adult Trout Habitat/Flow Statistics Discharge (cms) 0. 57 1. 13 1. 70 2. 27 2. 83 3. 40 3. 96 4. 53 5. 10 5. 66 6. 80 7. 36 9. 63 11. 33 13. 31 16. 43 22. 66 Discharge (cfs) 20 40 60 80 100 120 140 160 180 200 240 260 340 400 470 580 800 WUA (m 2) 162592. 14 175245. 75 189118. 49 197099. 81 203389. 15 208369. 82 212550. 08 215880. 52 218463. 67 220418. 65 224216. 41 226023. 31 231216. 71 233588. 33 235614. 07 236693. 42 233232. 61 % Max WUA 68. 69 74. 04 79. 90 83. 27 85. 93 88. 03 89. 80 91. 21 92. 30 93. 12 94. 73 95. 49 97. 69 98. 69 99. 54 100. 00 98. 54 Optimal Habitat (m 2) 146263. 71 160744. 81 175113. 86 184435. 85 190607. 12 195968. 02 200953. 29 205179. 50 208537. 49 211098. 12 215940. 97 217902. 30 223475. 81 225733. 90 227398. 31 227288. 59 220755. 68 % of study area 70. 65 72. 82 75. 47 77. 75 78. 43 79. 43 80. 34 80. 99 81. 17 81. 20 81. 56 81. 43 81. 24 80. 93 80. 50 79. 37 75. 43

Discussion • Adult trout habitat – Current flow agreement provides 90% maximum WUA and 80% optimal habitat in the study area – Habitat not likely the main limiting factor for survival although some improvements can be made – Most areas that were unsuitable for adult trout at low flows (<80 cfs) were due to insufficient depth (<0. 2 m)

Discussion • Temperature Dam – Likely main limiting factor for adult trout survival – From the dam to WWS, temperatures rarely exceed tolerance limits – At Ponderosa Crossing temperatures sometimes exceed tolerance limits – Beyond 3 rd Crossing temperatures frequently exceed tolerance limits WWS Ponderosa 3 rd Crossing

Discussion • Flow agreement limitations – Reliance on Canyon Reservoir water level – Intermittent nature of prescribed flows Even with prescribed flows water temperatures beyond Ponderosa Crossing exceed tolerance limits

Flow Recommendations • Discharge rate of 140 cfs could be considered a minimum threshold for habitat • 20 cfs could be considered a critical minimum flow rate during drought • 470 cfs would maximize optimal habitat. However, unlikely to be maintained and can prevent wading • Discharges higher than 470 cfs reduce optimal habitat due to unsuitable velocities for adult trout

Habitat Enhancement • Proper assessment, planning, and preparation • Instream cover and structures to increase depth could improve habitat suitability

Habitat Enhancement • Riparian enhancement could stabilize streambanks, while increasing shading, nutrients, macroinvertebrate habitat, and overhead cover for fish

Habitat Enhancement • Monitoring and maintenance • Cooperation with landowners and river authorities • Consultation with stream restoration experts and other cooperators

Thesis Committee • Thomas B. Hardy, Ph. D. – Chief Science Officer, Meadows Center for Water and the Environment – Department of Biology, Texas State University • Adam J. Kaeser, Ph. D. – Aquatic Ecologist, U. S. Fish and Wildlife Service • Timothy H. Bonner, Ph. D. – Department of Biology, Texas State University

Acknowledgements
- Slides: 26