
HABITAT MONITORING With Sensor Networks Robert Szewczyk Eric
HABITAT MONITORING With Sensor Networks Robert Szewczyk, Eric Osterwell, Joseph Polastre, Michael Hamilton, Alan Mainwaring, Deborah Estrin COMMUNICATION OF THE ACM June 2004/Vol. 47, No. 6 Reporter: Jing-Shiuan Hua Date: 2005/05/24
Outline • • • Introduction Habitat Monitoring Network Architecture Sought-After Advances Conclusion
Introduction(1/2) • In the past – the study of micro-climate and habitat utilization have been largely observational. – climatic and behavioral variables being extrapolated from a few or even individual measurement sites.
Introduction(2/2) • Today – densely deployed sensor networks are • being scaled to the size of the organisms under study , • sampling phenomena at frequencies the organisms encounter, • dispersed in patterns that capture the full range of environmental exposures. provide the fine-grain information needed for accurate modeling and prediction.

Habitat Monitoring(1/2) • Microclimate can be defined as the climate close to surfaces, upon and beneath soils, under snow, or in water, on living things (such as trees), or even on individual animals. • Organisms do not experience the average climate but a specific microclimate on a scale proportional to their size.

Habitat Monitoring 2/2) • The ecologist who relies on extrapolations from a few measurements at sites removed from the actual location of the study species risks failing to accurately measure the degree of microenvironmental variance that organisms experience. • Better understanding of population dynamics, mortality factors, and habitat needs will come only if scientists scale their data collections to match the full range of an organism’s activities. Sensor Networks can scale to the size of the organisms!!
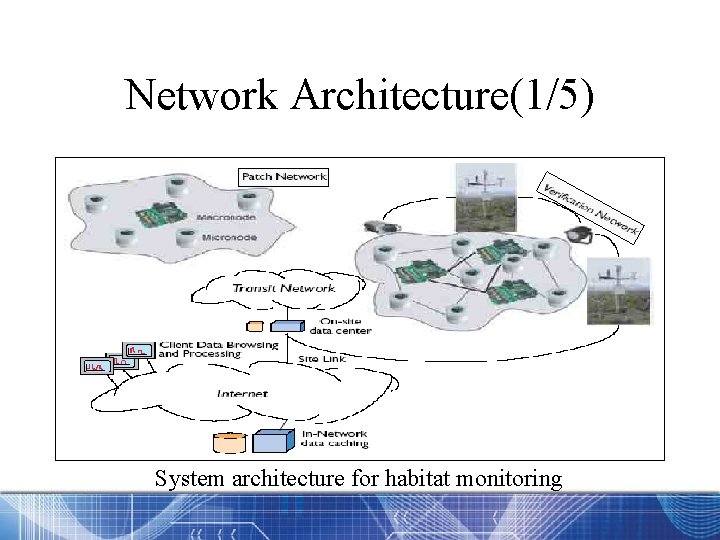
Network Architecture(1/5) System architecture for habitat monitoring

Network Architecture(2/5) • Sensor Nodes – Micronode A typical macrosensor offers at least 10 times the capability—in terms of memory, processing, and communication bandwidth — of a micronode. • A typical micronode is built around a low-power microcontroller running at a few MIPS with a few kilobytes of RAM. – Microsensor • Sensing elements take the form of a probe connected to a general-purpose signal-acquisition board or are integrated into the packaging with microcontroller and wireless transmitter.
Network Architecture(3/5) • Routing tree – All nodes in a patch form a routing tree that is used to disseminate control information and collect and process biological data. – The routing tree’s root gateway node, which provides access to the transit network.
Network Architecture(4/5) • Verification Network – The data produced by the sensor network gains scientific validity through a process of verification and corroboration. – The application component responsible for collecting these independent readings. – needs to provide the data quickly, so scientists can adjust the function (such as detection thresholds and sampling rates) of the sensor patch, eliminate faulty sensors, and perform maintenance.

Network Architecture(5/5) • Habitat-monitoring applications consist of multiple software component implementing core system service. – Routing • Require ways to specify and deliver data of interest, they need a routing service. – Duty cycling • Long-term operation dictates that the system operate in low-power mode. – Network health monitoring • trust the incoming measurements • ensure the network’s performance and longevity
Routing(1/3) • The routing service delivers the queries to the sensor nodes and reports the data of interest. • Data – Streaming (such as humidity sampled every five minutes) – triggered (such as when an animal enters the area of interest) • The service copes with poor-quality links and dynamic topology changes.
Routing(2/3) • Each communication pattern poses a different set of routing challenges: – Triggered data low latency – Streaming data efficient use of bandwidth across multiple hops. – Query delivery scalable, reliable dissemination
Routing(3/3) • The query syntax, in particular, has tremendous influence on routing design, defining how to name the data, how often to sample it, and what type of processing to apply to the data stream; these factors in turn profoundly affect routing. • In Tiny Diffusion, the routing infrastructure is aware of data naming.
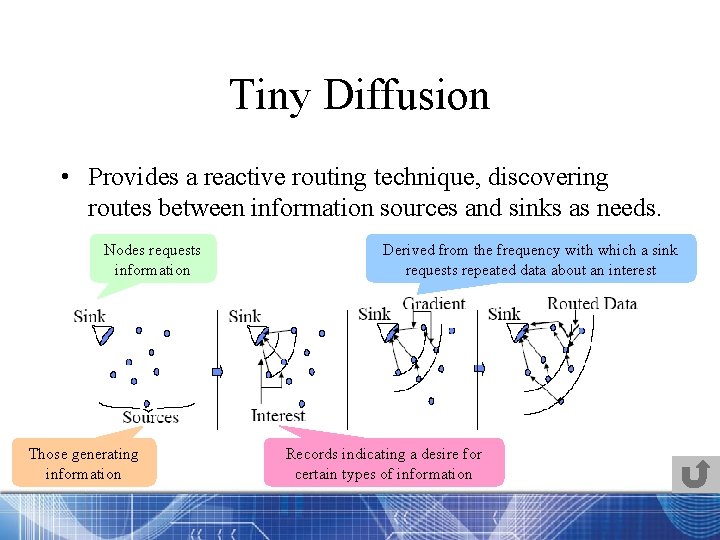
Tiny Diffusion • Provides a reactive routing technique, discovering routes between information sources and sinks as needs. Nodes requests information Those generating information Derived from the frequency with which a sink requests repeated data about an interest Records indicating a desire for certain types of information
Duty cycling • Habitat-monitoring applications operate for months or years at a time with limited-capacity batteries. • A node spends most of its time asleep, then periodically wakes up to sample, compute, and communicate. • The percentage of time each node is awake is known as the node’s duty cycle. • Carrier-sense multiple access (CSMA) B-MAC • Time-division multiple access (TDMA) S-MAC, T-MAC。
Carrier-sense multiple access (CSMA) • Be modified to provide low-duty-cycle operation. • If a node detects incoming energy on the channel, it stays awake to receive the packet. • Because the transmitter might repeatedly send its packet, the receiver must be awake during at least one transmission of the packet—a scheme commonly called low power listening (LPL).
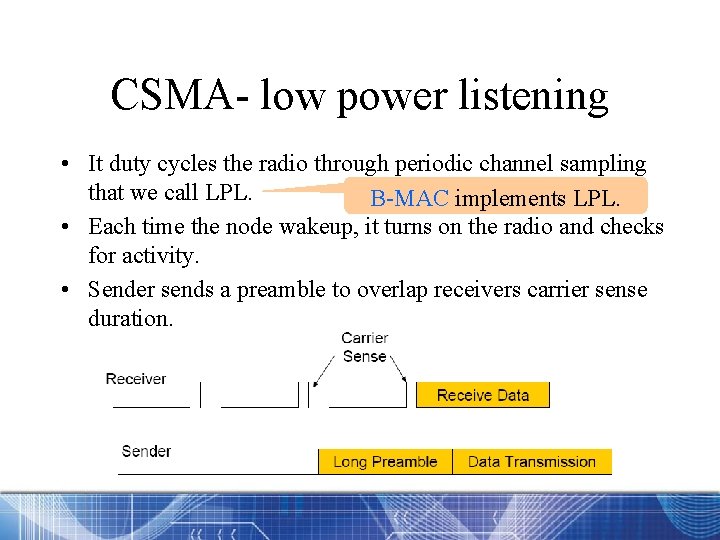
CSMA- low power listening • It duty cycles the radio through periodic channel sampling that we call LPL. B-MAC implements LPL. • Each time the node wakeup, it turns on the radio and checks for activity. • Sender sends a preamble to overlap receivers carrier sense duration.
Time-division multiple access (TDMA) • To achieve low duty cycles, nodes sleep when slots are not assigned. • S-MAC and T-MAC are examples of TDMA schemes optimized for low-duty-cycle sensor network applications. • TDMA is its complexity in multi-hop environments where it requires time synchronization, organization, schedule derivation, and other distributed tasks. • It also exhibits greater latency than CSMA for triggered events.
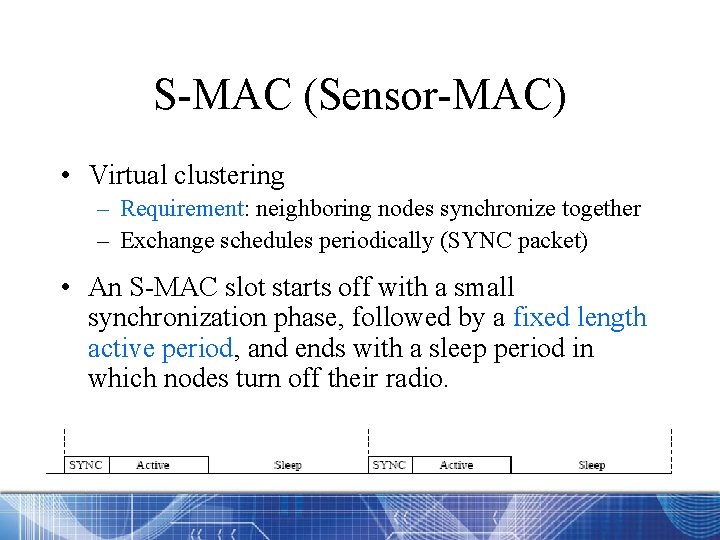
S-MAC (Sensor-MAC) • Virtual clustering – Requirement: neighboring nodes synchronize together – Exchange schedules periodically (SYNC packet) • An S-MAC slot starts off with a small synchronization phase, followed by a fixed length active period, and ends with a sleep period in which nodes turn off their radio.
S-MAC (Sensor-MAC) • Drawbacks of S-MAC – Active (Listen) interval – long enough to handle to highest expected load – If message rate is less – energy is still wasted in idle-listening
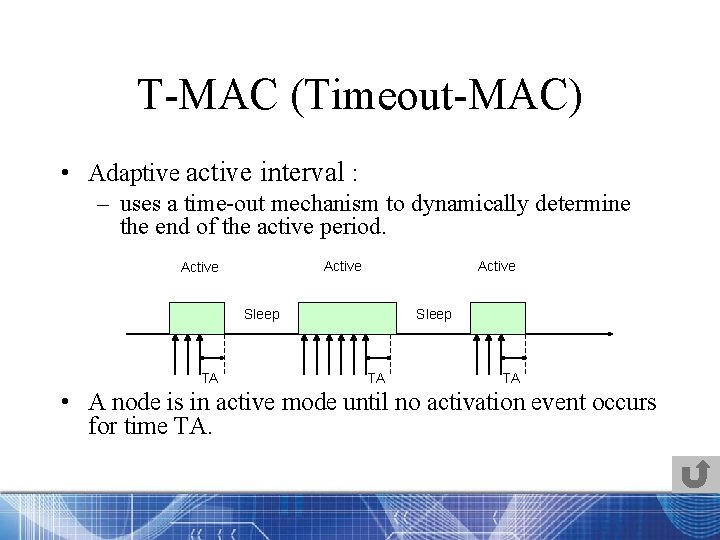
T-MAC (Timeout-MAC) • Adaptive active interval : – uses a time-out mechanism to dynamically determine the end of the active period. Active Sleep TA TA • A node is in active mode until no activation event occurs for time TA.
Network health monitoring • Because sensor nodes operate in exposed environments, they are affected by local environmental conditions. • A health-monitoring service is crucial to – providing performance and status information to remote administrators over the life spans of these systems – allowing users to perform maintenance – estimate the confidence associated with the readings. • The health-monitoring system relies on explicit and implicit signals.
Explicit health signals • Explicit health signals come from sensors dedicated to health measurement and are designed into the system. • Explicit signals can be collected just like any other sensor data.
Implicit health signals(1/2) • Implicit health signals are computed from analysis of available sensor readings. • This analysis can range from a simple threshold (such as the humidity sensor must not give readings below 0% or above 100% relative humidity) to identifying outliers from a complex, multimodal regression.
Implicit health signals(2/2) • Radio and real-time clock can also be treated as sources of health information. • Explicit as well as implicit signals can be used to ensure liveness, or evidence a node’s software is still running, and the connectivity of the network.
Sought-After Advances • A few of the sought-after advances that would enhance future habitat-monitoring networks. • Robust localization • Calibration • Clock synchronization • Data processing
Localization • By virtue of their integration with the physical world, the locations of sensors and actuators represent critical information. • GPS build nodes localize themselves within a few meter’s accuracy by listening to signals emitted by a number of satellites. – Expensive – Difficult to incorporate into every sensor node – Power consumption • Acoustic ranging may require additional infrastructure or may experience reduced accuracies due to obstructions.

Calibration(1/2) • Because sensors quantify physical phenomenon, their readings must be – accurate – accompanied by units of measurement. • When size and scale require network architects to operate on aggregates of devices rather than individual elements, the accuracy and uniformity of measurements must be achieved.
Calibration(2/2) • When sensors are deployed in applications designed to run for years, sensor drift must be measured over time, compensated for when possible, and reported back to health and status systems.

Clock synchronization • Maintaining distributed yet consistent clocks in sensor networks is essential for scheduling events within the system.

Data processing • Due to the highly constrained power and communication resources within sensor networks, pushing computation into individual devices can reduce the energy consumption and volume of the data being communicated. • Compression within and aggregation between devices can reduce the volume of information being communicated.
Conclusion • Networks for monitoring animal behavior might also be adapted for monitoring people. • While biological observation on a small scale may be widely distributed and publicized, the same kind of observation carried out on larger scales reflects policy and legal implications affecting us all. • As the science and technology of habitat-monitoring matures, questions concerning the security, privacy, and social effects of such networks must be addressed.
- Slides: 33