Gulf of Mexico Gray Triggerfish 06 June 2006


")
 • Only used fishery-dependent indices of abundance (Gulfwide) and")


")


- Slides: 40
Gulf of Mexico Gray Triggerfish 06 June 2006 Josh Sladek Nowlis Southeast Fisheries Science Center NOAA Fisheries
Previous Assessment • Aggregated surplus production model. • Convergence problems led to retaining only three fishery-dependent indices and restricting years to 1990 -1998. • Though still poorly resolved, suggested the stock may be overfished and experiencing overfishing.
New Information • Age structure of gray triggerfish catches can now be inferred due to better understanding of their growth patterns as determined by studies of annual rings in their first dorsal spines.
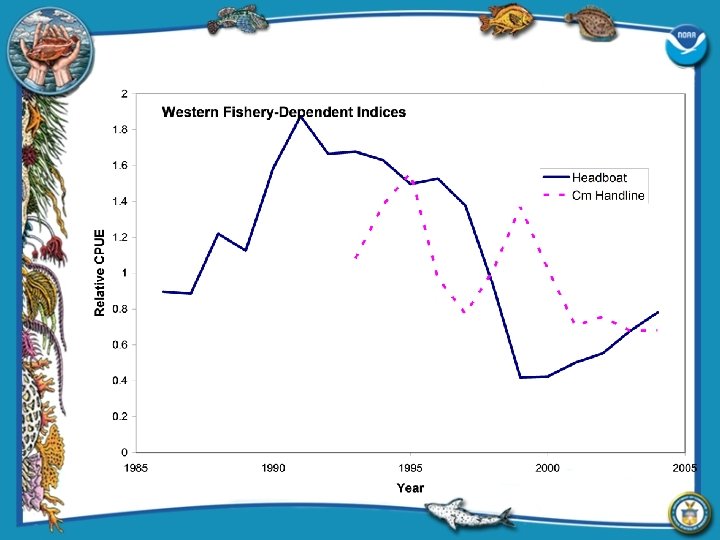
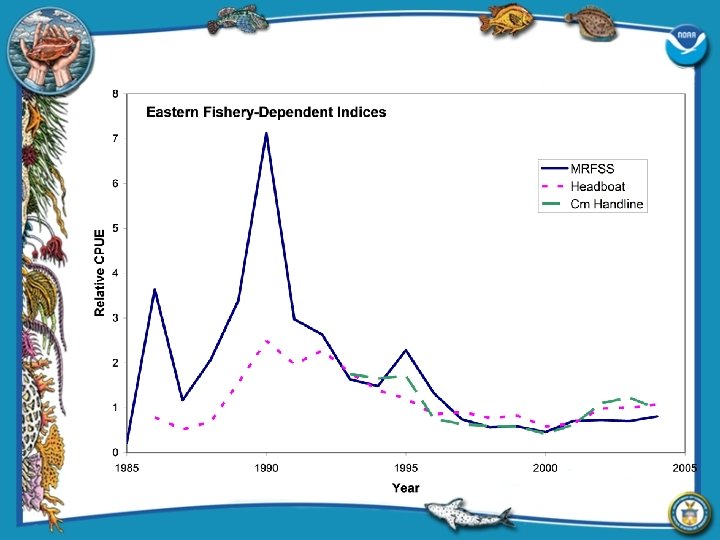
Additional Information • Catch at age information was the primary difference from the previous model. • Catches and fishery-dependent indices split east and west to reflect differences in fishing pressure. • There were also additional years of data added both early and recently in the time series. • Fishery independent indices were available. • Other information (indices, catches) changed little.
Data Inputs
Continuity Case: Aggregated Surplus Production Model (ASPIC)
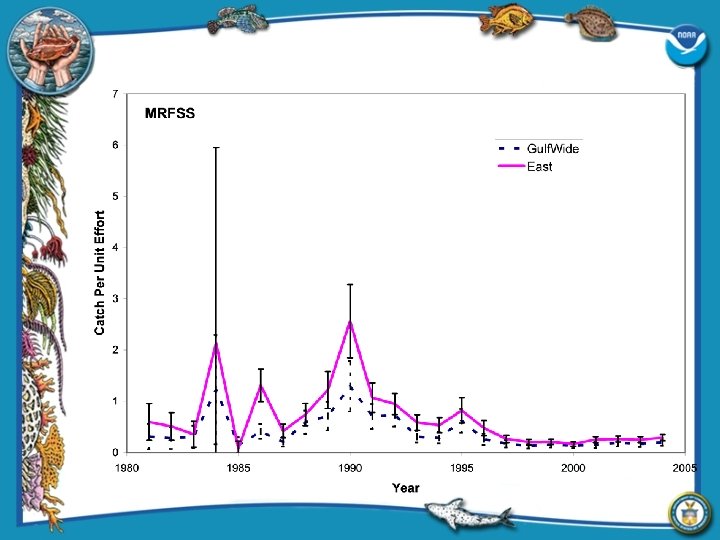
Aggregated Surplus Production Model (ASPIC) • Only used fishery-dependent indices of abundance (Gulfwide) and landings. • Only used data from 1990 -2004. • Tested for convergence by starting estimation procedure at different values.
Unable to Fully Converge: Runs differed only in starting point for estimation procedure
Continuity Case • The additional years didn't make much of a change in the model as evidenced by the continuity case. This model continued to show difficulties in converging, although results suggested the stock was overfished and experiencing overfishing.
Age-Structured Surplus Production Model (SSASPM)
Base Model • Include all indices, equally weighted. • Catch at age weighted with a maximum sample size of 25, with 10 fish required per sample. • Model components weighted by applying multipliers to CVs as follows: – Commercial catch, recreational catch 1988 -2004: 1 – Shrimp catch, recreational catch 1981 -1987: 2 – Indices: 1. 5 • Recruitment deviations penalized using a variance term of 0. 15, equivalent to a 40% CV.
Catch Fits
Index Fits
CAA Fits
Spawning Stock Biomass
Fishing Mortality
Recruitment
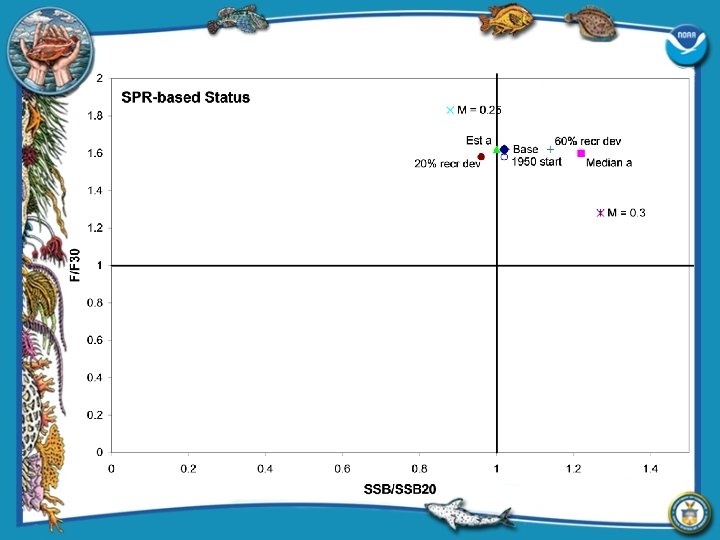
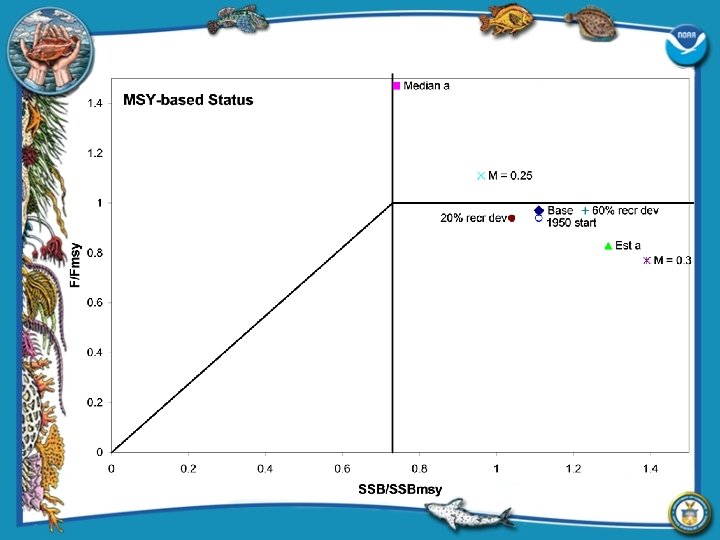
Conclusions • Adding the age structure allowed a more sophisticated model construction, which captured some important dynamics (differences in the fishery east and west). • This model converged on a solution that was more optimistic than the continuity case but still indicated overfishing. • It was not possible to definitively conclude whether the stock was overfished because the stock-recruitment relationship was not well estimated by the model. Based on the current benchmarks for this stock, the stock may be approaching an overfished condition.
Not To Be Presented!
Timeline • 2001—First assessment of gray triggerfish May be overfished, never designated Walter Ingram’s thesis • 20 -24 Jun 2005—Data Workshop – Finalized almost all model inputs. • 22 -26 Aug 2005—Assessment Workshop 1 – (Katrina) Reviewed the “continuity case” aggregated surplus production model • 19 -20 Dec 2005—Assessment Workshop 2 – Reviewed the proposed base model, an age-structured production model
Life History Parameters • • Maturity: 87. 5% @ 1 yr, 100% when older. Fec = 170289 e 0. 3159 x, where x = age. M = 0. 27 for all modeled age classes. FL = 423. 4 (1 -e-0. 4269(x+0. 6292)), where FL = fork length in mm and x = age. • Wt = 4. 4858*10 -8 FL 3. 0203, where Wt = weight in lbs and FL = fork length in mm. • Discard mortality = 0.
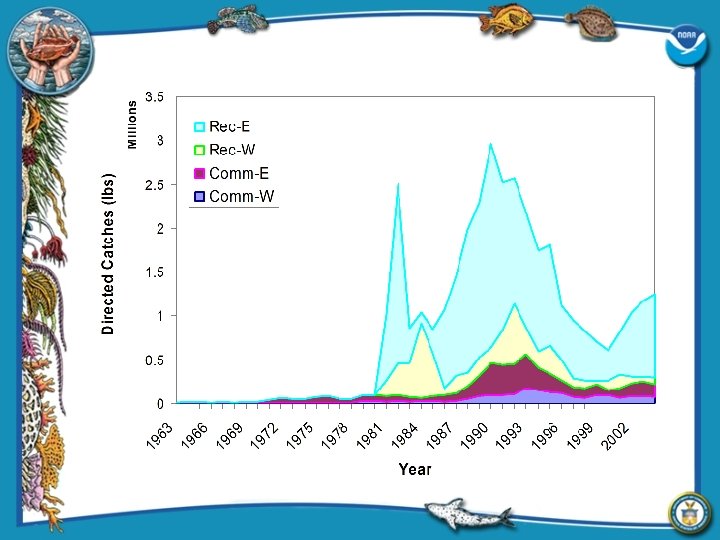
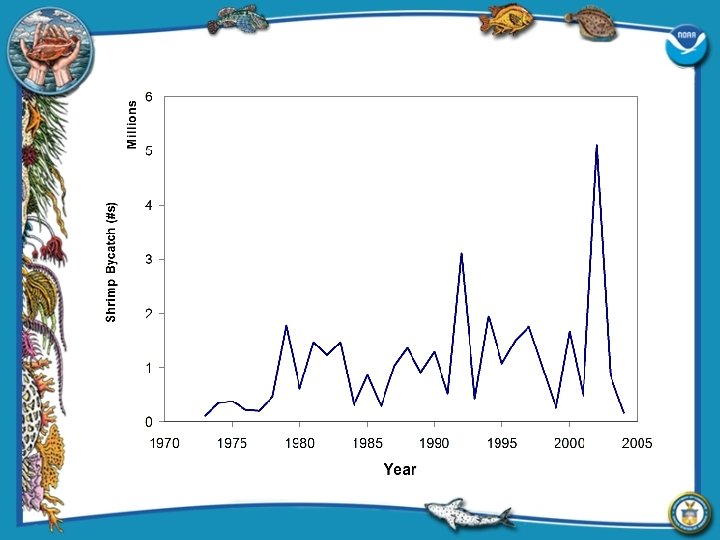
SSASPM Details • Timeframe: – 1963 -1980 “burn-in” from no-fishing, with linear increase over time. – 1981 -2004 detailed modeling. • Fleets: Commercial and recreational split E&W (at Mississippi River), shrimp GW. • F-D indices split E&W as well. • Age range: 1 to 10+.
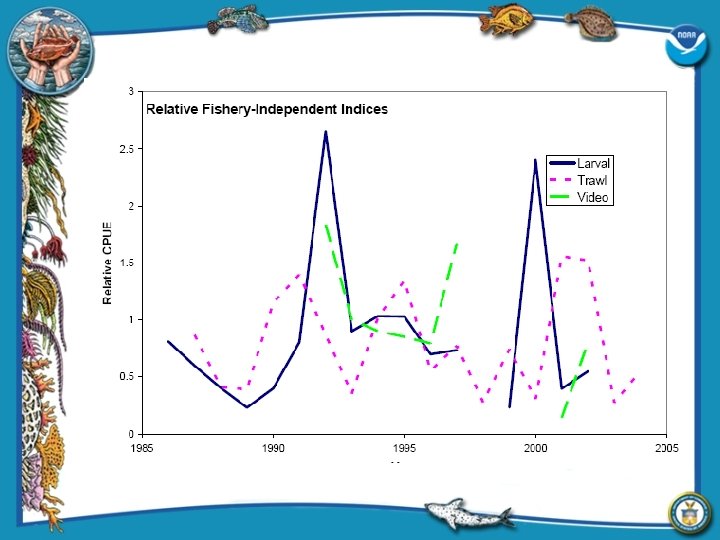
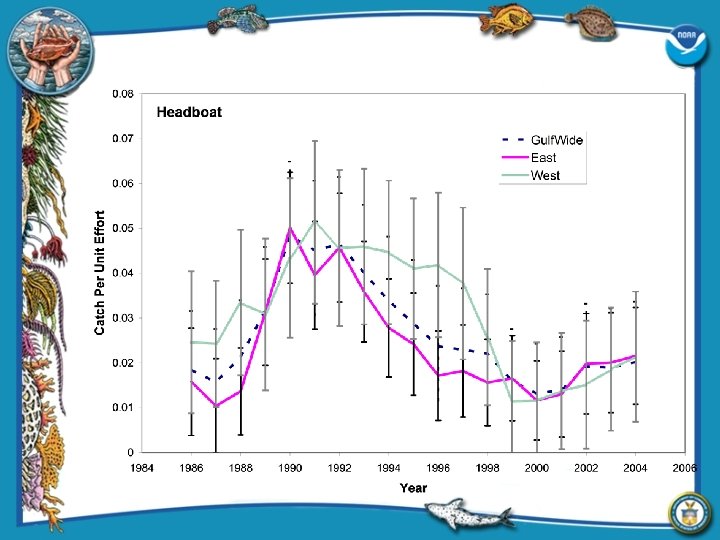
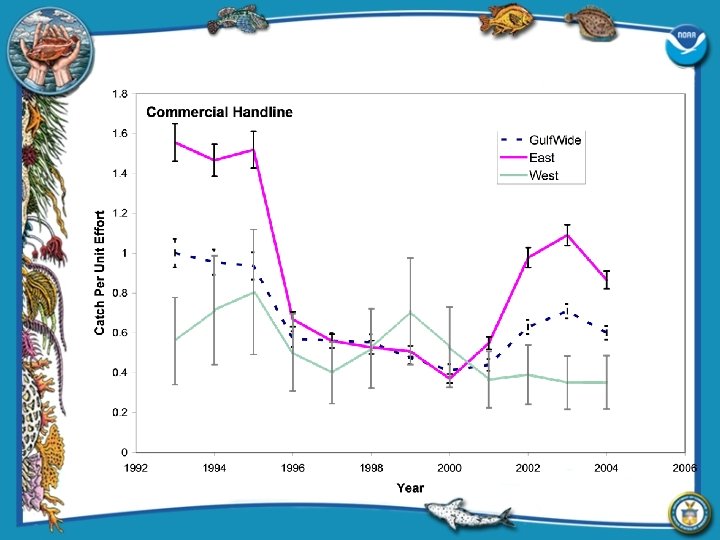
Indices with Confidence Intervals
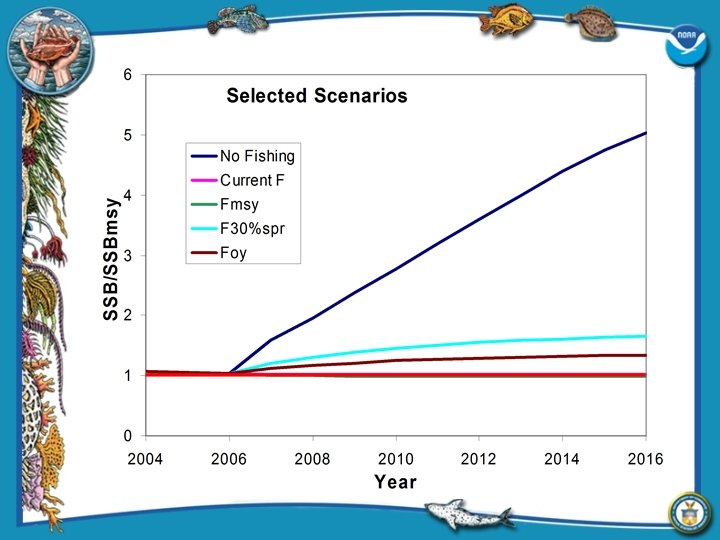
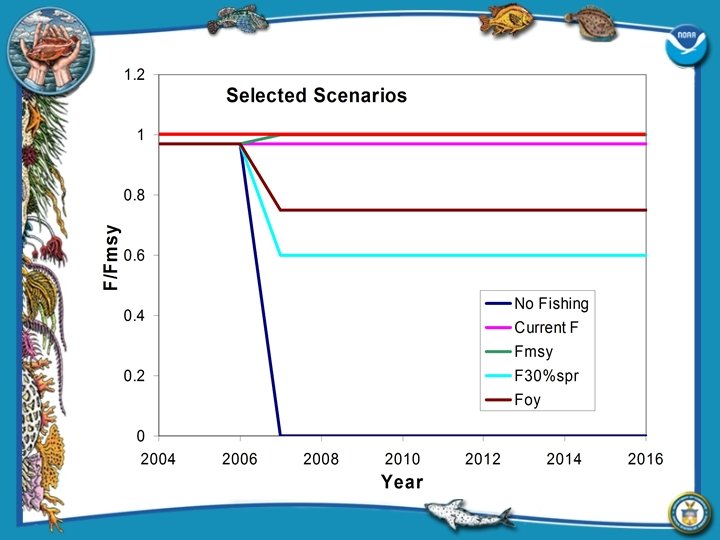
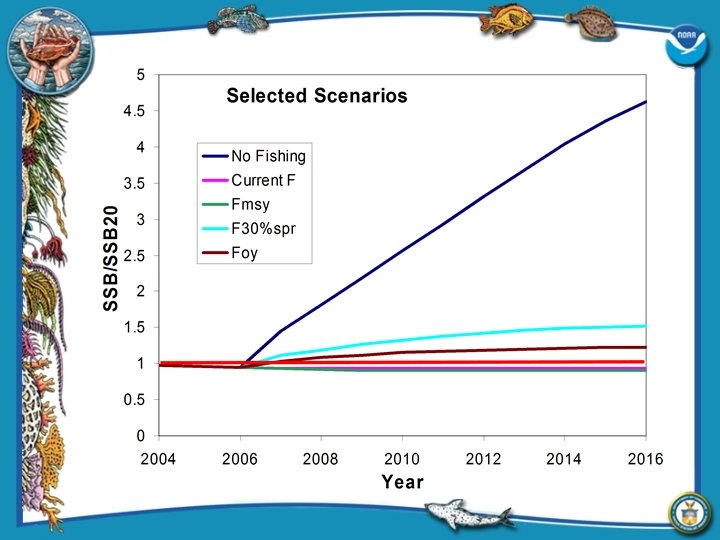
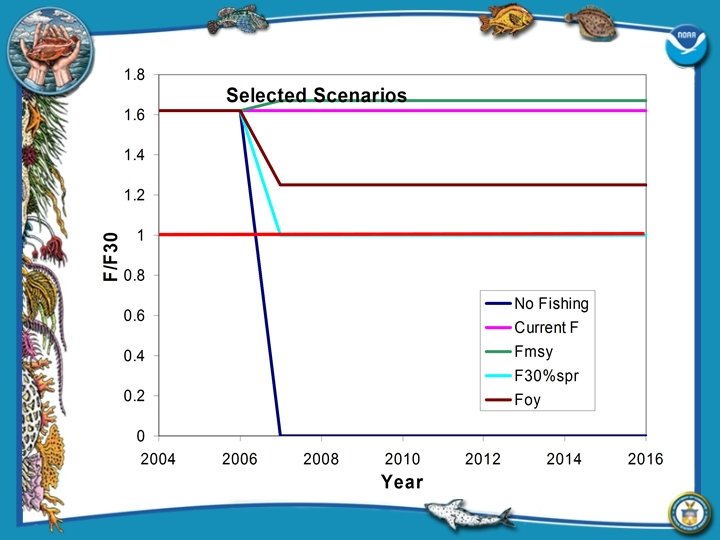
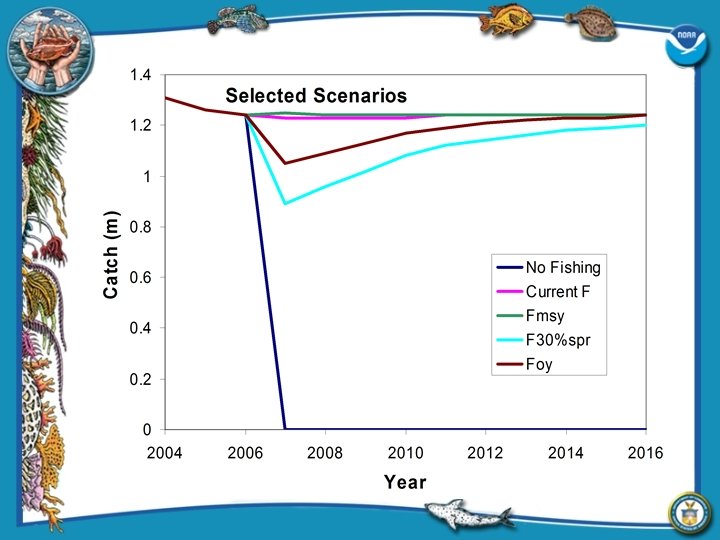
Projections