Guided Pathways Indicators For Advancing Equitable Student Success

Guided Pathways Indicators For Advancing Equitable Student Success and Ensuring College Survival After COVID-19 Davis Jenkins Senior Research Scholar Hana Lahr Senior Research Associate Michigan Guided Pathways Institute July 21, 2020

Clues from the Great Recession: How Covid-19 may affect community college enrollments and funding
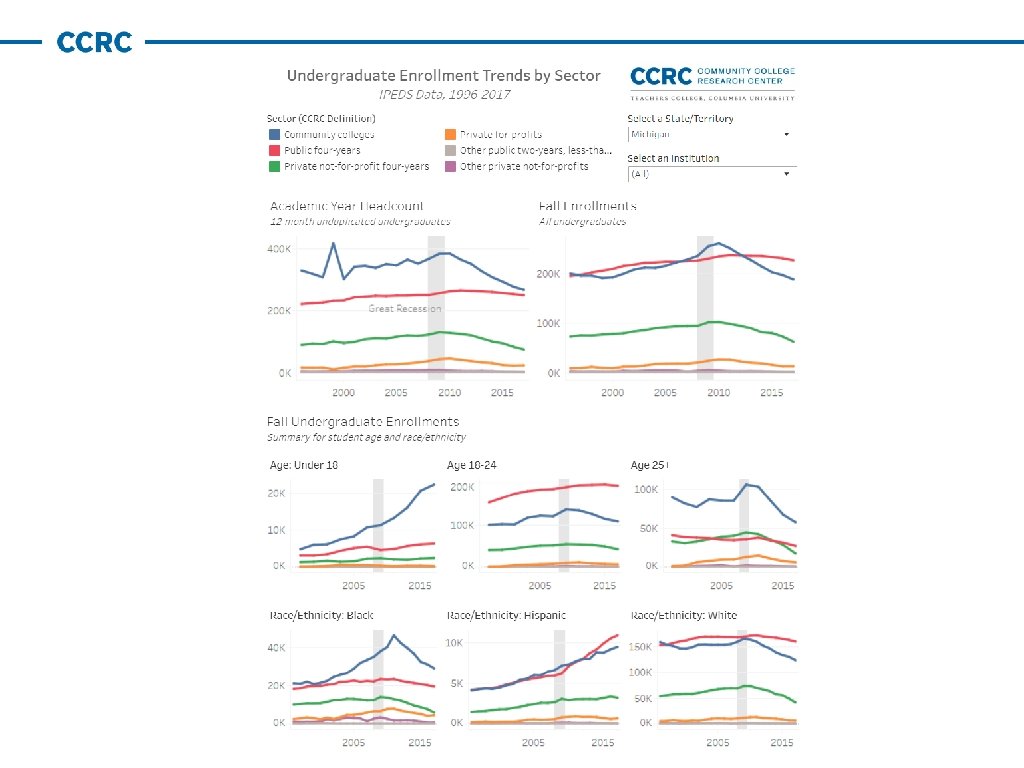
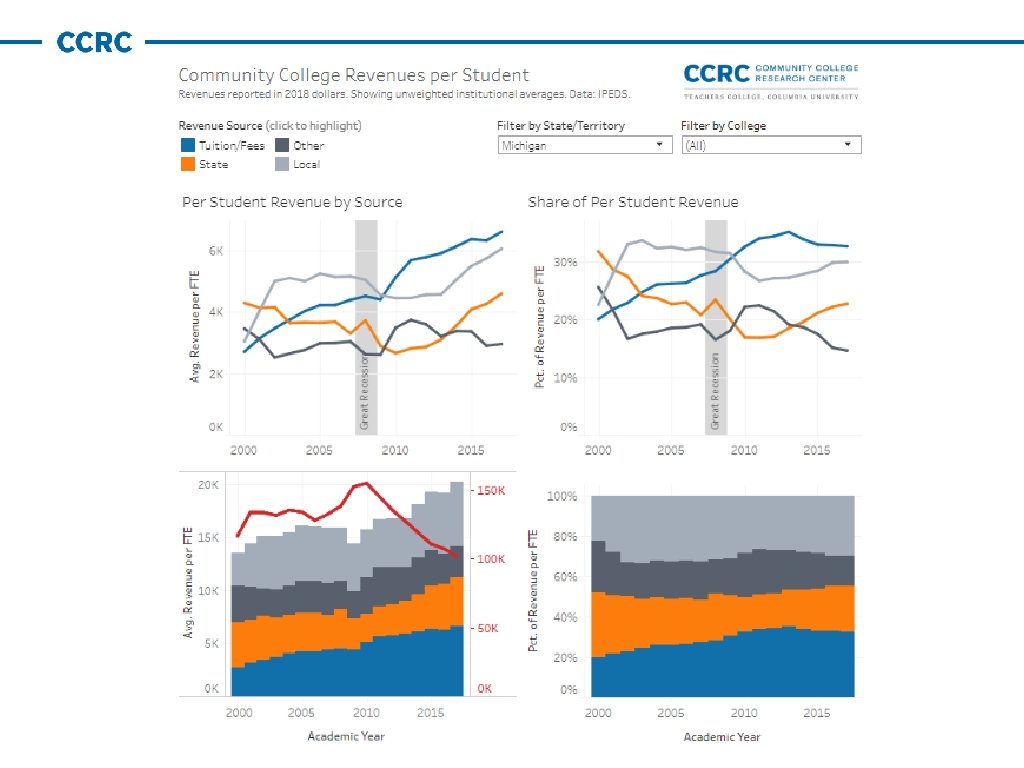

COVID Challenges for Students and Colleges § Students will be even less able to afford college so they will expect programs that enable them to achieve goals as quickly and affordably as possible § Students will want programs that enable them to secure stable jobs in short term and good jobs in longer term—offered in formats/on schedules that work for adults with intense job and family pressures § Demand for hs dual enrollment offerings that save time and money required to earn a bachelor’s degree will increase § Students will face higher levels of trauma than usual § Competition from on-line degree completion providers, regional public universities, less-selective privates will intensify § State funding will likely be cut substantially; colleges will have to break down silos, work collaboratively to respond to challenges
 Ensure all students are")
GP Strategies for Student Success and College Survival Post-Covid 1) Ensure all students are in programs that lead to good job or transfer with junior standing in student’s major 2) Help every student explore career/academic interests and connect with faculty, experienced students, alumni others in the student’s field of interest 3) Ensure every student takes a “light the fire” course on topics of interest in term 1 4) Ensure every student (including dual enrollment) has a career goal and full academic plan by end of term 1

Guided Pathways to What? For Whom?

Higher-Returning Associate Degrees 36% of associate degrees awarded by MI ccs in 2016 -17 Source: Carnevale, et al. , Overlooked Value of Certificates and Associate’s Degrees. Georgetown Center on Education and the Workforce, 2020.

Higher-Returning Certificates 29% certificates awarded by MI ccs in 2016 -17 Source: Carnevale, et al. , Overlooked Value of Certificates and Associate’s Degrees. Georgetown Center on Education and the Workforce, 2020.

Trends in Good Jobs* * “Good jobs” defined as those that pay a minimum of $35, 000 for workers between the ages of 25 and 44 and at least $45, 000 for workers between the ages of 45 and 64. Source: Carnevale, et al. , Three Educational Pathways to Good Jobs. Georgetown Center on Education and the Workforce, 2018.

41% Completed Any Degree or Credential Below National Average Highest Outcomes in Six-Years: South Dakota North Dakota Minnesota Iowa Wyoming Mississippi Wisconsin Florida Kansas Illinois Georgia Virginia Washington Montana New York Tennessee Nebraska New Hampshire Arkansas North Carolina Kentucky Pennsylvania Hawaii U. S. Overall New Jersey Missouri Maryland Massachusetts Colorado Texas Michigan New Mexico South Carolina Oklahoma Maine Idaho Alabama Ohio Connecticut California Oregon Arizona West Virginia Above National Average Community College Entrants, by State Completed at CC Completed at FY Still enrolled Not enrolled Michigan Source: NSC Completing College Signature Report tracking the fall 2013 FTIC, degree-seeking public 2 -yr entering cohort (excluding current dual enrollment students but including former DE students) 24% 0% 17% 20% 30% 16% 40% 50% 43% 60% 70% 80% 90% 100%

Highest Outcomes in Six-Years among FTIC Community College Entrants, by Race/Ethnicity 28% 37% 41% 43% 40% Not Enrolled 53% 23% Still Enrolled 13% 16% 41% Completed Any Degree or Credential 22% 49% 26% 50% 22% 18% 37% 17% 21% Completed at 4 Yr 40% 18% 14% 29% 10% 24% 23% Overall Asian 19% Black Completed at CC 23% Hispanic 28% White 22% Two or More Races Source: NSC Completing College Signature Report tracking the fall 2013 FTIC, degree-seeking public 2 -yr entering cohort

Guided Pathways to What? For Whom? • Transformation through GP involves reorganizing around meta-majors and programs, offering an opportunity for examining equity at the program level • GP Program Equity Questions for Colleges: • • Which programs don’t advance opportunity, which students are over-represented, why do we offer these programs? How do we help students connect and build momentum through a program that will add the most value?
Equitable Representation Among Community College Programs Framing analyses from one state’s community college system")
(In)Equitable Representation Among Community College Programs Framing analyses from one state’s community college system

Half of students don’t return for a second year Term-by-term program enrollments among degree-seeking CC entrants in one state 100% 0% Not enrolled, No completion Completed 90% 28% Transferred 39% 80% 47% 61% 70% Not enrolled, No completion at start of the 2 nd year 51% Social & Behavioral Sciences 54% 60% Other CTE Human Services & Public Safety Education & Child Care Business 50% 58% enter into general, 40% undeclared, unknown, or uncategorized 30% programs Health Industrial & Applied Technologies Computer & Information Sciences STEM 20% Arts, Humanities, Communication, & Design Undeclared 10% Uncategorized 0% Term 1 Term 2 Term 3 Term 4 Term 5 Term 6 Term 7 Term 8

Categorizing Community College Programs by Post-Graduation Opportunity Category Description Examples Workforce: Low Program places students into jobs with low average earnings (e. g. , less than $14/hour) Criminal Justice, Automobile Technology, Early Childhood Workforce: Medium Program places students into relatively middle-paying job (e. g. , between $14 -$17. 55/ hour) Accounting, Welding, Business Management, Dental Assistant Workforce: High Program places students into a relatively high-paying job (e. g. , more than $17. 55/ hour) Nursing, Radiology Technology, Sonography, Dental Hygiene Transfer: Unstructured Program designed for general transfer (no pre-major or university destination necessarily specified) AA-General Studies, “General Transfer” Transfer: Structured Program designed to prepare students for a particular baccalaureate major/meta-major and/or a specific fouryear destination AA-Business (DTA), AS-T (Engineering) Listed as undeclared or missing program information Null, Missing Program, Undeclared Non-degree seeking, ESL, ABE, dual enrollment Basic Education, ESL, Running Start Undeclared or Unknown Uncategorized or Other

Enrolled Students Only: Program Enrollments by Term among FTEIC degree-seeking CC Entrants, 2009 -2011 100% 7% 9% 90% 15% 16% 18% 10% 80% 33% 7% 6% 70% 23% 18% 16% 5% 9% 19% 20% 26% 60% 18% 7% 5% 12% 6% Workforce: Medium 11% 16% 17% 19% Workforce: Low +9 pp +8 pp 23% 14% 40% 24% 37% 27% 30% Workforce: High 12% 13% 50% Uncategorized 20% +16 pp 12% 19% 7% 36% 3% 20% 7% +22 pp 7% 20% 13% 22% Enter Complete 12% 5% 0% Enter Transfer: Structured 34% 18% 10% +15 pp Complete White 4% Enter Complete African American 3% Enter Transfer: Unstructured Complete Hispanic Asian Unknown or Undeclared

Racial Transfer Gap Most Pronounced in Students’ First Three Years CCRC analysis using statewide administrative data on 573, 806 community college entrants between 2009 -2018, tracked up to 10 years. Estimated odds ratios from hazard models controlling for students characteristics, college fixed effects and cohort fixed effects.

Equity in Access to Higher-Opportunity Pathways 1. When does program sorting by race and income occur? • 2. Result: Sorting occurs throughout, especially in year 1, though some bright spots of parity in likelihood to enter higher-opportunity programs. What intervening factors mitigate inequitable sorting?

Equity in Access to Higher-Opportunity Pathways 1. When does program sorting by race and income occur? • 2. Result: Sorting occurs throughout, especially in year 1, though some bright spots of parity in likelihood to enter higher-opportunity programs. What intervening factors mitigate inequitable sorting? • Result: Completion of early academic milestones increases likelihood of higher-opportunity outcomes overall, and disproportionately benefit black, Hispanic, and lower-income students.

Benefits of Momentum for Transfer Benefit of completing 12 or more collegelevel credits on transferring and completing a bachelor’s degree Black Students Hispanic Students 2. 4 x 4. 2 x Other Students 1. 7 x Additive Effects Benefit of Milestone (Baseline) Black Latinx Lowincome 3 -5 x 6 x 6 -11 x 7 -8 x Gateway English/Math (College-level) 3 -4 x No diff. 6 -8 x 4 -6 x Completed Transfer Degree 6 -7 x 9 -11 x 11 -18 x 11 -13 x Transfer & bachelor’s completion Credit Momentum (6+, 12+, or 24+ college credits) 1. 7 -2 x 2 -3 x 4 -5 x 7 -9 x Gateway English/Math (College-level) 1. 5 -3 x 2 -4 x 4 -5 x 3 -4 x 5 -6 x 5 -9 x 6 -7 x Transfer to a four-year institution Credit Momentum (6+, 12+, or 24+ college credits) Completed Transfer Degree CCRC analysis using statewide administrative data on 573, 806 community college entrants between 2009 -2018, tracked up to 10 years. Estimated odds ratios from hazard models controlling for students characteristics, college fixed effects and cohort fixed effects.

Equity in Program Enrollments and Completions CONNECTION From interest and application to first enrollment • Is the college • engaging underrepresented students in high schools, adult education, and noncredit programs to explore the college’s pathways and pursue a program of study? ENTRY PROGRESS / COMPLETION From entry to program choice and entry Are underrepresented students entering programs leading to higher remuneration degrees/fields? From program entry to completion of program requirements • • Do patterns of student program switching result in more or less equitable representation in programs leading to high-remuneration degrees and careers? Are high- and lowremuneration CC awards being conferred equitably? ADVANCEMENT From completion of credential to career advancement and further education • • Are postgraduation employment outcomes equitable? Are transfer and bachelor’s completion outcomes equitable?

Planning Guide and Data Tool for Colleges on Access to Higher-Opportunity Pathways 1. 2. 3. What programs are our students currently enrolled in? Which programs lead to greater or lesser opportunity? Is student representation across programs proportionate? https: //ccrc. tc. columbia. edu/publications/unpackingprogram-enrollments-completion-equity. html

Program Explorer Excel Tool

Case Study: Examining Equity in Program Enrollments at Lorain County Community College in Ohio

Program enrollment equity • National studies released about the impact of program selection • Disaggregated completion rates started to prompt pipeline discussions • Results from graduate outcome surveys sparked internal dialog • Data & Information Group (DIG) shared creation of new report

Courageous Conversations Questions discussed • Why is this occurring? Is it structural? Is it access? • What other information do we need? • How do you equip students with the tools to make the most informed decisions? • Where do opportunities exist for redesign? Campus wide (Faculty Brown bags & Staff Updates) Committees and Divisions Pathways teams

Lessons Learned Understanding the ‘why’ is extremely important • Uncover what it is that is attracting students to the program Must look at the whole picture • What else is impacting the numbers? Creating a culture of care across the institution helps students at all points along the experience Broad access to a variety of equity training • Equipping individuals with the knowledge of resources, tools, and a deeper understanding of how to support students

Informed Strategies Identify a culturally responsive career counseling approach and provide training to all Advisors and Career Counselors in ECFS Utilize new intake survey to learn about students’ backgrounds and family support, continuing to deepen a holistic, appreciative advising approach Second cohort of Avanzando Through College in Fall 2020, which provides a culturally-informed approach to college transition for Hispanic and Latinx students o Seeking a similar support community model for new Black/ African American students Advisors visit program sites, clinical locations, employers, etc to see work in action and be able to better describe opportunities within their assigned academic/ career pathways Integrate career and academic pathway connections into Student Engagement efforts, using recent surveys on non-traditional students, student-parents, and students of color to redesign student life opportunities that resonate with LCCC students with diverse life experiences and backgrounds SDEV redesign is underway and curriculum includes a research component that is grounded in pathways and provides opportunities for faculty within the disciplines to highlight career pathways and professional organizations with which students can connect Transfer Coordinator position will provide students with individualized guidance on selecting transfer institutions, and University Partnership continues to ensure each pathway LCCC offers has an aligned transfer option to lead to enhanced skills and socioeconomic mobility

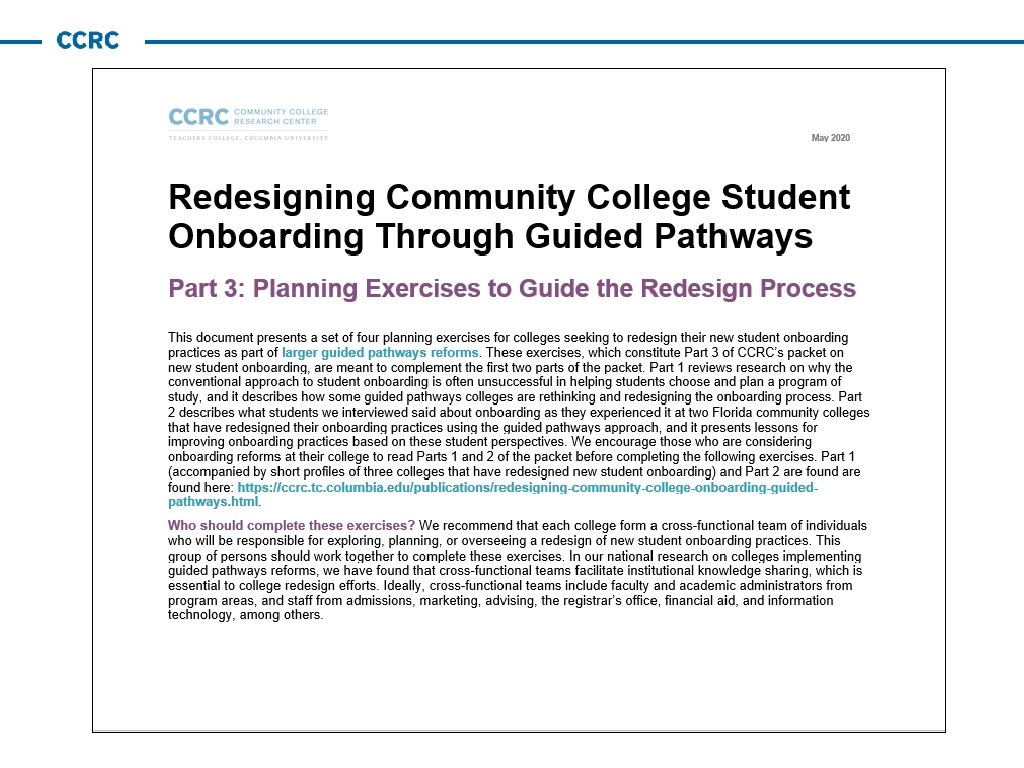
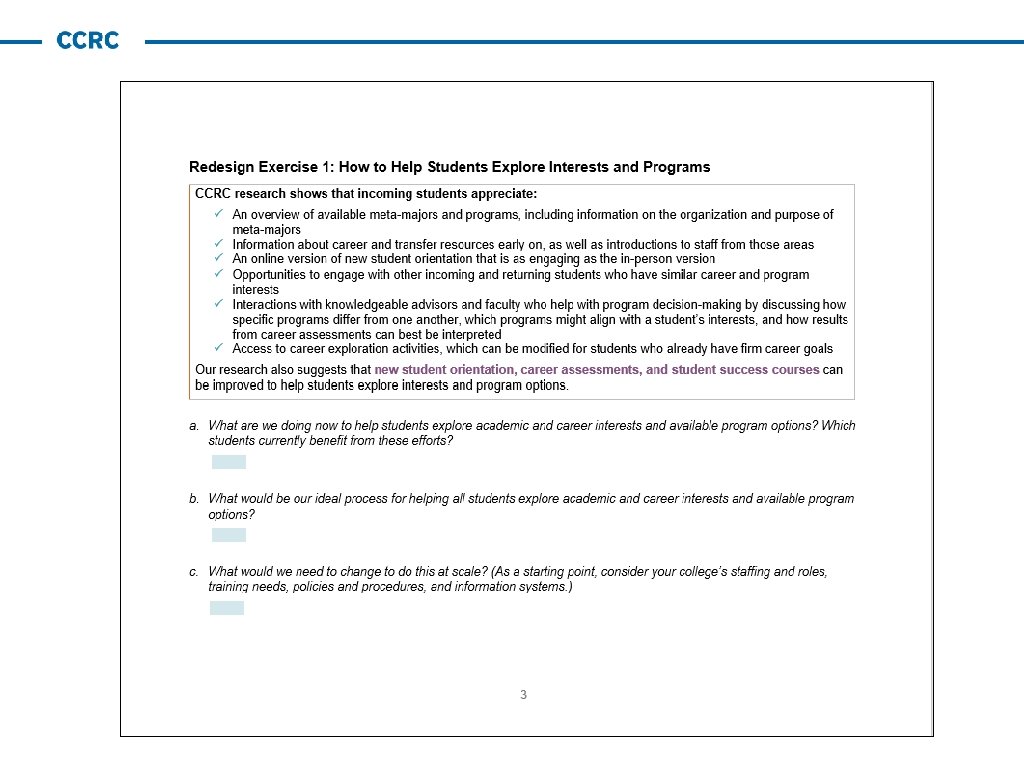
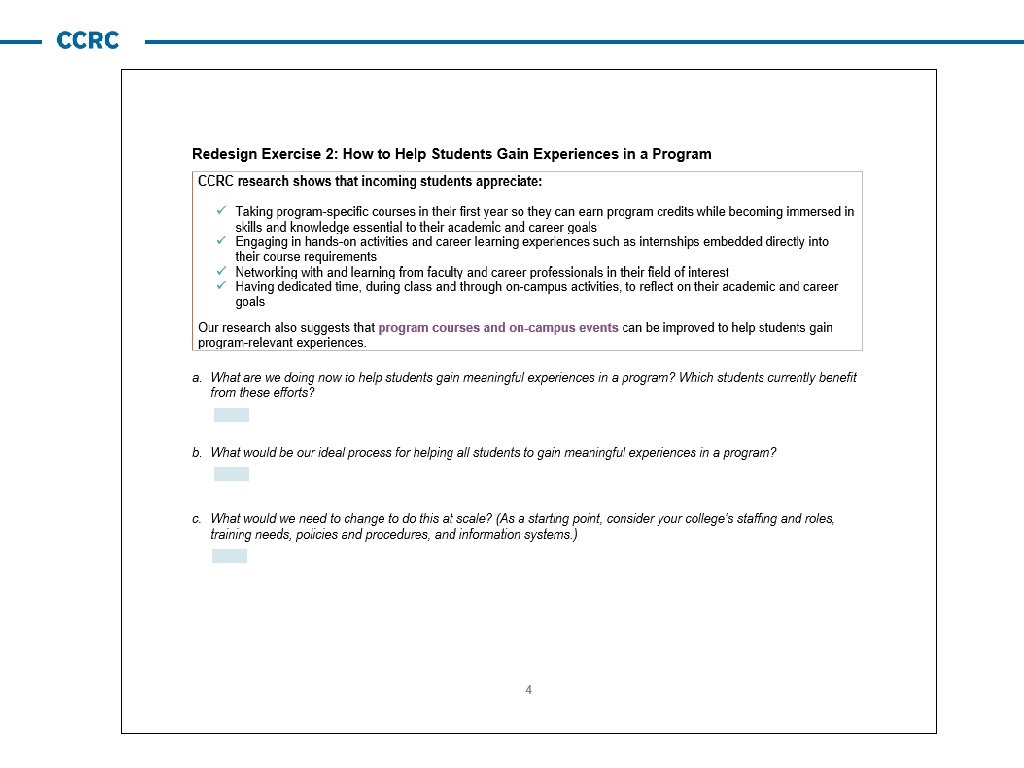
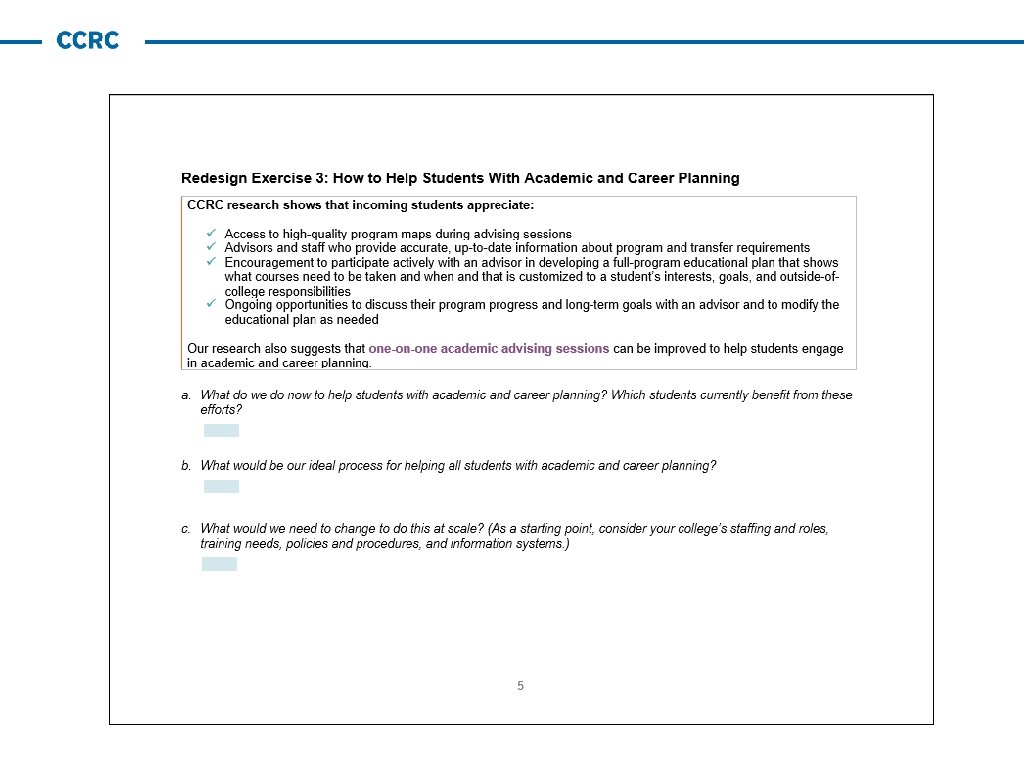
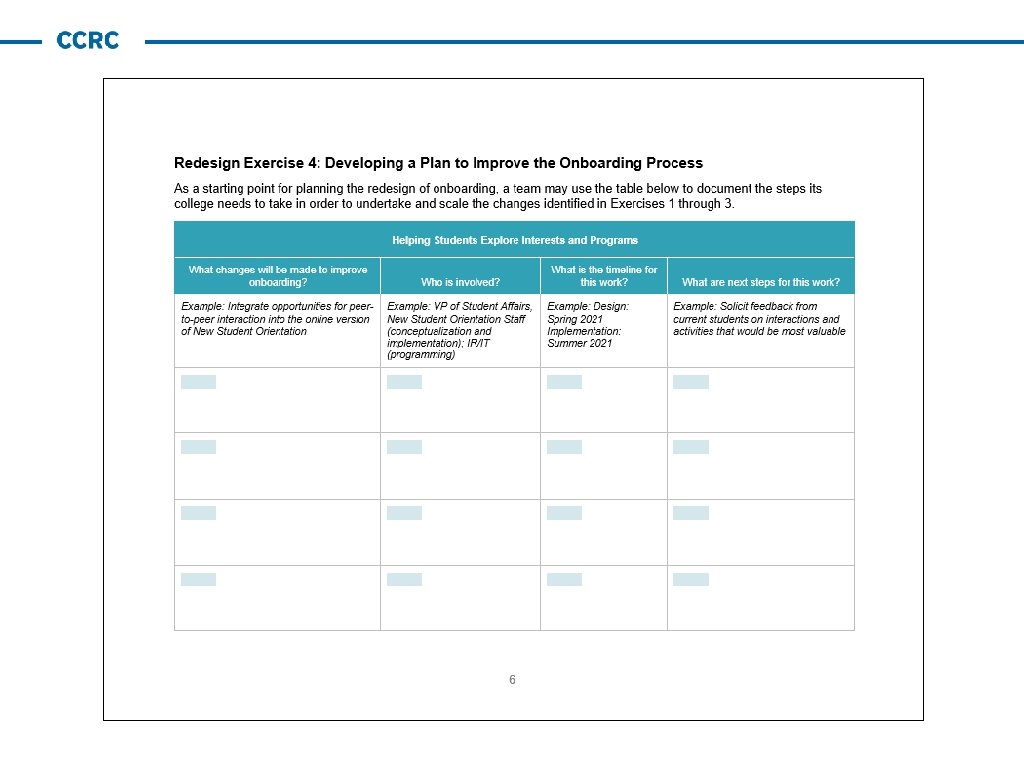
New CCRC Guide to Onboarding Students Into High. Opportunity Programs

Rethinking Onboarding From a Guided Pathways Perspective New reports from CCRC on onboarding: https: //ccrc. tc. columbia. edu/publications/redesigning-community-college-onboarding-guided-pathways. html

Academic and career exploration activities are embedded into curricular and co-curricular experiences for all entering students throughout their first year http: //why. spc. edu/communities/? __hstc=162944227. 3282 eadb 4 f 05 cbabb 9 c 3124 be 536 ccfc. 1569949698077. 1571340698039. 2& __hssc=162944227. 2. 1571340698039&__hsfp=1037199243

St. Petersburg College’s fall 2019 career and academic community weeks and associated events Social/Behavioral Sciences and Human Services Sept. 9 -14 Technology Sept. 30 -Oct. 5 Public Safety, Public Policy, and Legal Studies Sept. 16 -21 Science and Mathematics Oct. 21 -26 Engineering, Manufacturing, and Building Arts Oct. 14 -19 Business Oct. 28 -Nov. 2 Communications Nov. 4 -9 Education Nov. 18 -23 Health Sciences and Veterinary Technology Nov. 11 -16 Arts, Humanities, and Design Dec. 2 -7 “Join us to network, explore, and learn about careers and degrees offered in all of our SPC communities. With more than 45 events covering all 10 of our learning communities, there will be something for everyone. ” http: //why. spc. edu/communities/? __hstc=162944227. 3282 eadb 4 f 05 cbabb 9 c 3124 be 536 ccfc. 1569949698077. 1571340698039. 2& __hssc=162944227. 2. 1571340698039&__hsfp=1037199243

St. Petersburg College’s fall 2019 events by career and academic community

All new students take at least one course in their meta-major/program in their first term

Dual enrollment is designed as an on-ramp to college programs Indian River State College’s Great Explorations event for high school junior and seniors to explore programs and careers

Thank you! and Resources New CCRC resources on program enrollments and onboarding: Unpacking Program Enrollments and Completions With Equity in Mind Redesigning Community College Student Onboarding Through Guided Pathways New data tools on college enrollments and funding: How Will COVID-19 Affect Community College Enrollment? Looking to the Great Recession for Clues More Clues from the Great Recession: How Will COVID-19 Affect Community College Funding?
- Slides: 42