Guerra comercial guerra cambial guerra real Dr Antony
 Semana")
Guerra comercial – guerra cambial – guerra real Dr. Antony P. Mueller (UFS) Semana do Economista 15 de agosto de 2018

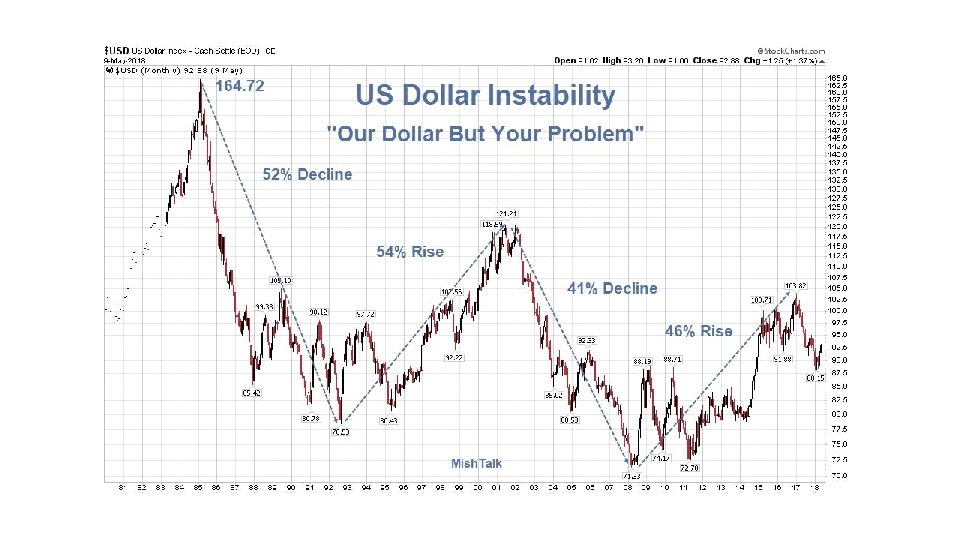
The dollar is your problem “The dollar is our currency but your problem. ” Nixon-era US treasury secretary John Connally in 1971 • The Bretton Woods fixed the US dollar to the price of gold at $35 an ounce and had the other countries maintain a fixed and agreed parity vis-à-vis the dollar. The system was doomed as early as 1958 when the European currencies attained full convertibility and private capital flows began to accelerate. The unravelling reached a tipping point in 1970. The US economy suffered from a host of ills: inflation approaching 6%, GDP growth less than 1%, an emerging current account deficit, and gold coverage falling from 55% to 22%. • President Richard Nixon announced a ‘new economic policy’ on 15 August 1971. The prime architect of the ‘Nixon shock’ was treasury secretary John Connally. The measures included a unilateral 10% surcharge on all dutiable imports, a 10% reduction in foreign assistance expenditures, closing of the ‘gold window’ and a 90 -day wage and price controls.

Trade and currency war 2018 • "I have just authorized a doubling of Tariffs on Steel and Aluminum with respect to Turkey as their currency, the Turkish Lira, slides rapidly downward against our very strong Dollar. Our relations with Turkey are not good at this time!“ • President Donald J. Trump August 10, 2018 • Turkey's currency plunged to fresh all-time lows against the dollar Friday after President Donald Trump announced in a tweet that he would double tariffs on aluminum to 20% and on steel to 50%. • The lira dropped as much as 19% against the dollar, its steepest daily drop since at least 2001. It has been one of the worst-performing currencies this year but a deepening rift between Ankara and Washington has accelerated the selloff. • Source: https: //finance. yahoo. com/news/turkey-apos-currency-takes-17131818173. html

Turkish Lira to US-dollar

Turkish revenge. New tariffs on US products Turkey will impose an additional 50 percent tax on U. S. rice, 140 percent on spirits and 120 percent on cars. There also additional charges on U. S. cosmetics, tobacco and some food products. Source

Turkey. Foreign debt

Turkey. Current account to GDP

Turkey. Central bank balance sheet

Valorização do dólar Interactive Map July 2018 https: //www. economist. com/news/2018/07/11/ the-big-mac-index
 and under (-) valuations against the US-dollar Switzerland Franc 18. 8 Sweden")
Over (+) and under (-) valuations against the US-dollar Switzerland Franc 18. 8 Sweden Krona 5. 8 United States US$ 0 BASE CURRENCY Norway Krone -5. 2 Canada C$ -8. 0 Euro area Euro -14. 1 Denmark Krone -14. 4 Israel Shekel -15. 1 Australia A$ -18. 1 Uruguay Peso -18. 8 Brazil Real -20. 1 Lebanon Pound -21. 9 Singapore S$ -22. 4 New Zealand NZ$ -23. 2 Britain Pound -23. 2 Colombia Peso -24. 9 Chile Peso -26. 5 South Korea Won -26. 8 Costa Rica Colón -26. 8 UAE Dirham -30. 8 Sri Lanka Rupee -33. 9 Thailand Baht -34. 9 Honduras Lempira -35. 7 Japan Yen -36. 4 Kuwait Dinar -37. 0 Czech Rep. Koruna -38. 3 Guatemala Quetzal -39. 4 Croatia Kuna -39. 6 Qatar Riyal -40. 2 Nicaragua Córdoba -40. 8 Peru Sol -41. 8 Saudi Arabia Riyal -41. 9 Bahrain Dinar -42. 6 China Yuan -43. 8 Pakistan Rupee -44. 0 Hungary Forint -44. 2 Vietnam Dong -48. 8 Jordan Dinar -50. 2 Poland Zloty -50. 3 Oman Rial -50. 5 Argentina Peso -50. 9 Philippines Peso -52. 5 Moldova Leu -53. 1 Mexico Peso -53. 3 Hong Kong HK$ -53. 8 India Rupee -54. 4 South Africa Rand -57. 9 Azerbaijan Manat -57. 9 Romania Leu -58. 0 Turkey Lira -58. 5 Taiwan NT$ -58. 8 Indonesia Rupiah-60. 2 Malaysia Ringgit -61. 9 Russia Rouble -62. 0
")
US trade deficit (monthly)
")
US current account deficit in % of GDP (mean = - 2. 64%)

United States long-term TIC Flow There was 45575 million of dollars worth of Treasury International Capital (TIC) flowing into the United States in May of 2018. Net Long Term Tic Flows in the United States averaged 24032. 97 USD Million from 1978 until 2018, reaching an all time high of 157830 USD Million in September of 2014

US net long-term “Tic flow” – Treasury International Capital

US net international investment position

Sources: Federal Reserve; US Department of the Treasury

China. Foreign Exchange reserves
")
China. Exchange rate (yuan per US-dólar)

Japan. Foreign exchange reserves
")
Japan. Exchange rate (Yen per US-dólar)

Brazil. Foreign exchange reserves
")
Brazil. Exchange rate (real per dólar)

U. S. Government debt
")
U. S. government debt coefficient (Federal debt in % of gdp)

USA Military Expenditure
 Rank 01 02 03 04 05 06")
Military spending 2017 (US 2019: 717 bn) Rank 01 02 03 04 05 06 07 08 09 10 Country World total United States People's Republic of China[a] Saudi Arabia[a][b] Russia India France United Kingdom Japan Germany South Korea Spending ($ Bn. ) % of GDP % of World share 1, 739 610. 0 2. 2 3. 1 35. 0 228. 0 1. 9 13. 0 69. 4 66. 3 63. 9 57. 8 47. 2 45. 4 44. 3 39. 2 10 4. 3 2. 5 2. 3 1. 8 0. 9 1. 2 2. 6 4. 0 3. 8 3. 7 3. 3 2. 7 2. 6 2. 5 2. 3

Costs of “War on terror”((Source: "National Defense Budget Estimates for FY 2018, " Office of the Under Secretary of Defense, June 2017. ) FY 2001 2002 2003 2004 2005 2006 2007 2008 2009 2010 2011 2012 2013 2014 2015 2016 2017 2018 Wo. T OCO $22. 9 $16. 9 $72. 5 $90. 8 $75. 6 $115. 8 $166. 3 $186. 9 $153. 1 $162. 4 $158. 8 $115. 1 $82. 0 $85. 2 $64. 2 $58. 6 $82. 4 $64. 6 Do. D Budget Increase $6. 5 $40. 8 $36. 7 $11. 6 $23. 6 $10. 5 $20. 9 $47. 5 $34. 2 $14. 7 $0. 3 $2. 2 -$34. 9 $0. 8 $1. 0 $24. 3 -$5. 6 $58. 4 VA Budget Increase $1. 5 $2. 6 $3. 1 $0. 7 $5. 3 $1. 2 $9. 8 $3. 9 $3. 3 $2. 6 $2. 0 $1. 8 $6. 5 $3. 8 Total Wo. T $31. 0 $59. 1 $111. 9 $105. 0 $102. 3 $127. 0 $192. 5 $235. 6 $197. 1 $181. 0 $162. 4 $119. 6 $49. 6 $88. 0 $67. 0 $89. 5 $80. 3 $126. 8 Boots on Ground* 9, 700 136, 800 169, 900 175, 803 154, 220 186, 563 181, 000 183, 300 144, 205 105, 555 65, 800 43, 300 32, 500 12, 650 12, 457 n. a.

“War on drugs”

“War on Poverty”

SDR – Composition of Special Drawing Rights Weights determined in the 2015 Fixed Number of Units of Currency Review Currency for a 5 -year (percent) period Starting Oct 1, 2016 U. S. Dollar 41. 73 0. 58252 Euro 30. 93 0. 38671 Chinese Yuan 8. 33 1. 0174 Japanese Yen 8. 09 11. 900 Pound Sterling 10. 92 0. 08594

Composition of foreign exchange reserves holdings Currency US-dollar Euro Japanese Yen Pound Sterling Canadian dollar Australian dollar Chinese Renminbi Swiss Franc Global share 2017 in percent 62. 70 20. 14 4. 89 4. 54 2. 02 1. 80 1. 23 0. 18

Debt expansion phase – Debt contraction Trade balance Capital balance Asset/Debt Creditor country EX > IM CIM < CEX Asset accumulation Debtor country EX < IM CIM > CEX Debt accumulation Contractionary Phase Creditor country EX < IM CIM > CEX Asset reduction Debtor country EX > IM CI< < CEX Debt reduction Expansionary Phase

United States imports of steel
")
Brazil. Structure of exports (Source: OEC)
")
Brazil. Structure of imports (Source: OEC)
")
Brazil. Direction of exports (Source: OEC)
")
Brazil. Origin of imports (Source: OEC)

Contact and references antonymueller@gmx. com https: //www. a mazon. com/Ca pitalism. Beyond-Politics. Antony. Mueller/dp/17 17759890/ref=s r_1_1? s=books &ie=UTF 8&qid= 1534007292&sr =11&keywords=A ntony+P. +Muell er https: //www. amaz on. com/BEYONDSTATE-POLITICSCAPITALISMMILLENNIUM/dp/1 717773761/ref=sr_ 1_fkmr 0_2? s=book s&ie=UTF 8&qid=15 34007780&sr=1 -2 fkmr 0&keywords= Antony+P. +Mueller +Beyond+the+Stat e+and+Politics. +Ca pitalism+for+the+N ew+Millennium

Additional sources • www. continentaleconomics. com • https: //www. youtube. com/user/antonymueller/videos • www. economianova. blogspot. com • www. socec. blogspot. com • https: //www. aier. org/staff/antony-mueller
- Slides: 42