GTSC UNIVERSITY SQL Server 2005 SQLDiag SQL 2000PSSDiag


 可以看出资源争抢的对象 • • Row locks counts (行锁申请数目) Row")


*8 as user_objects_kb, sum(internal_object_reserved_page_count)*8 as internal_objects_kb, sum(version_store_reserved_page_count)*8 as version_store_kb, sum(unallocated_extent_page_count)*8 as")
 as allocated, (t")


- Slides: 38
GTSC UNIVERSITY SQL Server 2005 性能调优
使用SQLDiag • 在SQL 2000里面的PSSDiag • 缺省在SQL 2005里面就有安装 • 可以自动搜集 • • SQL Trace Performance Log SQLDiag report Windows Event Logs • 附带两个模板 • SD_Detailed. XML • SD_General. XML
Lab 1 • 使用SQLDiag监视SQL 2005的运行
�� 阻塞 • DMF sys. dm_db_index_operational_stats() 可以看出资源争抢的对象 • • Row locks counts (行锁申请数目) Row lock waits counts (行锁等待次数) Total wait time for blocks (总共被阻塞的时间) 可以算出发生阻塞的百分比和平均等待时间 row_lock_wait_count / row_lock_count row_lock_wait_in_ms / row_lock_wait_count
�� 阻塞 • Sp_lock & sp_who 2 – lists real time blocks • Trace – for historical analysis ü Capture long blocks using the Trace Event “Block Process Report” ü Sp_configure “blocked process threshold”, 15 (seconds)
Tempdb� 源争� • Tempdb 在 SS 2005里使用量更大 • Tempdb 的配置更加重要 • 使用方式 1 2 3 4 5 6 7 8 9 10 11 12 13 DBCC CHECKDB - small change Internal objects: work file (hash join, SORT_IN_TEMPDB) Internal objects: work table (cursor, spool) - small changes Large object (LOB) variables Service Broker Temporary objects: global/local temp table, table variables Temporary objects: SPs and cursors - small changes Version store: General Version store: MARS Version store: Online index Version store: Row version based isolation levels Version store: Triggers XML
Tempdb使用�� • On line 索引重建: • 2 x-3 x size of index – Sort size, temp index and rollback • Versioning: • [Size of Version Store] = 2 * [Version store data generated per minute] * [Longest running time (minutes) of your transaction] * number of concurrent transactions/users • 可以通过Performance Monitor里面的counter进行监视 • 事先就设置好一个合适的大小,tempdb自动增长会严重 影响性能
�� tempdb使用情况DMV select sum(user_object_reserved_page_count)*8 as user_objects_kb, sum(internal_object_reserved_page_count)*8 as internal_objects_kb, sum(version_store_reserved_page_count)*8 as version_store_kb, sum(unallocated_extent_page_count)*8 as freespace_kb from sys. dm_db_file_space_usage where database_id = 2
�� tempdb使用情况DMV SELECT t 1. session_id, (t 1. internal_objects_alloc_page_count + task_alloc) as allocated, (t 1. internal_objects_dealloc_page_count + task_dealloc) as deallocated , t 3. sql_handle, t 3. statement_start_offset , t 3. statement_end_offset, t 3. plan_handle from sys. dm_db_session_space_usage as t 1, sys. dm_exec_requests t 3, (select session_id, sum(internal_objects_alloc_page_count) as task_alloc, sum (internal_objects_dealloc_page_count) as task_dealloc from sys. dm_db_task_space_usage group by session_id) as t 2 where t 1. session_id = t 2. session_id and t 1. session_id >50 and t 1. database_id = 2 --- tempdb is database_id=2 and t 1. session_id = t 3. session_id order by allocated DESC
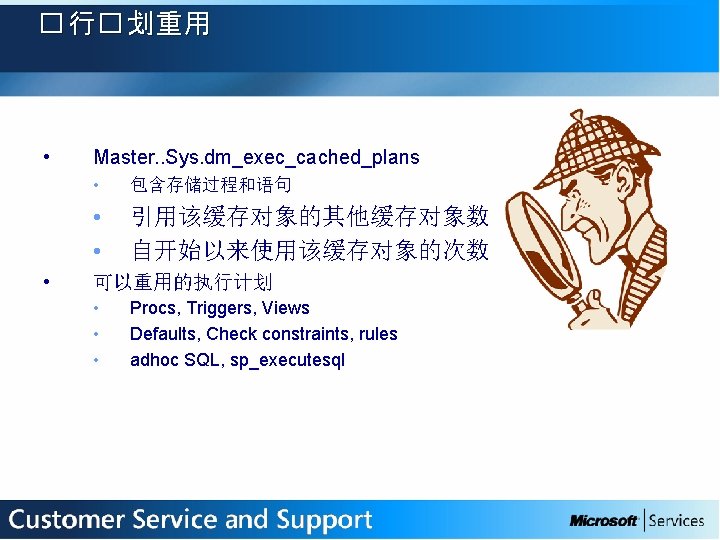
��� 划重用情况 • SQL Batch requests/sec • • SQL Compilations/sec • • 包含初始的compiles AND re-compiles 去掉re-compilations,能大致算出初始compiles的数目 在Sys. dm_exec_cached_plans里面找出usecounts最低的SQL语 句 SQL Re-compilations/sec • • • 和SQL Compilations/sec作对比 语句一级的Recompiles Check profiler for sp: recompile event to identify SQL statement. http: //www. microsoft. com/technet/prodtechnol/sql/2005/re comp. mspx
监视执行计划的compile和recompile • Perfmon: SQLServer: SQL Statistics • • Ratio of compiles / requests is important • • • Batch requests / sec { >1000’s/sec server is busy} SQL Compilations / sec {>10 s/sec could be problem} SQL Recompilations / sec {OLTP should avoid high recomps} Compiles – recompiles = initial compiles Plan re-use = (Batch requests – initial compiles) / Batch requests Recompile 的原因: • • 表格的定义发生变化 先前的并发计划需要串行执行 统计值更新过了 表格更新的行数超过了限度 – sysindexes. rowmodctr
使用SQL Trace� 察� 行� 划重用量 • 主要的event有: • • SP: Cache. Miss (event ID 34 in Profiler) SP: Cache. Insert (event ID 35 in Profiler) SP: Cache. Remove (event ID 36 in Profiler) SP: Recompile (event ID 37 in Profiler) SP: Cache. Hit (event ID 38 in Profiler) SP: Starting 标志一个stored procedure开始执行 SP: Stmt. Starting 标志单个语句开始执行 • Example: sequence is • • • SP: Stmt. Starting SP: Cache. Miss (no plan found) SP: Cache. Insert (plan created) 注意:使用SQL Profiler可能会影响SQL性能! 加入Eventsubclass 字段可以显示recompile的原因
Eventsubclass 字段显示recompile的原因 Event. Sub. Class Description 1 Schema changed. 2 Statistics changed. 3 Deferred compile. 4 SET option changed. 5 Temporary table changed. 6 Remote rowset changed. 7 FOR BROWSE permission changed. 8 Query notification environment changed. 9 Partitioned view changed. 10 Cursor options changed. 11 OPTION (RECOMPILE) requested.
有用的性能�� 器指� Memory: Page faults/sec Memory: pages/sec Physical Disk: Avg. Disk Queue Length Physical Disk: Avg. Disk sec/Transfer Physical Disk: Avg. Disk sec/Read Physical Disk: Avg. Disk sec/Write Physical Disk: Current Disk Queue Length Processor: %Processor Time SS Access Methods: Forwarded Records/sec SS Access Methods: Full Scans/sec SS Access Methods: Index Searches/sec SS Access Methods: Page Splits/sec SS Access Methods: Range Scans/sec SS Access Methods: Table Lock escalations/sec SS Buffer Manager: Checkpoint pages/sec SS Buffer Manager: Lazy writes/sec SS Buffer Manager: Page Life expectancy SS Buffer Node: Foreign Pages SS Buffer Node: Page Life expectancy SS Buffer Node: Stolen Pages SS Databases: Log Flush Wait time SS Databases: Log Flush Waits/sec SS General Statistics: User Connections SS Latches: Average Latch Wait Time(ms) SS Latches: Latch Waits/sec SS Latches: Total Latch Wait Time (ms) SS Locks: Average Wait Time(ms) SS Locks: Lock requests/sec SS Locks: Lock Wait Time (ms) SS Locks: Lock Waits/sec SS Memory Manager: Memory grants pending SS SQL Statistics: Auto-Params attempts/sec SS SQL Statistics: Batch requests/sec SS SQL Statistics: Safe Auto-Params/sec SS SQL Statistics: SQL Compilations/sec SS SQL Statistics: SQL Re-Compilations/sec System: Processor Queue Length
OLTP数据��� 指� Resource Issue Rule Description Source DB Design 1 经常有多个表格join的 Sys. dm_exec_sql_text 语句出现 Sys. dm_exec_cached_plans 2 经常更新的表格上有 很多index Sys. indexes sys. dm_db_operational_in dex_stats 3 作了太多的硬盘读写 range scans table scans Perfmon object • SQL Server Access Methods Problem Description 表格join次数太多,会 影响OLTP系统的性能 Index数目多,可以 提高查询速度,但是 会降低修改速度,增 加阻塞和死锁发生的 机率 Missing index, flushes cache Sys. dm_exec_query_stats 4 没有用的index * Sys. dm_db_index_usage_ stats Index maintenance for unused indexes
�� 系� 是否有IO瓶� Resourc e Issue Description Valu e 1 Avg Disk seconds / read > 10 ms Perfmon object • Physical Disk Reads should take 4 -8 ms with NO IO pressure 2 Avg Disk seconds / write > 10 ms Perfmon object Writes (sequential) can be as fast as 1 ms for transaction log. Big IOs range scans table scans >1 Perfmon object If Top 2 values for Wait stats includes: Top Rule 3 IO 4 ASYNCH_IO_COMPLETION LOGMGR WRITELOG PAGEIOLATCH_x Source • Physical Disk • SQL Server Access Methods 2 Sys. dm_os_wait_stats Problem Description Missing index, flushes cache If top 2 wait_stats values include IO, there is an IO bottleneck
判断系� 是否有阻塞� 生 Resource Issue Rule 1 2 Description Block percentage Block process report Blocking 3 Avg Row Lock Waits 4 If Top 2 values for wait stats are any of the following: 1. LCK_x Value >2 % Source Problem Description Sys. dm_db_index_oper Frequency of ational_stats blocks 30 • Sp_configure “blocked Report of long blocks e. g. sec process threshold” statements • profiler “blocked process report” > Sys. dm_db_index_oper Duration of blocks 100 ational_stats ms Top Sys. dm_os_wait_stats 2 If top 2 wait_stats values include locking, there is a blocking bottleneck
是否有CPU瓶� Resource Issue Rule 1 2 Description Value SUSPENDED state > Plan Re-use < sys. dm_os_workers 25% 90% CPU 3 Source > Parallelism: CXPACKET waits 5% Perfmon object • SQL Server Statistics Sys. dm_os_wait_stats Problem Description Time in runnable queue is pure CPU wait. OLTP identical transactions should ideally have >95% plan re-use Parallelism reduces OLTP throughput
是否有内存瓶� Resource Issue Rul e Description 2 Average Page Life Expectancy 3 Memory Grants Pending Perfmon object • SQL Server Buffer Mgr • SQL Server Buffer Nodes Drops by 50% Average Page Life Expectancy Source < 300 sec Memory 1 Val ue Perfmon object • SQL Server Buffer Mgr • SQL Server Buffer Nodes >1 Perfmon object • SQL Server Memory Manager Problem Description 1. Cache flush, due to big read 2. Possible missing index 1. Cache flush, due to big read 2. Possible missing index Current number of processes waiting for a workspace memory grant
Q&A
GTSC UNIVERSTIY Thank You!