
Growth monitoring definitions Growth is a sensitive indicator



- Slides: 19
Growth monitoring
definitions Growth is a sensitive indicator of health in childhood, as � normal growth can only occur if a child is healthy, adequately nourished and emotionally secure. � Growth Monitoring (GM) is the process of following the growth rate of a child in comparison to a standard by periodic, frequent anthropometric measurements in order to assess growth adequacy and identify faltering early. GM is not the infrequent or one-time anthropometric measurement of a child to assess nutritional status without assessing growth velocity over time. (That is nutritional status surveillance or nutrition assessment. ) �
�OR (GM) is the regular assessment of the child's physical growth to detect early growth faltering and to undertake appropriate actions. � Why do we monitor growth? - GM is the cornerstone of UNICEF and WHO child survival strategies -Growth promotion -Diagnosis and intervention - Education
Growth charts � Are useful tools to assess normal growth , determine deviations from normal , interpret health status and decide type of care or referral procedures. �Other uses of growth charts: Screening tool - Diagnostic tool - Educational tool - Evaluation tool - In research -
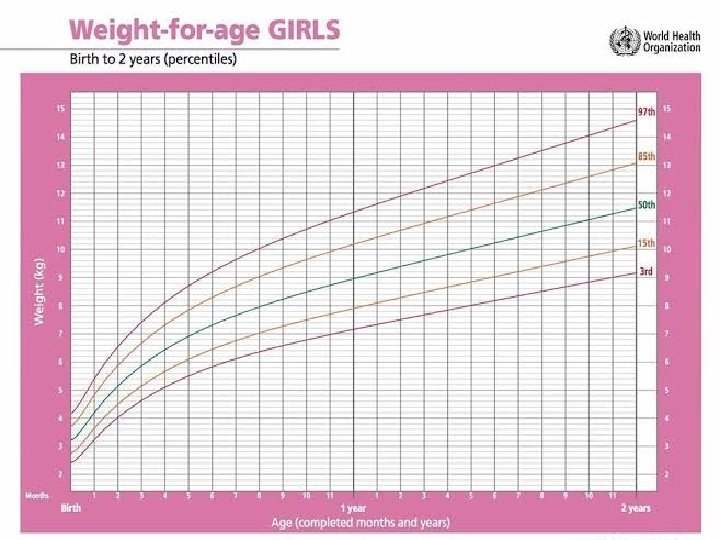
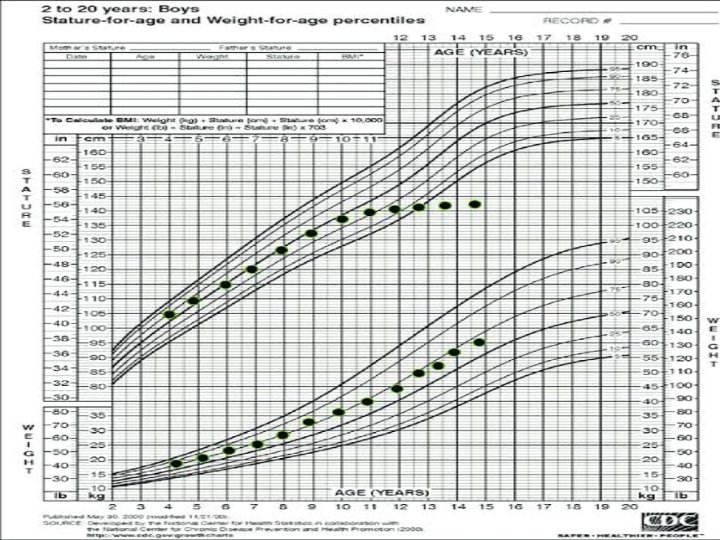
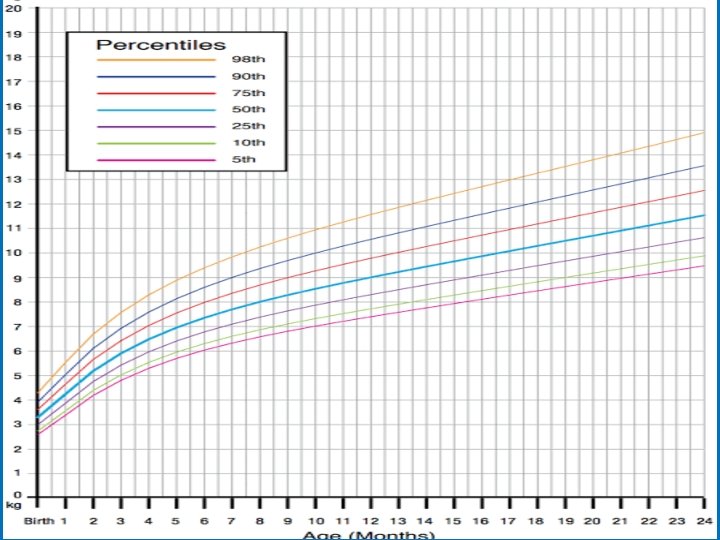
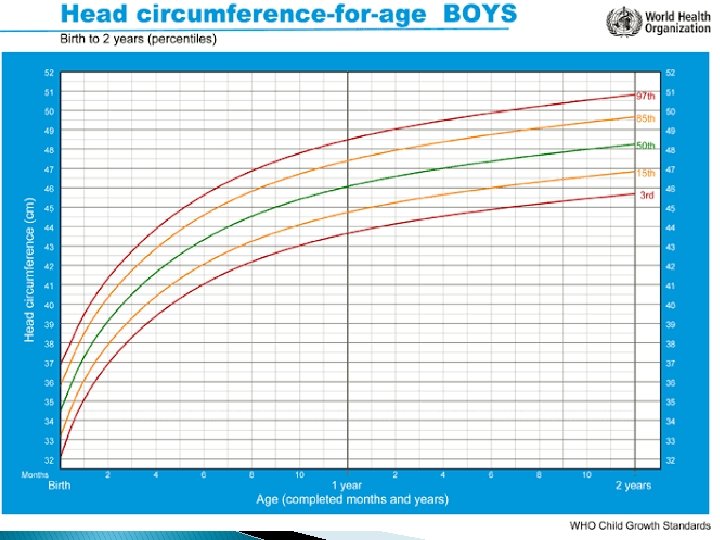
Interpreting and plotting growth charts �As a general rule, normally growing children follow individual growth trends that are parallel to the percentile lines on the growth charts. Most children track along the chart on, or between, the percentile lines and roughly on, or parallel to, the 50 th percentile.
Growth charts are not a sole diagnostic tool in determining healthy growth. Serial measures plotted onto growth charts should be used in conjunction with an overall assessment relating to the infant/child’s wellbeing, attainment of developmental concerns. milestones and any parental
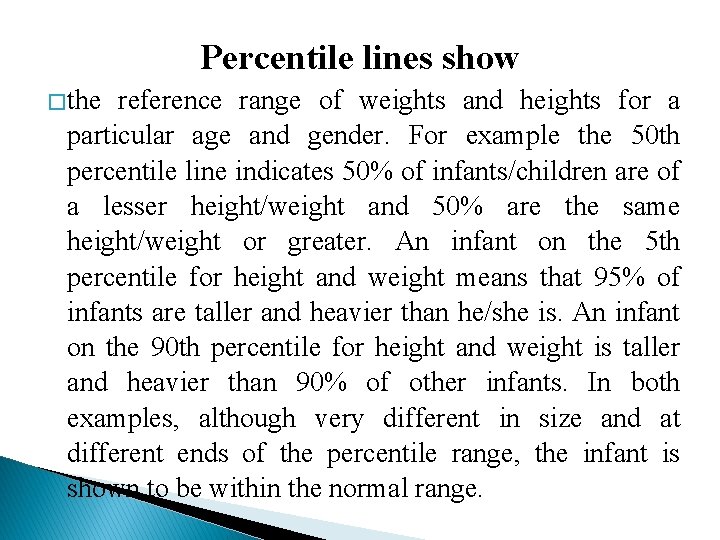
Percentile lines show � the reference range of weights and heights for a particular age and gender. For example the 50 th percentile line indicates 50% of infants/children are of a lesser height/weight and 50% are the same height/weight or greater. An infant on the 5 th percentile for height and weight means that 95% of infants are taller and heavier than he/she is. An infant on the 90 th percentile for height and weight is taller and heavier than 90% of other infants. In both examples, although very different in size and at different ends of the percentile range, the infant is shown to be within the normal range.
�As normal variations in height and weight are considerable, the percentile charts are drawn to depict the full range of normal growth. There is not a "right height and weight" for children at different ages because a healthy weight for a child depends on height, body build and health, not just age, so it is individual for each child. Most infants’ weight and length fall somewhere between the 3 rd and the 97 th percentile.
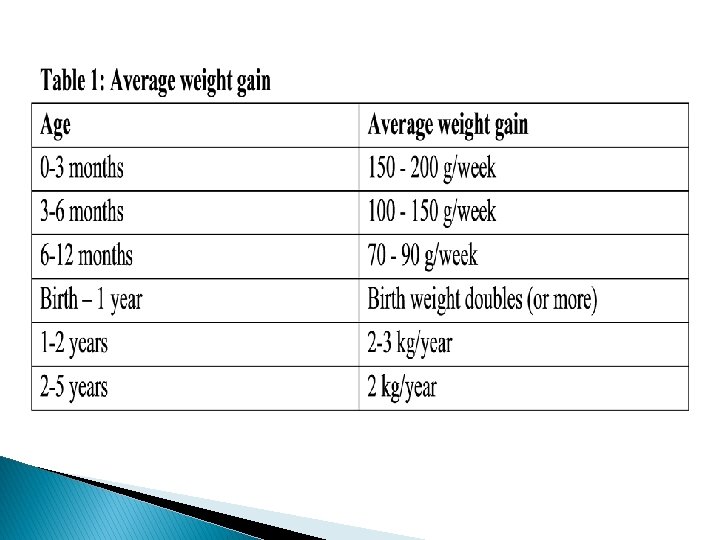
Normal weight patterns The following tables reflect average values only. Average weight gain in infants is generally calculated on a 4 week basis. The average weight gain from birth to 6 years is shown in Table 1 below, however, all babies grow differently and these are just general guidelines.
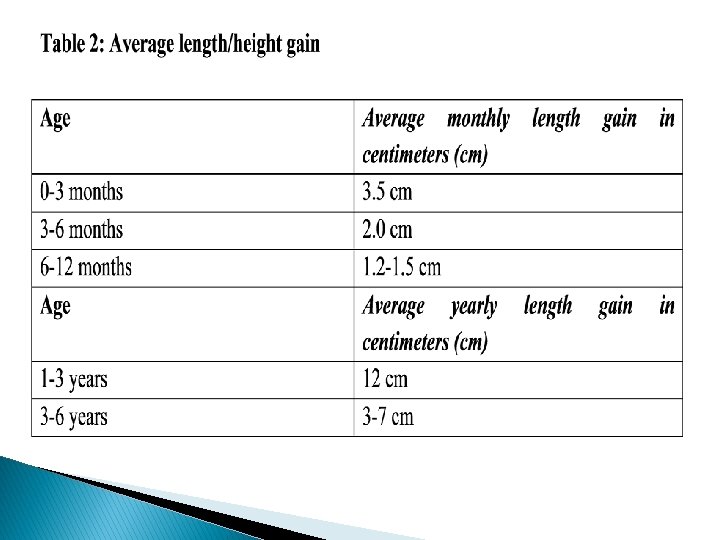
Normal linear (length and height) growth patterns Recumbent length should be measured in children under the age of 2 years rather than standing height because of the large observer error and the high degree of variability in the way the child will stand when held upright. Most children under 2 will not cooperate or be able to stand long enough to obtain an accurate standing height. A standing height should be obtained where the child is older than 2 years of age. The average length/height gain from birth to 6 years is shown in Table 2 below.
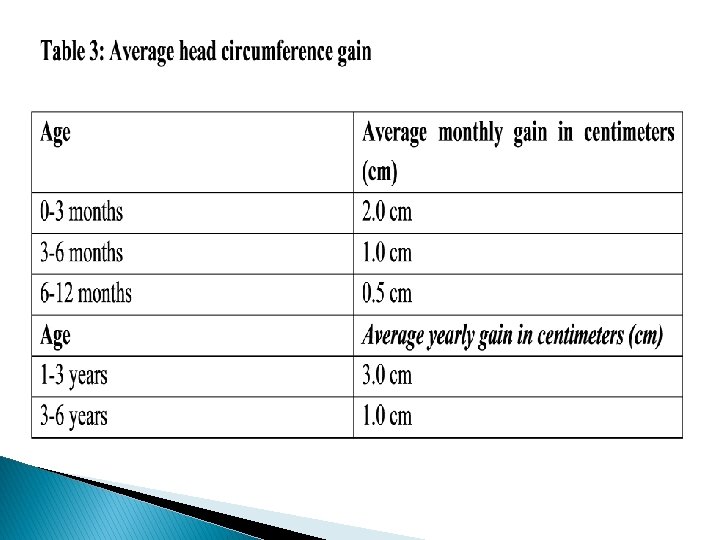
Normal head circumference patterns The head circumference measurement should fall between the lowest and highest percentiles on the growth charts, with growth velocity consistent with the child’s previous measurements and be comparable with the child’s height and weight percentile measurements. Table 3 below shows the average rate of interval growth in head circumference from infancy through to 6 years of age.