Growth and Physical Development of Children Semiotics Main
 of Deviation of Child’s")


 o o o weight; height")


 (months) Monthly For")
 (months) Monthly For the whole period 7 600 4900 8")


 (months) Monthly For")
 Monthly For the whole period 7 2 18. 5 8")


 as a")
.")

 o o Refers to the degree of dispersion of observations around")
 o o Failure to thrive Short stature")


 o o o Hypotrophy Paratrophy Obesity Nanism (dwarfism)")
 It is a pathological state resulting from a severe deprivation, or")
: it leads to birth of low-weight-birth babies. Aquired: as a")
 Grades Weight defficiency (weight-for-height index) Height defficiency")


 I 11 -20 II 21 -30 III")

 o o It is a disorder of physical development, which deals with")

- Slides: 58
Growth and Physical Development of Children. Semiotics (Main Clinical Features) of Deviation of Child’s Physical Development. Romaniuk Oksana MD, Ph. D Associate Professor Department of Pediatrics Sumy State University Medical Institute
o o Evaluation of the physical development is important for assessment of a child's health. It is necessary to understand the causes of all types of variability in the physical development. The knowledge of regularities in the physical development is necessary for correct estimation of the physical development of children of different age; this estimation should be used for characterizing the condition of children's health.
Growth o o It is a measure of physical development and maturation. It signifies an increase in size of the body and its various organs. Thus, it can be measured in terms of centimeters and kilograms.
Development o o o It is a measure of functional or physiological maturation. It signifies accomplishment of mental (acquisition of skills etc. ), emotional (development of attidudes etc. ) and social (adaptation to family and society etc. ) abilities. Unlike growth, it is rather difficult to assess development.
Maturation o o It literally means to ripen It is described as aging or as an increase in competence and adaptability. It is usually used to describe a qualitative change, that is, a change in the complexity of a structure that makes it possible for that structure to begin functioning or to function at a higher level.
Physical development o is a dynamical process of growth and biological maturation of a child usually referred to as a unit, express the sum of the numerous changes that take place during the different periods of childhood.
Factors Influencing Growth and Development 1. 2. 3. 4. 5. 6. 7. 8. Genetic Nutritional Socioeconomic Environmental and seasonal Chronic diseases Growth potentials Prenatal and intrauterine Emotional
The main criteria for assessment of physical development (growth) o o o weight; height (stature, head-to-heel length); head circumference (HC); chest circumference; proportionality of these measurements.
Weight. Body weight of fetus of 25 to 42 weeks of gestation can be calculated according to the empirical formula: o in average the body weight of 30 -weeks fetus is 1300 g, for each previous week minus 100 g, for each next add 200 g. For example: o Body weight of 26 -weeks fetus equals 1300 – 100 4 = 900 g; o Body weight of 35 -weeks fetus equals 1300 + 200 5 = 2300 g.
Measurements of a newborn child o o At birth weight is more variable than height and to a greater extent is a reflection of the intrauterine environment. The average newborn weighs 3200 to 3400 g (7 to 7. 5 pounds). Admissible limits of the norm range from 2700 to 4000 g. Babies, whose birth weight equals more than 4000 g, are called huge.
General Trends in Weight Gain During Infancy Age Weight gain (grams) (months) Monthly For the whole period 1 600 2 800 1400 3 800 2200 4 750 2950 5 700 3650 6 650 4300
Age Weight gain (grams) (months) Monthly For the whole period 7 600 4900 8 550 5450 9 500 5950 10 450 6400 11 400 6800 12 350 7150
Height Body length of fetus of 25 to 42 weeks of gestation can be calculated according to formula: L = gestation age (in weeks) + 10 cm; Or body length of fetus of first 5 months of gestation equals: L = (gestation age (in months)) 2. For fetus of 6 to 9 months of gestation: L= gestation age (in months) 5. For example: o Body length of 32 -weeks fetus equals 32+10=42 cm; o Body length of 3 months fetus equals 32=9 cm; o Body length of 7 months fetus equals 7 x 5=35 cm.
Body length of a newborn child o o o Birth length is influenced considerably by the prenatal environment and gestation age. It is of great value as a sign of maturity of newborn organism. Its normal rate in neonate is 50 to 52 cm. Admissible limits of the norm range from 46 to 56 cm.
General Trends in Height Gain During Infancy Age Height gain (grams) (months) Monthly For the whole period 1 3 3 2 3 4 5 6 3 9 2. 5 11. 5 2. 5 14 2. 5 16. 5
Age Height gain (grams) Monthly For the whole period 7 2 18. 5 8 2 20. 5 9 2 22. 5 10 1 -1. 5 23. 5 -24 11 1 -1. 5 24. 5 -25 12 1 -1. 5 25. 5 -27 (months)
Head circumference at birth is equal 34 to 36 cm. Age Infants Birth-6 months HC Monthly gain: 1. 5 cm Monthly gain: 0. 5 cm 6 -12 months Children 1 -5 years 6 -15 years Yearly gain: 1 cm Yearly gain: 0. 6 cm
Chest circumference at birth is equal 32 to 34 cm. Age Infants Birth-6 months Chest circumference Monthly gain: 2 cm Monthly gain: 0. 5 cm 6 -12 months Children 1 - 10 years 11 -15 years Yearly gain: 1. 5 cm Yearly gain: 3 cm
It is necessary to compare head circumference and chest circumference. o o o At birth HC exceeds chest circumference by 2 to 3 cm. At age 4 months HC equals chest circumference. Later, the rate of chest circumference increases rapidly, at the same time HC continues to grow at a slower rate. So, during childhood chest circumference exceeds HC by about 1 to 7 cm.
Methods of assessment of physical development of the child o o Anthropometrical indexes Percentile tables Standard growth charts Standard deviation
Growth chart It is of value to have serial record of child’s weight periodically on a “growth chart”(“Road to Healh” chart) which is based on percentile curves.
Growth Standard Charts WHO 2006 o WHO’ Growth Standards Charts were developed using data collected in the WHO Multicenter Growth Reference Study (MGRS) n o o MGRS collected data from 8500 children from different ethnic backgrounds and cultural settings WHO’ Growth Standards Charts establish breastfed infant as the “normative model” Growth Standards Charts are used to: n n n Monitor growth and nutritional wellbeing of each infant/child Provide accurate estimation of the nutritional status of a group (community/nation) estimating the level of under and/or overnutrition Advocate for the right for all children to achieve their full potential growth
Growth Indicators o 5 Growth indicators are used to assess growth: n n n o Length/height-for-age Weight-for-length/height BMI (body mass index)for-age Head circumference Growth indicators should be plotted regularly on specific gender charts( different charts for boy and girl)
Why Mother/Family Should Know the Child’ Growth Indicators? o o Mother/family are responsible for child appropriate feeding Mother/family are the key actors for child growth o Growth charts are a good supports for mother/family for appropriate care and feeding
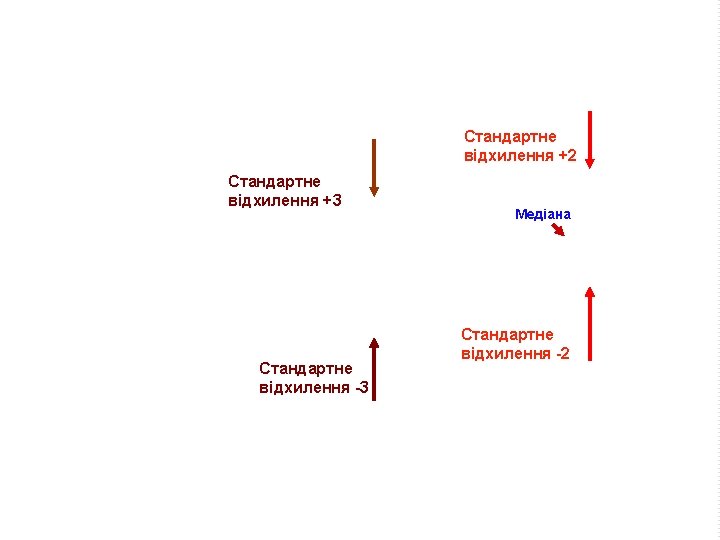
How to Read Growth Charts? o o The line 0 on each chart represents the median which is, in general “the average” The other lines are z-score lines which indicate distance from the average n o also called standard deviation (SD) lines Z-score and SD lines are numbered on
Weight-for-Age Chart o o Weight-for-age reflects body weight relative to the child’s age on a given day Use to assess: n n whether a child is underweight or severely underweight, but it is not used to classify a child as overweight or obese p. p. 23
How to Determine Weight for Age o o Calculate the child's age in months Weight the child naked or wearing light clothes n o Ask the mother to help remove any coat, sweater, or shoes Use the weight- for- Age chart, gender sensitive, to determine weight for age n n n Look at the left-hand axis to locate the line that shows the child's weight Look at the bottom axis of the chart to locate the line that shows the child's age in months Find the point on the chart where the line for the child's weight meets the line for the child's age
o o o If a variety of measurements such as weight, length or HC are assessed, then a normal bell-shaped distribution curve is found. The measurements are distributed symmetrically on each side of the mean, with a larger cluster around the mean. Such a typical distribution curve can also be presented as a percentile chart.
Height Velocity o o It is calculated from at least two accurate readings at a gap of 6 months (preferably one year). A velocity of less than 4 cm per year between 5 years of age and adolescence is considered pathologic.
Percentiles o o o A specific point in a distribution curve which has a given percentage of cases above and below it. The 50 th percentile is seen as the midpoint of a normal distribution curve with 50 % of cases above and 50 % of cases below it. The lower limit of normal is taken for practical purposes as the 3 rd percentile and the upper limit as the 97 th percentile. Only 3 % of normal cases fall below the 3 rd percentile and 3 % above the 97 th percentile.
A flat curve o It indicates a slowed or arrested growth which must alert the doctor to take action – both diagnostics and corrective.
The growth chart is primarily meant for the mother, to visualize and motivate concern for healthy growth in her child.
Body Ratios o They can be established by the mean of different indexes: n n n The index of fatness by Chulitska The index by Erismann Weight-for-height index Height-for-age index Stem stature index Span
Weight-for-height index o Percentage weight-for-height = Actual weight 100 divided by Expected weight for actual height
Height-for-age index o Percentage height-for-age = Actual height 100 divided by Expected height for child’s age
Stem stature index o o Refers to the sitting height (crown-rump length) as a percentage of the total height: I = SH/H 100 % Its normal values are: At birth 70 % 6 mo 66 % 1 yr 64 % 2 yrs 61 % 3 yrs 58 % 5 yrs 55 % Puberty 20 yrs 52 % 53 -54 %
Stem stature index o This index is increased in hypothyroidism and dwarfism (achondroplasia).
Span o o o It is the distance between tips of middle fingers when the arms are outstretched. It is equal to height at 10 years. In earlier years, it is 1 to 2 cm less than the height. After 12 years, it is 1 to 2 cm more then height. It is increased in spondyloepiphyseal dysplasia (Morquio disease).
Standard deviation (SD) o o Refers to the degree of dispersion of observations around the “mean”. The prefix (+) to the SD value indicates a dispersion to higher side whereas the prefix (-) denotes the same to lower side. n n n 1 SD signifies that about 68 % observations lie within this range. 2 SD includes about 95 % 3 SD as high as 99. 7 % of the cases.
Minor deviations of physical development (growth) o o Failure to thrive Short stature
Failure to Thrive o o It is applied to infants and young children usually up to the age of 2 or 3 years, who show failure of expected growth (usually weight gain) and striking lack of wellbeing. Simply put it describes a failure of expected normal growth and wellbeing. Remember that it is a descriptive and not diagnostic term.
Failure to Thrive o o It is also often used as synonym with the psychosomatic growth failure or maternal deprivation syndrome. Etiology: n n n Poor nutritional intake and feeding problems. Poverty, ignorance and conflict in the family. Parental neglect. Intestinal parasites infesting the child’s gut. Increased loss through vomiting or malabsorption. Poor utilization of food secondary to an underlying organic condition (e. g. Congenital heart desease) or chronic illness.
Short stature o o It is the equal delay of height and weight gain in children in comparison to the average data. The heightweight velocity curves of such children are within the 2 nd and the 3 rd percentiles. Etiology of small stature is heredity, lack of protein and vitamins intake during prenatal period and the 1 st year of life.
Short stature o Types: n n Primary short stature is usually due to an intrinsic defect in the sceletal system as a result of some genetic or prenatal damage (IUGR). Here, potential for normal bone growth is impaired though skeletal age is unaffected. Secondary short stature is characterized by impairment of bone age and height to the same extent.
Midparental height o o The so-called midparental height, a genetic component, gives the subject’s target height. It is determined as sum of father and mother’s heights plus 13 in case of boys and minus 13 in case of girls.
Major deviations of physical development (growth) o o o Hypotrophy Paratrophy Obesity Nanism (dwarfism) Gigantism
Protein-energy malnutrition (hypotrophia) It is a pathological state resulting from a severe deprivation, or impaired absorption, of protein or/and caloric food, which lead to weight reduction, wasting of subcutaneous fat and muscle, and stunting.
o o Prenatal (congenital): it leads to birth of low-weight-birth babies. Aquired: as a rule, develops after 3 rd month of child’s life.
Anthropometric classification of protein-energy malnutrition (hypotrophia ) Grades Weight defficiency (weight-for-height index) Height defficiency (height-for-age index) I 11 -20 % (90 -80 % of ideal WHI) (95 -90 %) II 21 -30 % (80 -70 %) 2 -4 сm (90 -85 %) III 31 % and more (less than 70 %) 7 -10 сm (less than 85 %) -
Clinical classification of protein-energy malnutrition 2 main syndromes: o Marasmus o Kwashiorkor
Paratrophy o o It is enlargement of body weight more than for 10 % of ideal weight. The main course of it is overfeeding of a baby. According to clinical signs paratrophy is divided into 2 types: lipomatic and lipomatic -pastose.
Paratrophy Stage of paratrophy Excessive weight (%) I 11 -20 II 21 -30 III 31 and more
Obesity o The presence of excessive weight in child older than 1 year is called obesity. Stages of obesity Excessive weight (%) I 10 -29 II 30 -49 III 50 -99 IV 100 and more
Nanism (dwarfism) o o It is a disorder of physical development, which deals with the delay of height below the 3 rd percentile for age according to international standard or 3 standard deviations of mean for age. The dwarf height in adult persons of white race is considered the height below 130 cm for male and below 120 cm for female.
Classification: o o dwarfism with proportional constitution; dwarfism with disproportional constitution.