Grouped Frequency Tables Tally Charts Demonstration This resource

Grouped Frequency Tables & Tally Charts – Demonstration This resource provides animated demonstrations of the mathematical method. Check animations and delete slides not needed for your class.

A computer game company wanted to know the ages of the people playing its game. The company took a sample of 20 people. 15, 18, 41, 28, 32, 16, 18, 22, 31, 25 14, 20, 45, 36, 27, 40, 19, 38, 29 How could we represent this data? We have a lot of unique values. 2 1 0 15 18 41 28 32 16 18 22 31 25 14 24 20 45 36 27 40 19 38 29 Frequency 3 Age

A computer game company wanted to know the ages of the people playing its game. The company took a sample of 20 people. 15, 18, 41, 28, 32, 16, 18, 22, 31, 25 14, 20, 45, 36, 27, 40, 19, 38, 29 We can group the data. What groups could we put the data into?

A computer game company wanted to know the ages of the people playing its game. The company took a sample of 20 people. 15, 18, 41, 28, 32, 16, 18, 22, 31, 25 14, 20, 45, 36, 27, 40, 19, 38, 29 The game company puts the data into 4 groups, what is the problem? 20 40 14 18 16 15 18 29 27 25 22 28 24 36 31 32 10 to 20 20 to 30 30 to 40 19 38 The groups cannot overlap. 41 45 40 to 50

A computer game company wanted to know the ages of the people playing its game. The company took a sample of 20 people. 15, 18, 41, 28, 32, 16, 18, 22, 31, 25 14, 20, 45, 36, 27, 40, 19, 38, 29 20 19 14 18 16 15 18 10 to 19 40 20 29 27 25 22 28 24 36 31 32 20 to 29 30 to 39 38 Grouping the data makes it easier to represent. 40 41 45 40 to 49

A computer game company wanted to know the ages of the people playing its game. The company took a sample of 20 people. Frequency 15, 18, 41, 28, 32, 16, 18, 22, 31, 25 14, 20, 45, 36, 27, 40, 19, 38, 29 7 6 5 4 3 2 1 0 10 -19 20 -29 30 -39 Age Group 40 -49

Mr Higgins records the test marks of 20 students. He puts the results into 4 groups. Is his representation of the data fair? 24 25 27 Frequency 20 to 29 9 8 7 6 5 4 3 2 1 0 30 33 34 34 48 41 50 42 52 61 40 55 72 87 84 82 87 30 to 39 40 to 79 80 to 99 The unequal group sizes makes 40 -79 over-represented. No students scored more than 90. 20 -29 30 -39 40 -79 Test Marks 80 -99

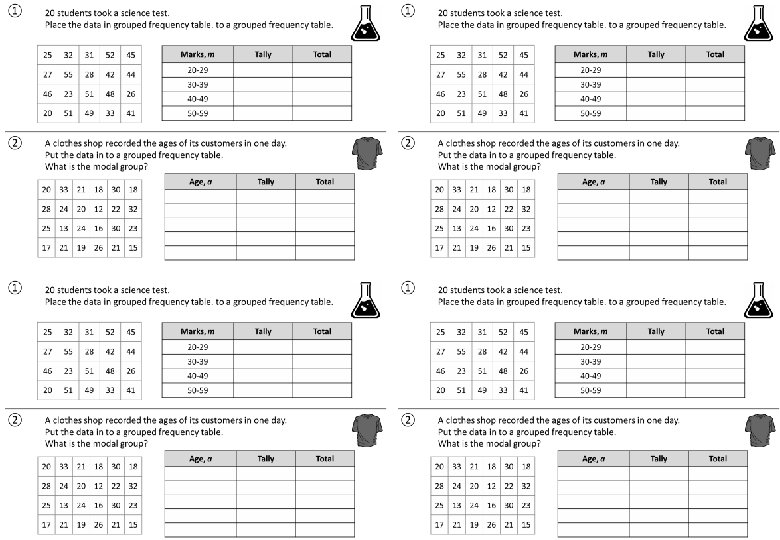
① ② 20 students took a science test. Place the data in grouped frequency table. to a grouped frequency table. 25 32 31 52 45 27 55 28 42 44 46 23 51 48 26 20 51 49 33 41 Marks, m Tally Total 20 -29 6 30 -39 3 40 -49 7 50 -59 4 A clothes shop recorded the ages of its customers in one day. Put the data in to a grouped frequency table. What is the modal group? 20 33 21 18 30 18 Age, a Tally Total 11 -15 3 28 24 20 12 22 32 16 -20 7 25 13 24 Modal 16 30 Group 23 21 -25 8 26 -30 4 31 -35 2 17 21 19 26 21 15

The post office records the weight of letters sent through the post. To monitor output, a sample of 20 letters is taken. 43. 2 g, 29. 5 g, 40. 0 g, 28. 1 g, 23 g, 35. 5 g, 52. 1 g, 21. 7 g, 25. 3 g, 32. 4 g 21. 1 g, 42. 6 g, 38. 1 g, 39. 2 g, 23. 7 g, 34. 5 g, 49. 1 g, 21. 3 g, 25. 9 g, 32. 2 g What groups could we put this data into? 20 to 29 g 30 to 39 g 40 to 49 g What is the problem with these groups? Some values are between the groups. 50 to 59 g

The post office records the weight of letters sent through the post. To monitor output, a sample of 20 letters is taken. 43. 2 g, 29. 5 g, 40. 0 g, 28. 1 g, 23 g, 35. 5 g, 52. 1 g, 21. 7 g, 25. 3 g, 32. 4 g 21. 1 g, 42. 6 g, 38. 1 g, 39. 2 g, 23. 7 g, 34. 5 g, 49. 1 g, 21. 3 g, 25. 9 g, 32. 2 g Continuous data like this can have an infinite number of values. The groups must be able to include any value. 29. 999 g 20 g 25 g 30 g 40. 0 g 35 g 40 g 50. 00001 g 45 g 50 g ‘Greater than 30, smaller than or equal to 40’ 55 g 60 g
 of its flowers after 2 weeks. One flower")
A flower-company measures the height (h) of its flowers after 2 weeks. One flower is 26. 7 cm in height. Place this piece of data on the number line. Which group would it go into? 26. 7 cm 20 cm 25 g 30 g 35 g 40 g 45 g 50 g 55 g 60 g
 of its flowers after 2 weeks. One flower")
A flower-company measures the height (h) of its flowers after 2 weeks. One flower is 50. 5 cm in height. Place this piece of data on the number line. Which group would it go into? 50. 5 cm 20 cm 25 g 30 g 35 g 40 g 45 g 50 g 55 g 60 g
 of its flowers after 2 weeks. One flower")
A flower-company measures the height (h) of its flowers after 2 weeks. One flower is 39. 9 cm in height. Place this piece of data on the number line. Which group would it go into? 39. 9 cm 20 cm 25 g 30 g 35 g 40 g 45 g 50 g 55 g 60 g
 of its flowers after 2 weeks. One flower")
A flower-company measures the height (h) of its flowers after 2 weeks. One flower is 50 cm in height. Place this piece of data on the number line. Which group would it go into? 50 cm 25 g 30 g 35 g 40 g 45 g 50 g 55 g 60 g
 of its flowers after 2 weeks. One flower")
A flower-company measures the height (h) of its flowers after 2 weeks. One flower is 30 cm in height. Place this piece of data on the number line. Which group would it go into? 30 cm 25 g 30 g 35 g 40 g 45 g 50 g 55 g 60 g
 of its flowers after 2 weeks. One flower")
A flower-company measures the height (h) of its flowers after 2 weeks. One flower is 40 cm in height. Place this piece of data on the number line. Which group would it go into? 40 cm 25 g 30 g 35 g 40 g 45 g 50 g 55 g 60 g

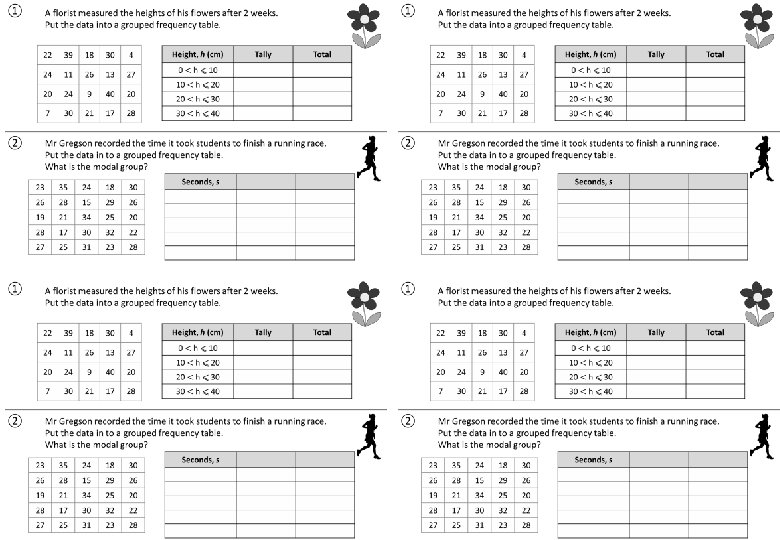
① A florist measured the heights of his flowers after 2 weeks. Put the data into a grouped frequency table. 22 39 18 30 4 24 11 26 13 27 20 24 9 40 20 7 30 21 17 28 ② Height, h (cm) Tally Total 3 6 9 2 Mr Gregson recorded the time it took students to finish a running race. Put the data in to a grouped frequency table. What is the modal group? 23 35 24 18 30 26 28 15 29 26 19 21 34 25 20 28 17 30 32 22 27 25 31 23 28 Modal Group Seconds, s Tally Total 1 4 7 9 4

Questions? Comments? Suggestions? …or have you found a mistake!? Any feedback would be appreciated . Please feel free to email: tom@goteachmaths. co. uk
- Slides: 20