Grouped Frequency Tables Averages Higher GCSE Questions These

Grouped Frequency Tables – Averages – Higher – GCSE Questions These questions are the same format as previous GCSE exams. COPY means they use the exact same numbers as the original GCSE question. Otherwise, they are clone questions using different numbers. The worksheets are provided in a variety of sizes.

Printing To print handouts from slides Select the slide from the left. Then click: File > Print > ‘Print Current Slide’ To print multiple slides Click on a section title to highlight all those slides, or press ‘Ctrl’ at the same time as selecting slides to highlight more than one. Then click: File > Print > ‘Print Selection’ To print double-sided handouts Highlight both slides before using ‘Print Selection’. Choose ‘Print on Both Sides’ and ‘Flip on Short Edge’.

GCSE 1 GCSE Edexcel Higher: November 2017 Paper 1, Q 5 The table shows information about the weekly earnings of 20 people who work in a business. 1 Edexcel Higher: November 2017 Paper 1, Q 5 The table shows information about the weekly earnings of 20 people who work in a business. Weekly earnings (£x) Frequency 50 < x ≤ 150 1 150 < x ≤ 250 13 250 < x ≤ 350 3 350 < x ≤ 450 0 450 < x ≤ 550 3 (a) Work out an estimate for the mean of the weekly earnings. £ £ (3) John says, “The mean may not be the best average to use to represent this information. ” (b) Do you agree with John? You must justify your answer. (1) (Total for Question 1 is 4 marks)
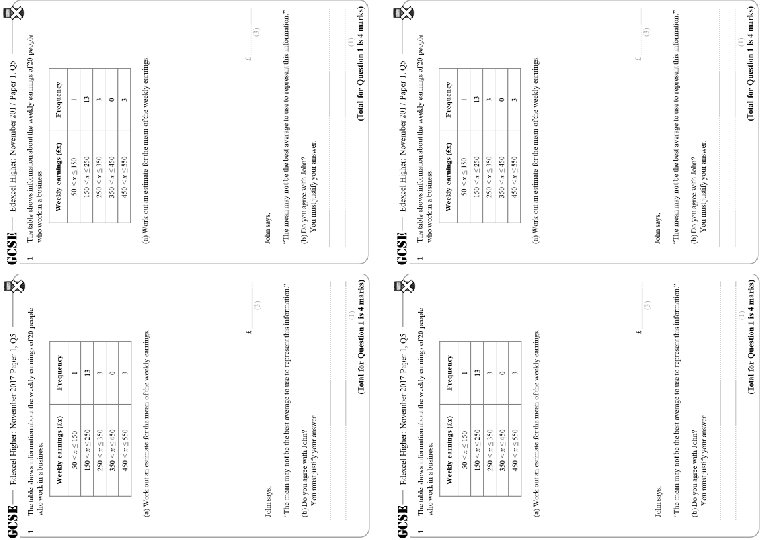

GCSE 1 Edexcel Higher: November 2017 Paper 1, Q 5 The table shows information about the weekly earnings of 20 people who work in a business. Weekly earnings (£x) Frequency 50 < x ≤ 150 1 150 < x ≤ 250 13 250 < x ≤ 350 3 350 < x ≤ 450 0 450 < x ≤ 550 3 (a) Work out an estimate for the mean of the weekly earnings. £ (3) John says, “The mean may not be the best average to use to represent this information. ” (b) Do you agree with John? You must justify your answer. (1) (Total for Question 1 is 4 marks)

GCSE 1 Edexcel Higher: November 2017 Paper 1, Q 5 The table shows information about the weekly earnings of 20 people who work in a business. Midpoint Weekly earnings (£x) 50 < x ≤ 150 < x ≤ 250 < x ≤ 350 < x ≤ 450 < x ≤ 550 Frequency 100 200 300 400 500 1 13 3 0 3 M x F 100 2600 900 0 1500 (a) Work out an estimate for the mean of the weekly earnings. Total = 5100 £ 255 (3) John says, “The mean may not be the best average to use to represent this information. ” (b) Do you agree with John? You must justify your answer. The median may be more representative because the mean is affected by extreme values (i. ie 3 people earning over £ 450. (1) (Total for Question 1 is 4 marks)

Questions? Comments? Suggestions? …or have you found a mistake!? Any feedback would be appreciated . Please feel free to email: tom@goteachmaths. co. uk
- Slides: 7