Grouped Frequency Tables Averages Higher GCSE Questions AQA

Grouped Frequency Tables – Averages – Higher – GCSE Questions – AQA These questions are the same format as previous GCSE exams. COPY means they use the exact same numbers as the original GCSE question. Otherwise, they are clone questions using different numbers. The worksheets are provided in 2 sizes.

Printing To print handouts from slides Select the slide from the left. Then click: File > Print > ‘Print Current Slide’ To print multiple slides Click on a section title to highlight all those slides, or press ‘Ctrl’ at the same time as selecting slides to highlight more than one. Then click: File > Print > ‘Print Selection’ To print double-sided handouts Highlight both slides before using ‘Print Selection’. Choose ‘Print on Both Sides’ and ‘Flip on Short Edge’.

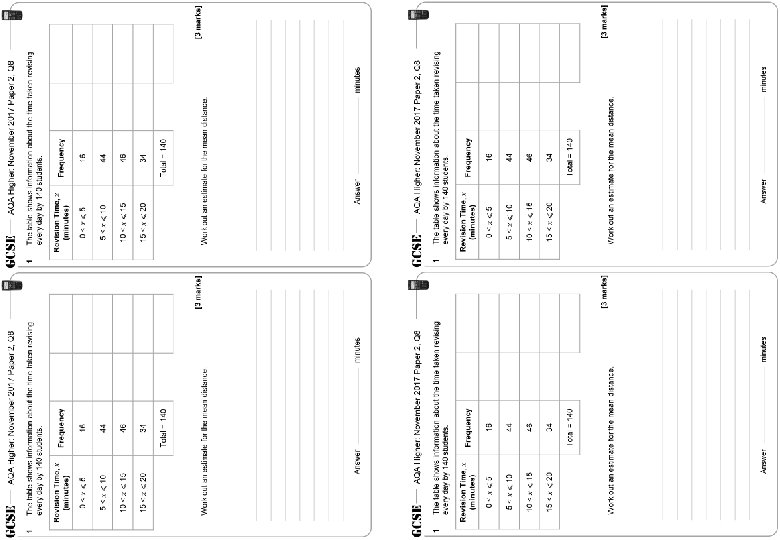
AQA Higher: November 2017 Paper 2, Q 8 1 AQA Higher: November 2017 Paper 2, Q 8 The table shows information about the time taken revising every day by 140 students. Frequency 16 16 44 44 46 46 34 34 Total = 140 [3 marks] Work out an estimate for the mean distance. Answer 1 minutes [3 marks] Work out an estimate for the mean distance. Answer minutes

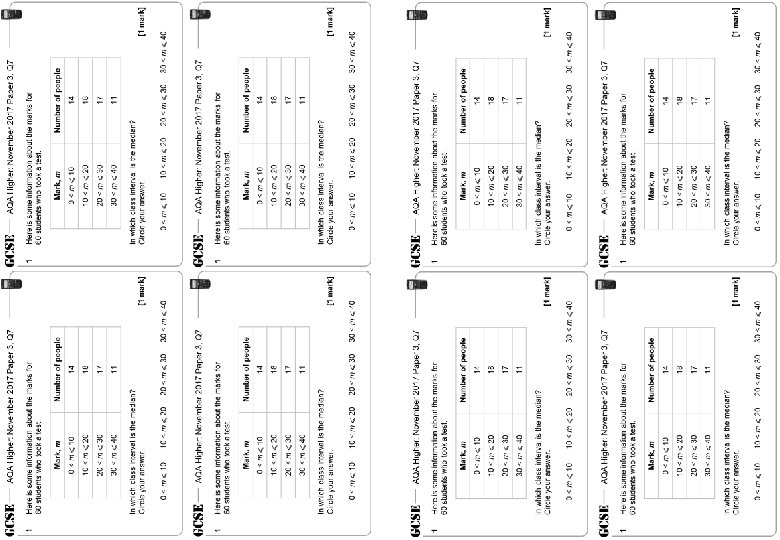
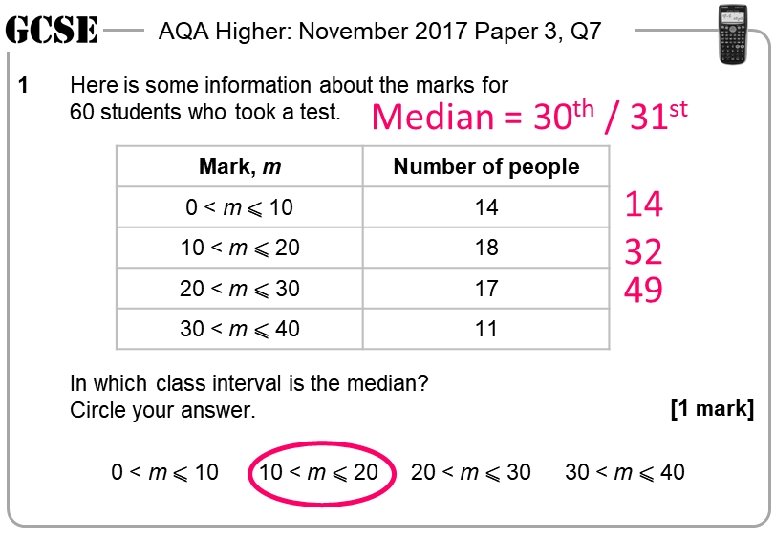
AQA Higher: November 2017 Paper 3, Q 7 1 AQA Higher: November 2017 Paper 3, Q 7 Here is some information about the marks for 60 students who took a test. 1 Mark, m Number of people 0 < m � 10 14 10 < m � 20 18 20 < m � 30 17 30 < m � 40 11 In which class interval is the median? Circle your answer. 0 < m � 10 10 < m � 20 In which class interval is the median? Circle your answer. [1 mark] 20 < m � 30 30 < m � 40 0 < m � 10 AQA Higher: November 2017 Paper 3, Q 7 1 Here is some information about the marks for 60 students who took a test. 10 < m � 20 [1 mark] 20 < m � 30 30 < m � 40 AQA Higher: November 2017 Paper 3, Q 7 Here is some information about the marks for 60 students who took a test. 1 Here is some information about the marks for 60 students who took a test. Mark, m Number of people 0 < m � 10 14 10 < m � 20 18 20 < m � 30 17 30 < m � 40 11 In which class interval is the median? Circle your answer. 0 < m � 10 10 < m � 20 20 < m � 30 [1 mark] 30 < m � 40

AQA Higher: November 2017 Paper 2, Q 8 1 The table shows information about the time taken revising every day by 140 students. Frequency 16 44 46 34 Total = 140 [3 marks] Work out an estimate for the mean distance. Answer minutes


AQA Higher: November 2017 Paper 2, Q 8 1 The table shows information about the time taken revising every day by 140 students. Frequency Midpoint m×f 16 2. 5 40 44 7. 5 330 46 12. 5 575 34 17. 5 595 1540 Total = 140 [3 marks] Work out an estimate for the mean distance. 1540 ÷ 140 students = 11 minutes Answer 11 minutes

Questions? Comments? Suggestions? …or have you found a mistake!? Any feedback would be appreciated . Please feel free to email: tom@goteachmaths. co. uk
- Slides: 11