Grouped Data Large quantities of data can be

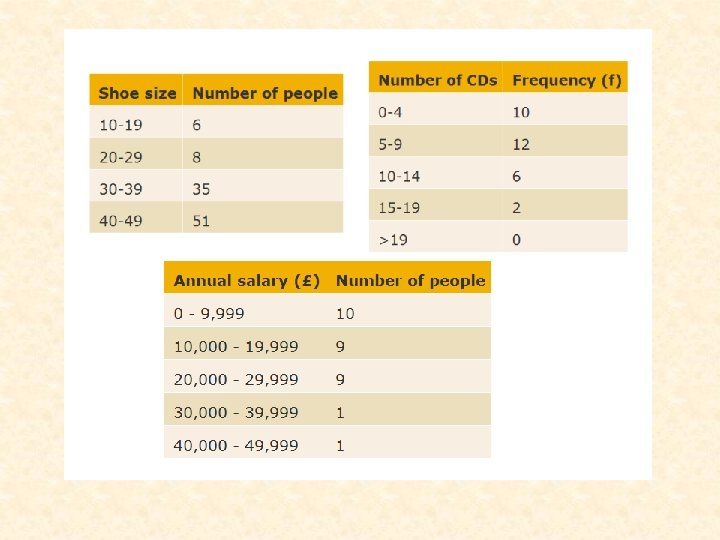
Grouped Data Large quantities of data can be much more easily viewed and managed if placed in groups in a frequency table. Grouped data does not enable exact values for the mean, median and mode to be calculated. Alternate methods of analyising the data have to be employed.

Estimating the Mean: An estimate for the mean can be obtained by assuming that each of the raw data values takes the midpoint value of the interval in which it has been placed.

Example 1. During 3 hours at Heathrow airport 55 aircraft arrived late. The number of minutes they were late is shown in the grouped frequency table below. Data is grouped into 6 class intervals of width 10. minutes late frequency 0 - 10 27 10 - 20 10 20 - 30 7 30 - 40 5 40 - 50 4 50 - 60 2

Example 1. During 3 hours at Heathrow airport 55 aircraft arrived late. The number of minutes they were late is shown in the grouped frequency table below. minutes Late frequency 0 - 10 27 5 135 10 - 20 10 15 150 20 - 30 7 25 175 30 - 40 5 35 40 - 50 4 50 - 60 2 45 55 175 180 midpoint(x) fx 110 Mean estimate = 925/55 = 16. 8 minutes

Example 2. A group of University students took part in a sponsored race. The number of laps completed is given in the table below. Use the information to calculate an estimate for the mean number of laps. Data is grouped into 8 class intervals of width 4. number of laps frequency (x) 1 -5 2 6 – 10 9 11 – 15 15 16 – 20 20 21 – 25 17 26 – 30 25 31 – 35 2 36 - 40 1

Example 2. A group of University students took part in a sponsored race. The number of laps completed is given in the table below. Use the information to calculate an estimate for the mean number of laps frequency 1 -5 2 6 – 10 9 11 – 15 15 16 – 20 20 21 – 25 17 26 – 30 25 31 – 35 2 36 - 40 1 midpoint(x) 3 8 13 18 23 28 33 38 mp x f 6 72 195 360 391 700 66 38 Mean estimate = 1828/91 = 20. 1 laps

Grouped Data Example 1. During 3 hours at Heathrow airport 55 aircraft arrived late. The number of minutes they were late is shown in the grouped frequency table below. minutes Late frequency 0 - 10 27 10 - 20 10 20 - 30 7 30 - 40 5 40 - 50 4 50 - 60 2 midpoint(x) mp x f

Grouped Data Example 2. A group of University students took part in a sponsored race. The number of laps completed is given in the table below. Use the information to: (a) Calculate an estimate for the mean number of laps. (b) Determine the modal class. (c) Determine the class interval containing the median. number of laps frequency 1 -5 2 6 – 10 9 11 – 15 15 16 – 20 20 21 – 25 17 26 – 30 25 31 – 35 2 36 - 40 1 midpoint(x) mp x f
- Slides: 9