GROUNDWATER WHAT IS THE CHART SHOWING Water table

GROUNDWATER

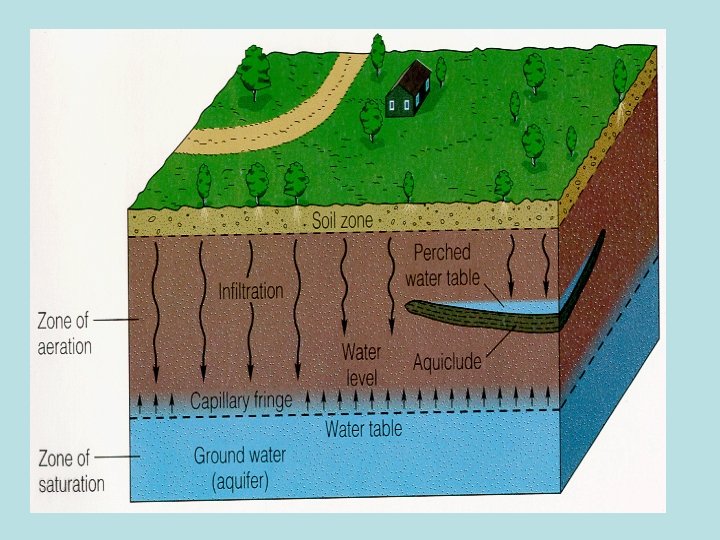
WHAT IS THE CHART SHOWING?

Water table Zone of aeration Zone of saturation Water table

Water table • What will make the water table rise? • http: //techalive. mtu. ed u/meec/module 06/Th e. Water. Table. htm • What will make the water table lower?

Groundwater affects surface water

Permeability

permeability • http: //techalive. mtu. edu/meec/module 06/P ermeability. htm

AQUIFERS • Ogallala Aquifer! • Needs to be below water table in a permeable layer • Ogallala aquifer”fastest disappearing aquifer in the world”

WELLS • Needs to be in an aquifer http: //techalive. mtu. edu/meec/module 06/Well. Drilling. htm

PUMPING WELLS • Creates cone of depression • Lowers water table • Creates a “drawdown”

Formation of a cone of depression in the water table

Cone of depression

subsidence • Pumping out gw lowers the surface • Surface Slowly sinks

Artesian wells • Flows to the surface naturally • Under pressure • “sandwiched” between two impermeable layers
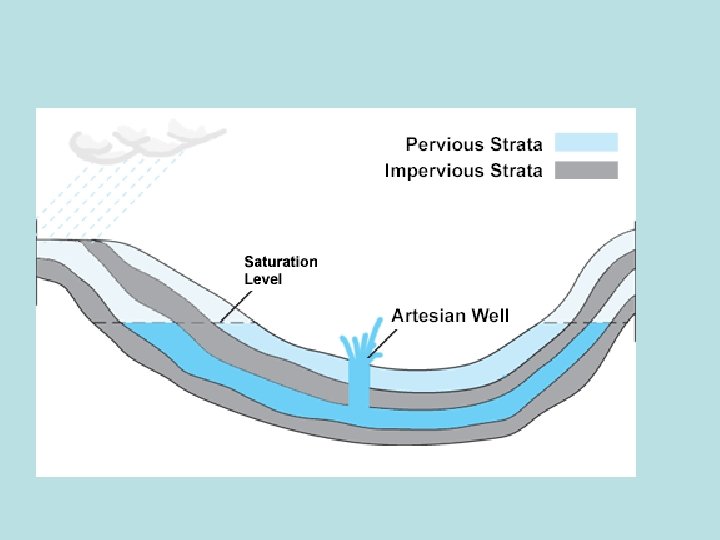

Flowing vs. non flowing

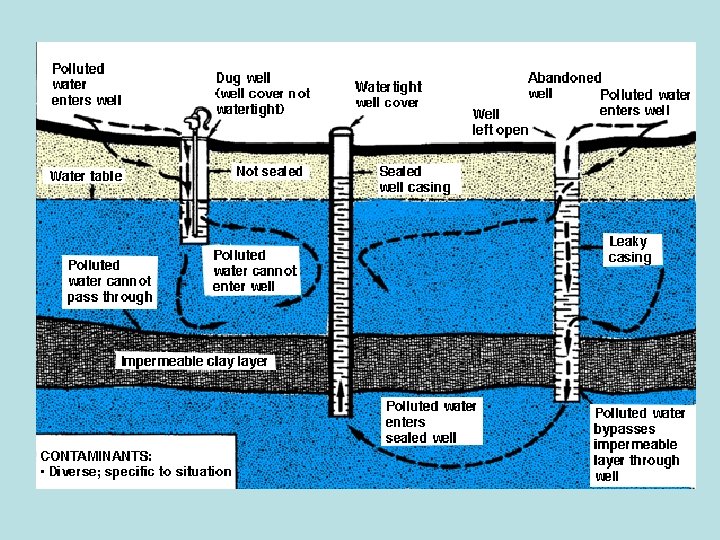
GROUNDWATER POLLUTION • SOURCES – – Septic tanks Landfills Fertilizers/pesticides Underground storage tanks (gas stations)

Septic tanks

landfills

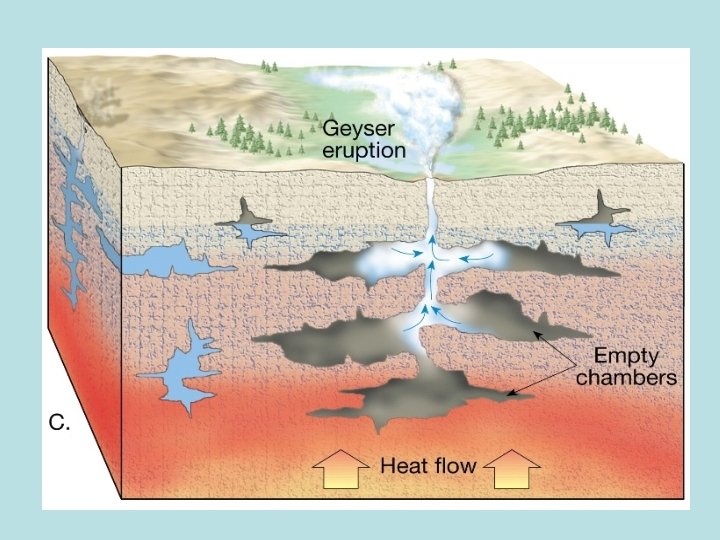
Hot springs and geysers • Groundwater heated by magma reaches the surface

Steamboat, CO

OLD FAITHFUL • Webcam: http: //www. nps. gov/fe atures/yell/webcam/ol d. Faithful. Streaming. ht ml • Eruptions every 45 -90 minutes apart • Time is increasingwhy? • http: //upload. wikimedi a. org/wikipedia/comm ons/transcoded/4/46/ Old. Faithful. ogg/Old. Fa ithful. ogg. 360 p. webm

• http: //highered. mcgrawhill. com/sites/0072402466/student_view 0/ chapter 11/animations_and_movies. html#
- Slides: 26