
GROSS CAPITAL FORMATION Prepared by National Accounts Statistics
GROSS CAPITAL FORMATION Prepared by : National Accounts Statistics Division, Department of Statistics, Malaysia 26 th April 2011 DEPARTMENT OF STATISTICS, MALAYSIA
OUTLINE 1. INTRODUCTION 2. GROSS CAPITAL FORMATION (GCF) 3. GFCF – TYPES OF ASSET (SNA 1993) 4. COMPONENT OF GFCF ESTIMATE 5. GFCF - DATA SOURCE (ANNUAL/QUARTERLY) 6. PUBLIC vs PRIVATE GFCF 7. CHANGE IN INVENTORIES 8. DATA SOURCE 2
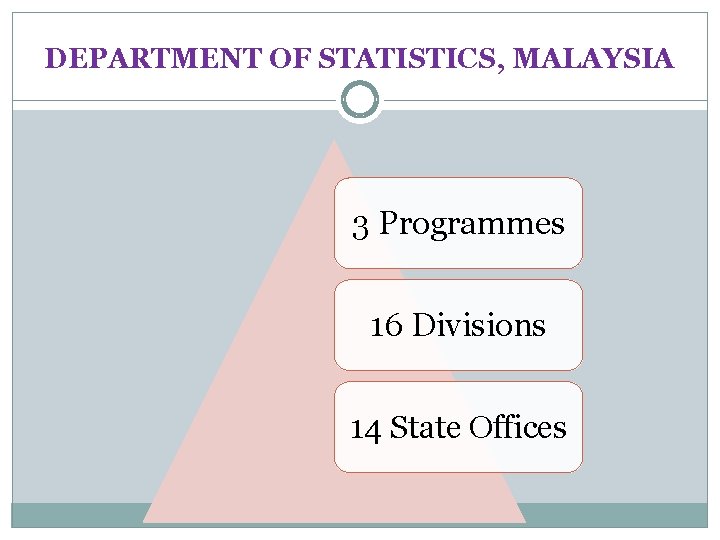
DEPARTMENT OF STATISTICS, MALAYSIA 3 Programmes 16 Divisions 14 State Offices

ORGANISATION DEPARTMENT OF STATISTICS, MALAYSIA
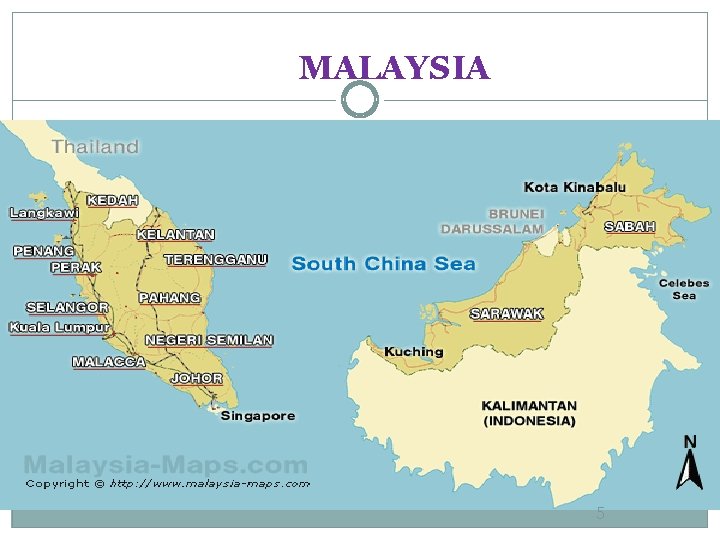
MALAYSIA 5

NATIONAL ACCOUNTS DIVISION Annual & Quarterly GDP Interim Accounts Section State GDP Backcasting & Seasonal Non-Observed Economy Adjustment Senior Director Integration Accounts Section Tourism Satellite Accounts Capital Stock Social Accounting Matrices
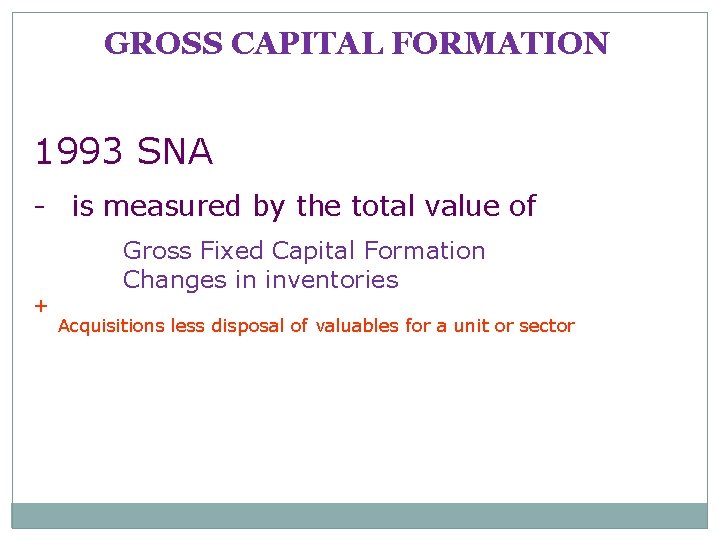
GROSS CAPITAL FORMATION 1993 SNA - is measured by the total value of + Gross Fixed Capital Formation Changes in inventories Acquisitions less disposal of valuables for a unit or sector
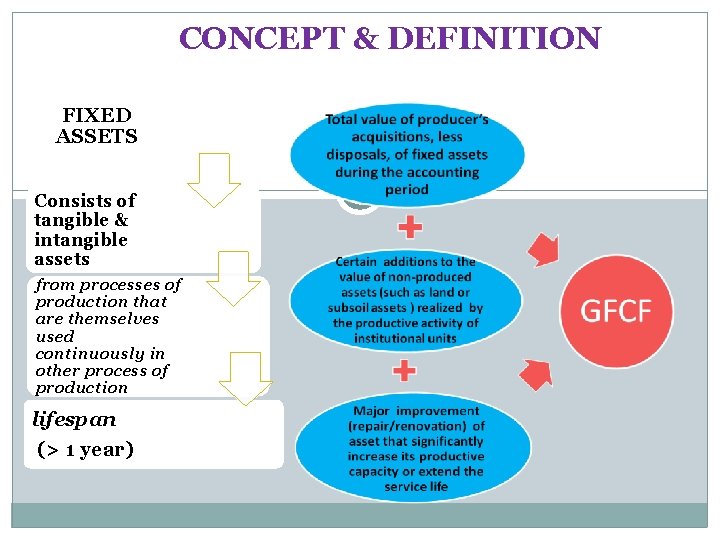
CONCEPT & DEFINITION FIXED ASSETS Consists of tangible & intangible assets from processes of production that are themselves used continuously in other process of production lifespan (> 1 year)
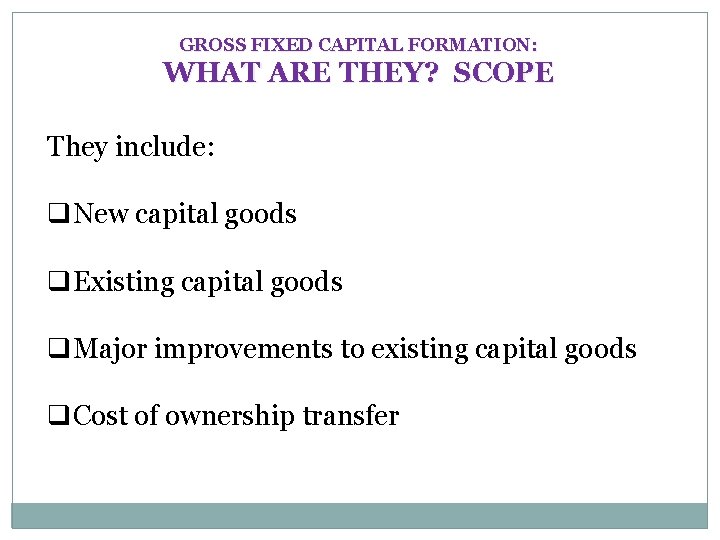
GROSS FIXED CAPITAL FORMATION: WHAT ARE THEY? SCOPE They include: q. New capital goods q. Existing capital goods q. Major improvements to existing capital goods q. Cost of ownership transfer
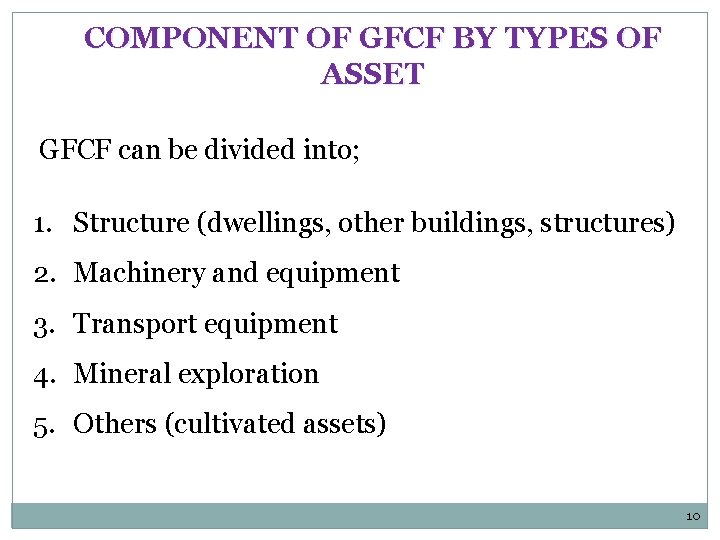
COMPONENT OF GFCF BY TYPES OF ASSET GFCF can be divided into; 1. Structure (dwellings, other buildings, structures) 2. Machinery and equipment 3. Transport equipment 4. Mineral exploration 5. Others (cultivated assets) 10
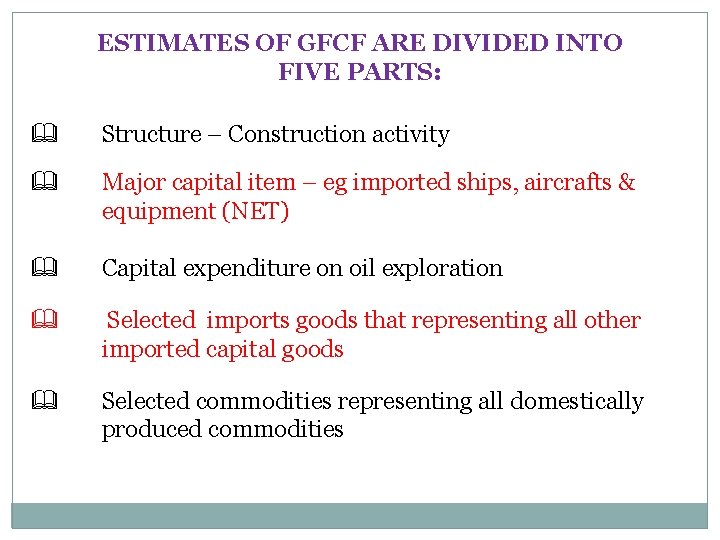
ESTIMATES OF GFCF ARE DIVIDED INTO FIVE PARTS: Structure – Construction activity Major capital item – eg imported ships, aircrafts & equipment (NET) Capital expenditure on oil exploration Selected imports goods that representing all other imported capital goods Selected commodities representing all domestically produced commodities

DATA SOURCES QUARTERLY GROSS FIXED CAPITAL FORMATION • Monthly Manufacturing Survey • Monthly Trade Statistics • Quarterly Services Survey • Bank Negara Malaysia’s Oil & Gas Survey • Quarterly Construction Survey • Survey on Quarterly NFPE’s CAPEX • Federal Government Accounts ANNUAL • I-O Table 2000 • Quarterly Services Survey • Bank Negara Malaysia’s Oil & Gas Survey • Annual/Biennial Survey & Census • Financial Accounts of Federal Gov. , States Gov. , Local Authorities & Statutory Bodies • Annual National Account • Survey on NFPE’s CAPEX 12
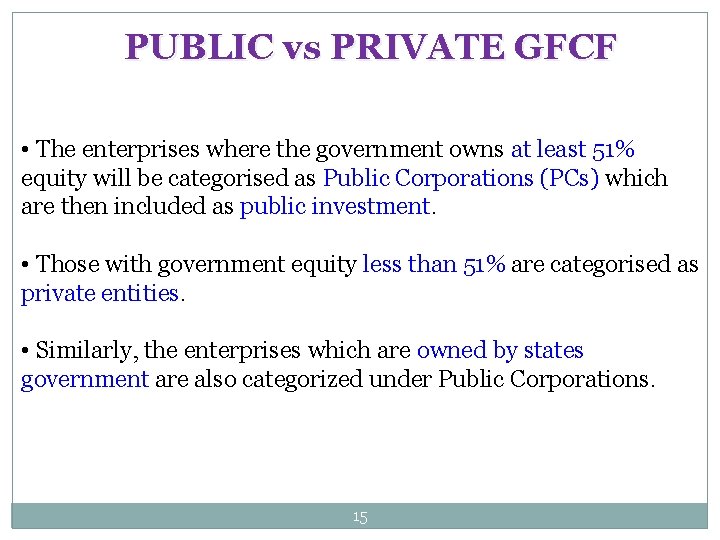
PUBLIC vs PRIVATE GFCF • The enterprises where the government owns at least 51% equity will be categorised as Public Corporations (PCs) which are then included as public investment. • Those with government equity less than 51% are categorised as private entities. • Similarly, the enterprises which are owned by states government are also categorized under Public Corporations. 15
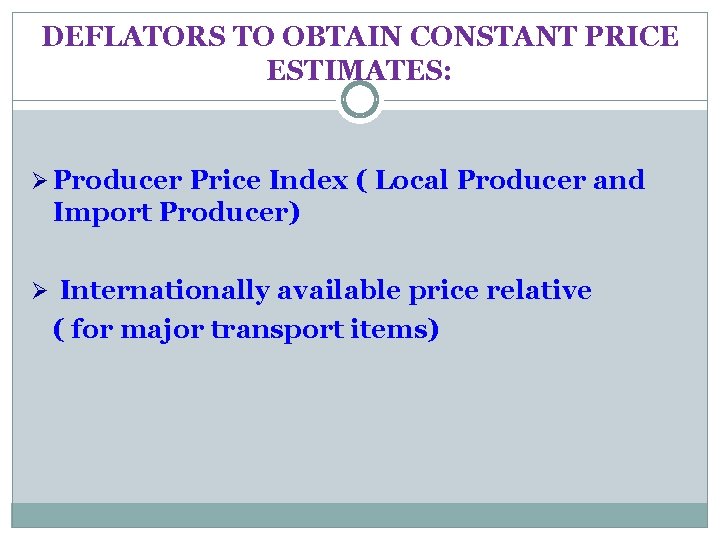
DEFLATORS TO OBTAIN CONSTANT PRICE ESTIMATES: Ø Producer Price Index ( Local Producer and Import Producer) Ø Internationally available price relative ( for major transport items)
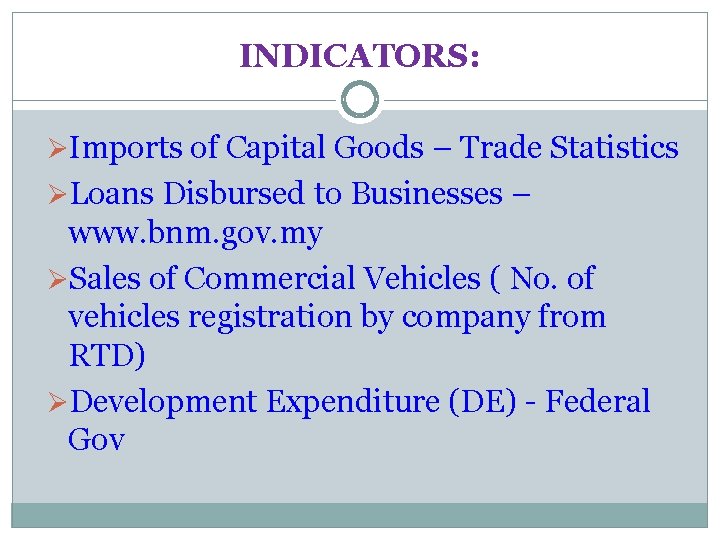
INDICATORS: ØImports of Capital Goods – Trade Statistics ØLoans Disbursed to Businesses – www. bnm. gov. my ØSales of Commercial Vehicles ( No. of vehicles registration by company from RTD) ØDevelopment Expenditure (DE) - Federal Gov
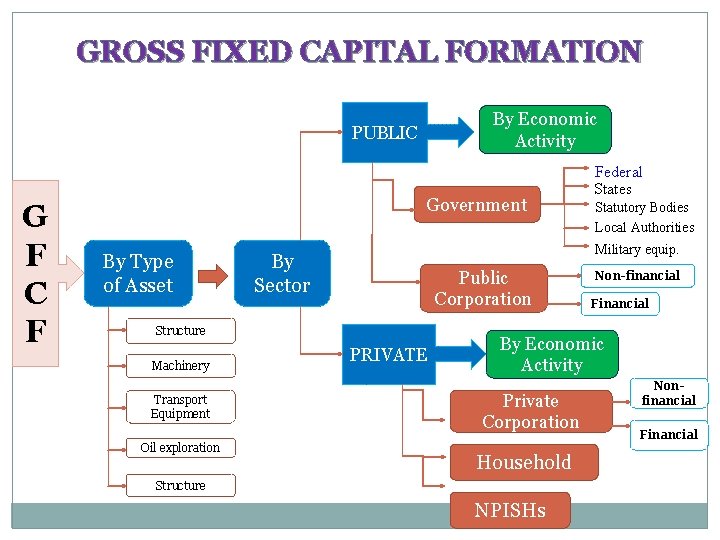
GROSS FIXED CAPITAL FORMATION By Economic Activity PUBLIC G F C F Government By Type of Asset Transport Equipment Oil exploration Statutory Bodies Local Authorities Military equip. By Sector Public Corporation Structure Machinery Federal States PRIVATE Non-financial Financial By Economic Activity Private Corporation Household Structure NPISHs Nonfinancial Financial
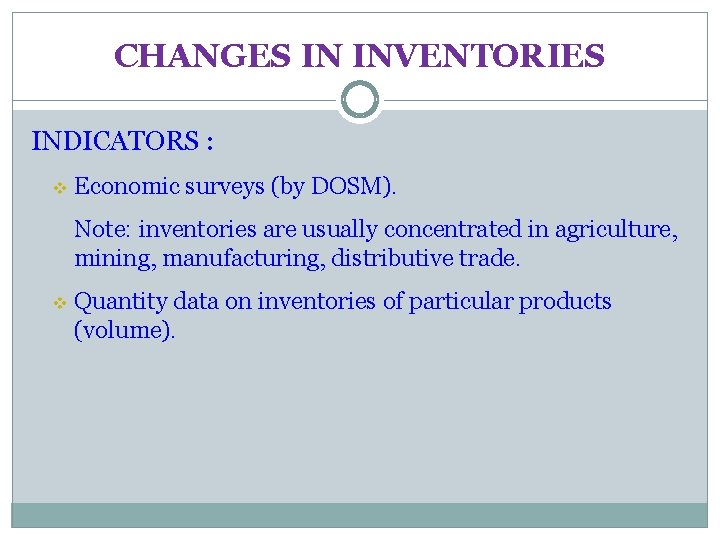
CHANGES IN INVENTORIES INDICATORS : v Economic surveys (by DOSM). Note: inventories are usually concentrated in agriculture, mining, manufacturing, distributive trade. v Quantity data on inventories of particular products (volume).
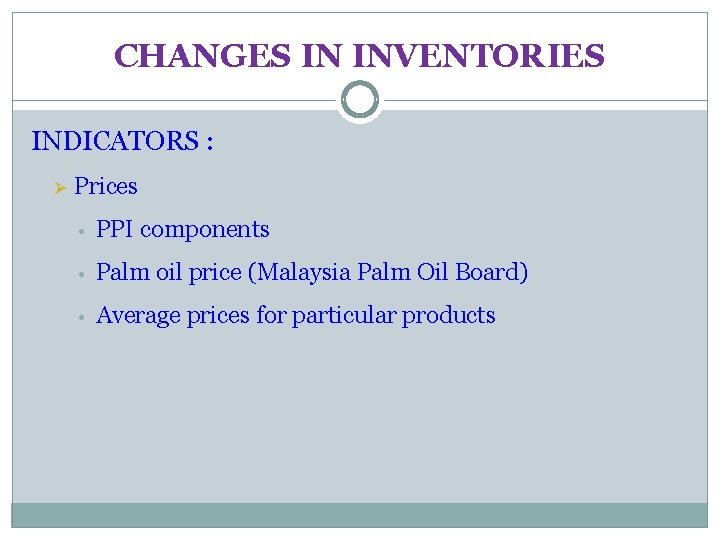
CHANGES IN INVENTORIES INDICATORS : Ø Prices • PPI components • Palm oil price (Malaysia Palm Oil Board) • Average prices for particular products
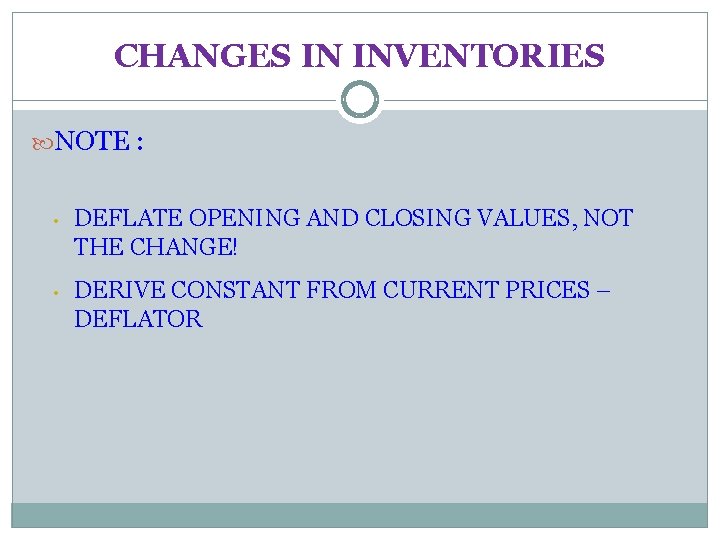
CHANGES IN INVENTORIES NOTE : • DEFLATE OPENING AND CLOSING VALUES, NOT THE CHANGE! • DERIVE CONSTANT FROM CURRENT PRICES – DEFLATOR
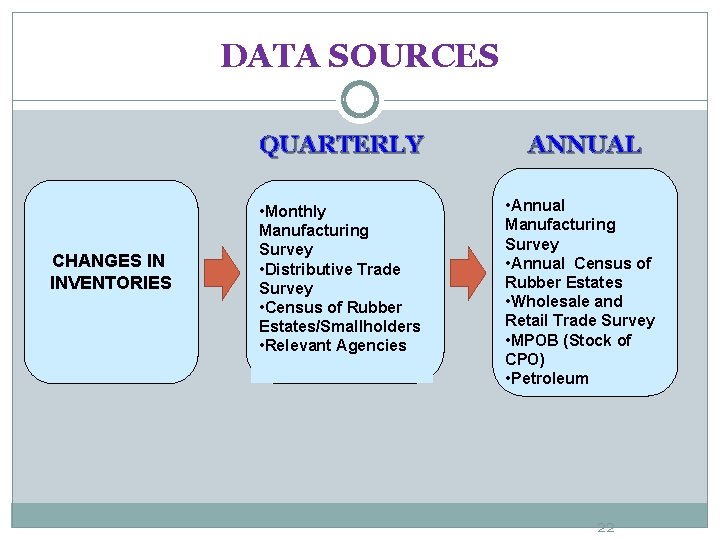
DATA SOURCES QUARTERLY CHANGES IN INVENTORIES • Monthly Manufacturing Survey • Distributive Trade Survey • Census of Rubber Estates/Smallholders • Relevant Agencies ANNUAL • Annual Manufacturing Survey • Annual Census of Rubber Estates • Wholesale and Retail Trade Survey • MPOB (Stock of CPO) • Petroleum 22
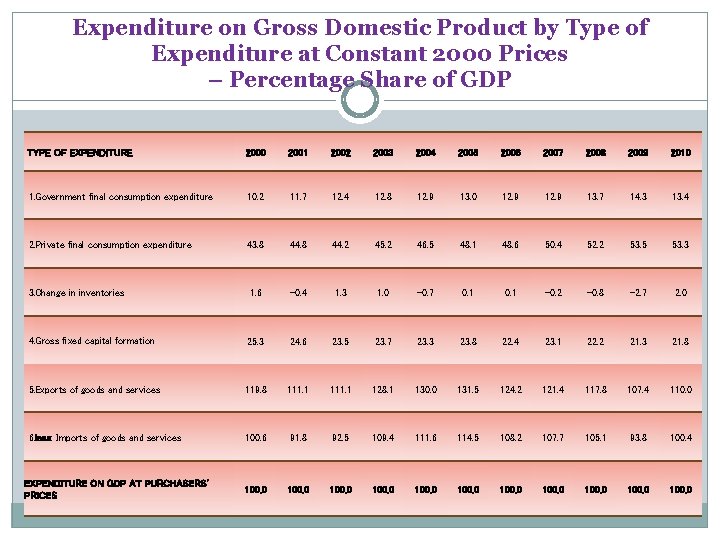
Expenditure on Gross Domestic Product by Type of Expenditure at Constant 2000 Prices – Percentage Share of GDP TYPE OF EXPENDITURE 2000 2001 2002 2003 2004 2005 2006 2007 2008 2009 2010 1. Government final consumption expenditure 10. 2 11. 7 12. 4 12. 8 12. 9 13. 0 12. 9 13. 7 14. 3 13. 4 2. Private final consumption expenditure 43. 8 44. 2 45. 2 46. 5 48. 1 48. 6 50. 4 52. 2 53. 5 53. 3 3. Change in inventories 1. 6 -0. 4 1. 3 1. 0 -0. 7 0. 1 -0. 2 -0. 8 -2. 7 2. 0 4. Gross fixed capital formation 25. 3 24. 6 23. 5 23. 7 23. 3 23. 8 22. 4 23. 1 22. 2 21. 3 21. 8 5. Exports of goods and services 119. 8 111. 1 128. 1 130. 0 131. 5 124. 2 121. 4 117. 8 107. 4 110. 0 6. less: Imports of goods and services 100. 6 91. 8 92. 5 109. 4 111. 6 114. 5 108. 2 107. 7 105. 1 93. 8 100. 4 100. 0 100. 0 EXPENDITURE ON GDP AT PURCHASERS' PRICES
THANK YOU 24
- Slides: 24