Green Roofs A Stormwater BMP Albert R Jarrett

Green Roofs: A Stormwater BMP Albert R. Jarrett Professor of Agricultural Engineering Penn State University arj@psu. edu www. abe. psu. edu/fac/Jarrett. html
 l Vegetation l Functioning System")
What is a Green Roof? l Soil (growth medium) l Vegetation l Functioning System

Green Roof Types Extensive – large areas Intensive – roof gardens

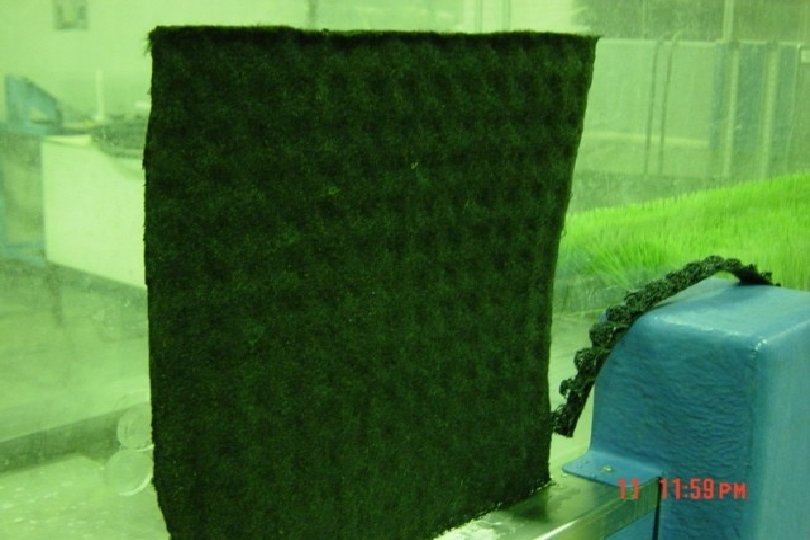
Typical Extensive Green Roof Vegetation Growth Medium Drainage Layer Waterproof Membrane and Root Barrier

Drainage Layer l ½-inch plastic wire grid. l Geotextile glued to grid. l Porosity = 78% l Field Capacity = 5%

Media l 12. 5% sphagnum peat moss l 12. 5% coir l 15% perlite l 60%hydrolite – 6. 23 lb/in-ft 2 – Saturated l Porosity = 55% l Field Capacity = 34%
 Plants – Arid Region (Desert) Plants")
Green Roof Plants l Crassulacae Acid Metabolism (CAM) Plants – Arid Region (Desert) Plants – Stomates open at night (to reduce water loss). – Stomates close during day (to conserve water). – Plants get smaller as water becomes limiting.

Benefits l Attenuate stormwater – Runoff volume reduction. – Peak runoff rate reduction. – Delay the runoff event. – Delay the peak runoff rate.

Impact of Development Post-Development Runoff Pre-Development Runoff

Traditional Stormwater Management Delay

Green Roof Stormwater Management l To understand how a Green Roof can help us manage stormwater, we must look at stormwater in three different ways: – Individual storms (actual data collected). – Annual rainfall basis. – Extreme storm effects.
 l Green roofs compared to non-green (traditional) roofs – Stormwater")
Individual Storm (Measured Data) l Green roofs compared to non-green (traditional) roofs – Stormwater runoff volume and flow rates

October 25, 2002 Rain Event Retained = 0. 18 in

October 25 Rain Event Maximum Detention

October 25 Rain Event Delayed Peak Intensity Reduction
 l Period since Last Storm = 8 days l")
Storm Analysis (Oct 25 th) l Period since Last Storm = 8 days l Rainfall Depth = 0. 94 inches l Runoff Depth = 0. 76 inches l Retention = 0. 18 in (0. 94 – 0. 76 in)
 l Maximum Rainfall Intensity = 0. 26 in/hr l")
Storm Analysis (Oct 25 th) l Maximum Rainfall Intensity = 0. 26 in/hr l Maximum Runoff Rate = 0. 16 in/hr – 38% reduction in intensity l Reduction in Runoff Rate = 0. 10 in/hr l Delay Between – Peak Rain and Peak Runoff = 1 hour l Delay to Start of Runoff = 4 hours
 l Retention = 0. 18 in l Retention +")
Storm Analysis (Oct 25 th) l Retention = 0. 18 in l Retention + Detention = 0. 44 in l Maximum Detention = 0. 26 in l Function of maximum rainfall intensity after runoff begins.

October 2002 Days Green Since Roof Delay to Storm Last Rainfall Runoff Start of Date Rain Depth Retention Runoff (Days) (in) (%) (hr) 16 -Oct 3 1. 15 0. 79 0. 36 31. 3 1. 0 25 -Oct 8 0. 94 0. 76 0. 18 19. 1 4. 0 Average = 1. 045 0. 78 0. 27 25. 23 2. 50

November 2002 Days Green Since Roof Delay to Storm Last Rainfall Runoff Start of Date Rain Depth Retention Runoff (Days) (in) (%) (hr) 5 -Nov 10 -Nov 12 -Nov 16 -Nov 4 5 1 4 Average = 0. 81 0. 42 0. 45 1. 56 0. 81 0. 54 0. 13 0. 30 1. 02 0. 50 0. 27 0. 29 0. 15 0. 54 0. 31 33. 3 69. 0 33. 3 34. 6 42. 58 7. 0 18. 0 4. 0 2. 0 7. 75

May 2003 Days Green Since Roof Delay to Storm Last Rainfall Runoff Start of Date Rain Depth Retention Runoff (Days) (in) (%) (hr) 23 -May 25 -May 31 -May 0. 8 1. 1 4. 1 Average = 0. 35 0. 48 1. 11 0. 65 0. 16 0. 20 0. 75 0. 37 0. 19 0. 28 0. 36 0. 28 54. 3 58. 3 32. 4 48. 35 4. 0 9. 0 5. 0 6. 00

June 2003 Days Green Since Roof Delay to Storm Last Rainfall Runoff Start of Date Rain Depth Retention Runoff (Days) (in) (%) (hr) 3 -Jun 2. 0 1. 13 0. 80 0. 33 29. 2 5. 0 4 -Jun 0. 5 0. 10 0. 05 33. 3 0. 5 7 -Jun 2. 2 0. 68 0. 41 0. 27 39. 7 3. 0 8 -Jun 1. 4 0. 23 0. 09 0. 14 60. 9 0. 5 12 -Jun 3. 4 0. 14 0. 02 0. 12 85. 7 1. 0 14 -Jun 2. 0 0. 19 0. 00 0. 19 100. 0 --- 17 -Jun 3. 0 1. 00 0. 51 0. 49 49. 0 12. 0 19 -Jun 1. 4 0. 26 0. 08 0. 18 69. 2 0. 5 21 -Jun 1. 4 0. 18 0. 16 0. 02 11. 1 0. 5 Average = 0. 44 0. 20 53. 13 2. 88

July 2003 Days Green Since Roof Delay to Storm Last Rainfall Runoff Start of Date Rain Depth Retention Runoff (Days) (in) (%) (hr) 2 -Jul 12. 2 0. 13 0. 02 0. 11 84. 6 2. 0 6 -Jul 4. 0 0. 67 0. 03 0. 64 95. 5 5. 0 7 -Jul 0. 3 0. 12 0. 03 0. 09 75. 0 4. 0 10 -Jul 3. 5 1. 62 1. 10 0. 52 32. 1 1. 0 16 -Jul 5. 0 0. 34 0. 04 0. 30 88. 2 2. 5 21 -Jul 2. 5 0. 48 0. 06 0. 42 87. 5 0. 5 22 -Jul 0. 4 0. 53 0. 05 0. 48 90. 6 0. 5 27 -Jul 5. 7 0. 39 0. 02 0. 37 94. 9 1. 0 31 -Jul 3. 8 1. 38 0. 67 0. 71 51. 4 4. 0 Average = 0. 63 0. 22 0. 40 77. 76 2. 28

Summary of Retention Results
 = daily")
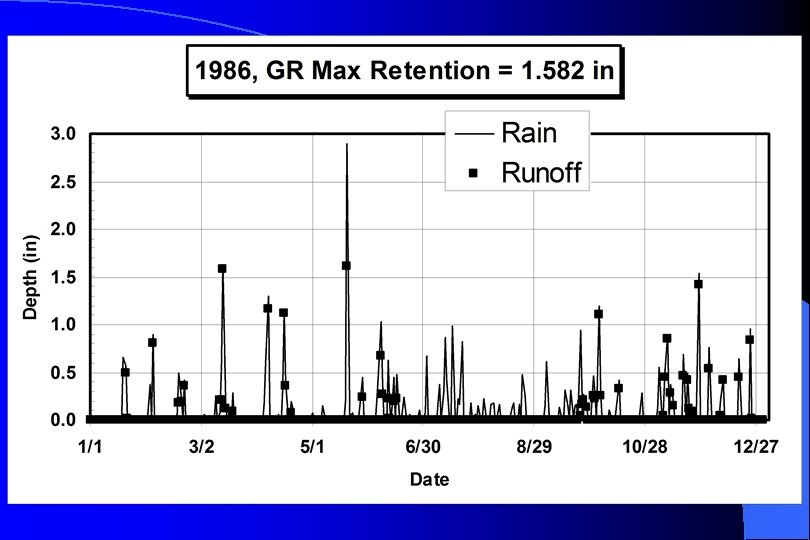
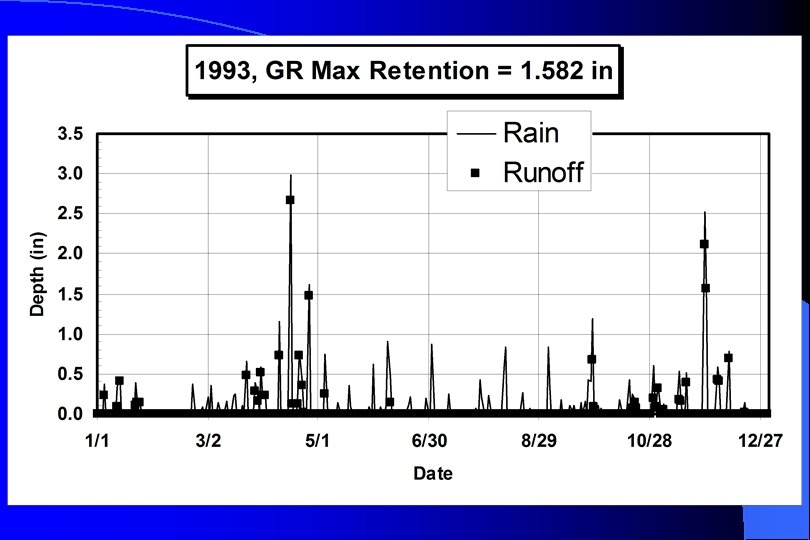
Modeling Annual Green Roof Impact l Assumed – Simple ET curve; f(month) = daily ET – Drainage layer, roof media, and plants had maximum of 1. 582 inches of retention storage. l For each daily rain amount – Estimated water lost to atmosphere. – Estimated water remaining in green roof. l Added rain to green roof.

Schematic of Green Roof Transpiration Rain Evaporation Max. Retention = 1. 582 in (3. 5 in)
 of rain data from State")
Modeling Results l Based on 27 years (1976 -2003) of rain data from State College, PA – Roof maximum retention = 1. 582 inches – Average annual rain = 40. 3 inches. – 22. 9 inches if average annual rain was retained on Green Roof – Average annual rain retained = 58%. l This captured water is returned to the atmosphere by – Evaporation – Transpiration

Extending the Annual Model l If we assume the roof in question has maximum retention capacities different from our green roof, – Retention values from l l 0. 125 inches to 3. 0 inches were evaluated.


Stormwater; Extreme Storm Response l Stormwater Management is based on extreme hydrologic events. – 2 -year rainfall/runoff. – 25 -year rainfall/runoff. – 100 -year rainfall/runoff. l How well can a Green Roof be expected to attenuate these large design storms?

Extreme Storm Response Modified Puls Routing Model l Accounts for capillary & hygroscopic water stored in: l – drainage layer – 3. 5 -in media – CAM plants Accounts for 0. 05 in interception. l Blaney-Criddle ET Model applied on a daily basis to remove water from roof. l Rain must fill all layers to field capacity before runoff starts. l

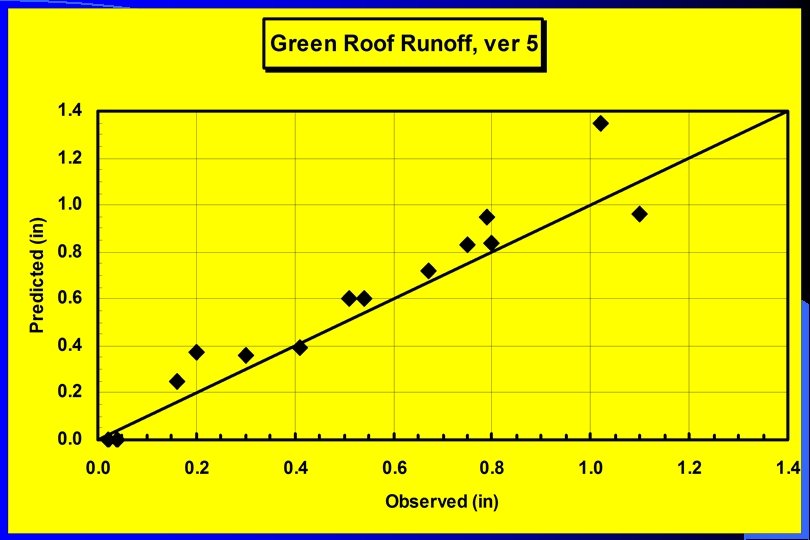
Extreme Storm Response l Model Validation. – Inputted rainfall hyetographs for 16 storms measured at Rock Springs. l 24 -hour rains varied from: – 0. 14 in to – 1. 62 in – Averaged 0. 84 in – Computed runoff from roof. – Compared to measured runoff.

R 2 = 0. 930

R 2 = 0. 907

R 2 = 0. 938

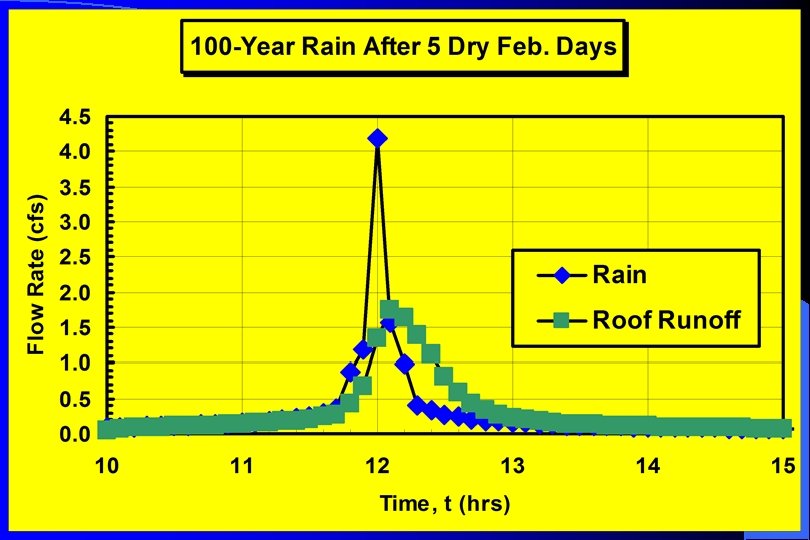
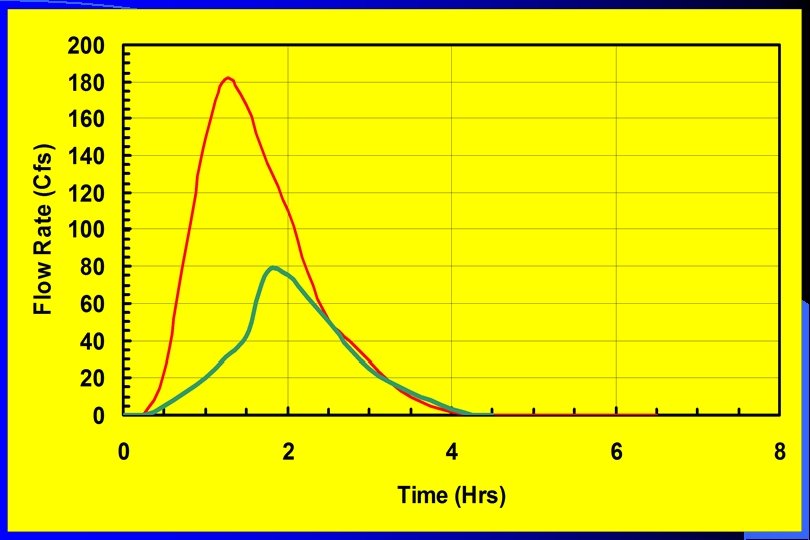
Extreme Storm Response l Applied synthetic rainfall to Green Roof. – Type II Rainfall Distributions. – Assumed State College, PA – Assumed Green Roof had same characteristics as our research roofs. – Simulated the Roof’s runoff hydrographs for a 270 - by 70 -foot Roof: l l 1 day since last storm in February and July. 5 days since last storm in February and July. 2 -Year Synthetic Rain. 100 -Year Synthetic Rain.

2 -yr Pre-Dev, CN = 79

2 -yr Pre-Dev, CN = 79

100 -yr Pre-Dev, CN = 79

100 -yr Pre-Dev, CN = 79
) –")
Summary of Extreme Storms l 2 -Year (2. 6 inches in 24 hours)) – July w/ 5 Dry Days = 85% reduction in peak. – July w/ 5 Dry Days = 61% reduction in volume. l 100 -Year (5. 3 inches in 24 hours) – July w/ 5 Dry Days = 60% reduction in peak. – July w/ 5 Dry Days = 30% reduction in volume. – Rain water retained and detained l Detained water released after storm

Thank You arj@psu. edu www. abe. psu. edu/fac/Jarrett. html …Questions?
- Slides: 48