GREEN JELLY BEANS LINK TO ACNE Dr Geoff

GREEN JELLY BEANS LINK TO ACNE? Dr Geoff Webb Medicines Research Group

THE GOLDEN AGE FOR NUTRITION RESEARCH 1929 -43 Seven Nobel Prizes awarded to 12 people for vitamin-related work Pinpointed the cause and potential cure for many major diseases 1900 -1950 A million cases and 100, 000 deaths in USA from pellagra (niacin B 3) 1907 - 150, 000 cases and 30, 000 deaths per year from beri in Malaya (thiamine B 1) 1900 - 80% of infants and young children in Boston hospitals had rickets (vitamin D) Liver (raw) diet for pernicious anaemia (B 12) – a fatal condition Plus – iodine prevents endemic goitre and cretinism (c 1915)
 -A")
GUIDELINES FOR A HEALTHY DIET National Advisory Committee on Nutrition Education (NACNE 1985) -A quantified guide to a “prudent” diet to reduce chronic disease 1992 USA

SOME PAST ERRORS THAT I HAVE WRITTEN ABOUT Promotion of front sleeping for infants in 1970 s and 1980 s – led to hundreds of thousands of extra cot deaths worldwide Belief in a world protein shortage (the protein gap) – primary protein deficiency assumed to the major cause of malnutrition worldwide – massive resources to deal with this illusory problem Belief that extra antioxidants in the form of supplements or antioxidant rich foods would reduce cancer & heart disease and increase life expectancy (maybe by 7 years – Harman 1972) Belief that defective thermogenesis in brown fat could be a major cause of human obesity

UK COT DEATH TRENDS 2. 5 2 1. 5 1 0. 5 Year 4 20 0 02 20 7 19 9 2 19 9 1 19 9 6 19 8 1 19 8 6 19 7 1 0 19 7 Rate per 1000 live births Figure 1 Trends in cot death rates in England Wales (Data derived from Anderson et al (1995) and FSID (2006)

PYRAMID OF EVIDENCE
 “Why most")
ARE THESE ISOLATED EXAMPLES OR SYMPTOMS OF A WIDER PROBLEM? Ioannidis (2005) “Why most published research findings are false” 1. 5 million views and 1900 citations Young and Karr (2011) “any claim coming from observational studies is most likely to be wrong” Begley and Ellis (2012) many/most preclinical studies with potential for cancer drug development have false or exaggerated findings Macleod et al (2014) – 85% research resources are wasted How many (nutrition) studies would not advance science even if correct? – Watercress example
 2 consecutive")
WHY ARE THESE SCIENTISTS SO PESSIMISTIC? Failure of reproducibility (or no attempt) 2 consecutive papers in NEJM both from world famous cohort studies “HRT increases risk of cardiovascular death by 50%” “HRT more than halved risk of severe coronary artery disease” Young and Karr – 56 topics in case-control studies – for each one conflicting findings had been found 12 RCTs testing 52 claims from observational studies – none of 52 claims confirmed and for 5 claims - statistically significant results in opposite direction Begley and Ellis – 53 landmark preclinical studies indicating advances in cancer therapy (highly cited & high impact) – 47 could not be reproduced in industrial pharmaceutical labs.

OPEN SCIENCE COLLABORATION 100 major psychology papers from top journals – 97% had statistically significant results Attempted to replicate with the co-operation of original authors Originals – mean p 0. 028 but replications 0. 302 and mean effect size half of that in originals 61% classed as not replicated and only 47% of original effect sizes within 95% confidence limits of the replication study. There is an ongoing project to do the same with 50 high impact cancer biology studies

SOME CAUSES Need to publish for career advancement/survival – high impact journals favour significant, positive & hypothesis-affirming data 2 million papers p. a. in 28000 journals – 1996 - 2011 15 million people authored 25 million papers ISI – papers published 1981 -85 - 55% no citations in 5 years after publication – how many have their reproducibility tested? Many papers only read by authors and reviewers – at best!!! “Get me off your **cking mailing list” Int J Adv. Computer Tech. Fanelli (2011) “Negative results are disappearing from most disciplines and countries” Bias – scientists unconsciously find ways of making their data significantly confirm their hypothesis – Masicampo and Lalande (2012)
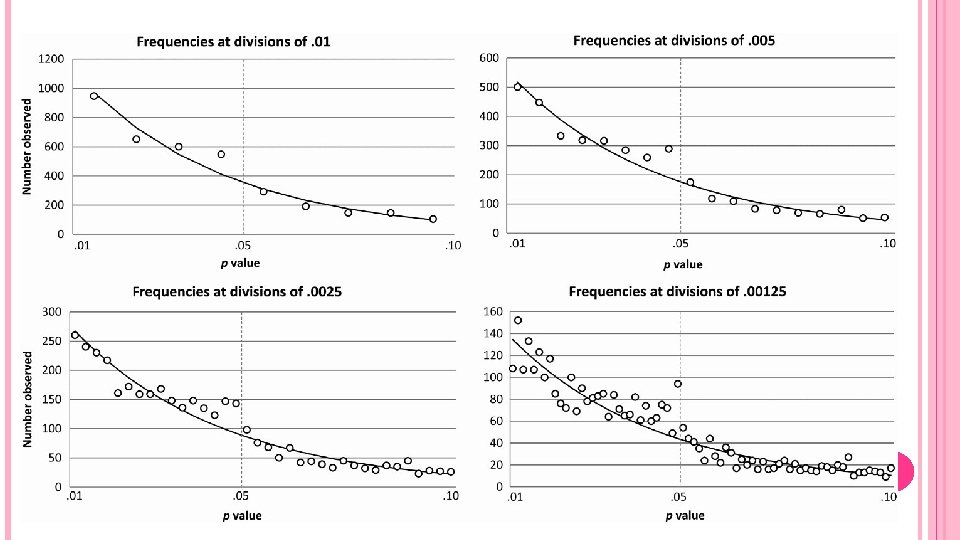

THE OTHER GLASS CEILING IN SCIENCE Ronald Fisher in 1922 chose the arbitrary p<0. 05 boundary between significance &NS for practical convenience – p=0. 0526 (1/19), p=0. 05 (1/20), p=0. 0476 (1/21) Crucial for scientists - p<0. 05 interesting publishable data set-p>0. 05 may need to repeat, expand or shelve data There is a strong publication bias against negative or NS results Once a positive effect has been published then negative data may become more interesting – rapidly alternating yes/no - Proteus phenomenon: � 31/8/2000 Herb “as effective as antidepressants” � 9/4/2005 Herb “ineffective as antidepressant” � 11/2/2005 Herb “as good as depression drug”

MULTIPLE ANALYSES Hypothesis – jelly bean consumption leads to acne – test and NS – then test each of 20 different colours separately – green p<0. 05 – paper title and press release headline – green jelly beans linked to acne Many people testing many associations – some will be significant by chance and these are the ones that are published/highlighted Spoof example - too far fetched? “females eating breakfast cereal leads to more baby boys” (Proc Royal Soc) Criticism – assessed 133 food items on 3 occasions – strongly significant results explained by pure chance

GALACTOSE AND OVARIAN CANCER SINCE 1980 S Women with galactosaemia – premature menopause – galactose toxic to ovarian tissue Case control study no difference between lactose intake in controls and ovarian cancer cases Then test all dairy foods – cases more likely to eat yoghurt monthly Interpretation - galactose more available in yoghurt Ratio lactose consumption: gal-1 -P uridyl transferase v. higher in cases Cases – more likely to Jewish, college educated, never married, nulliparous, and never used oral contraceptives Recent meta-analysis – no association between milk, yoghurt or lactose consumption and ovarian cancer – more studies needed to confirm!!!!!!

MULTIPLE MODELLING Epidemiology not like a controlled experiment - cannot control confounding variables Statistical devices for retrospective correction Result will be different depending upon which potential confounders are corrected for and how the correction is done – operator flexibility gives scope for bias How many epidemiological studies correct for differences in activity/fitness? How do they do it?
 against effect size (X) – larger studies tend")
UNDERPOWERED STUDIES Scatterplot sample size (Y) against effect size (X) – larger studies tend to cluster around “true” effect and as size diminishes so greater fluctuation giving a funnel effect Enough small studies by different groups will get significant effects A study with low power has reduced chance of detecting a true effect but also less likely any statistically significant effect reflects a true effect

STUDY 90000 SUBJECTS – HIGH ANIMAL FAT INTAKE DOUBLES COLON CANCER RISK

SMALL EFFECT SIZE Statistically significant vs clinically significant – garlic and serum cholesterol Many headline-generating diet-disease links – relative risk in range 1. 2 -1. 5 c. f. : � RR 15 -40 for smoking and lung cancer � RR 3 -8 for front sleeping and cot death Ioannidis (2005) theoretical example - links between 60 dietary factors and RR of developing a specific tumour If no actual dietary links to this tumour but RRs in range 1. 2 -1. 4 between upper and lower tertiles of exposure – RRs a good measure of the net bias in the studies
- Slides: 18