Green Economy and Chinas Development Transition Plan C
 Zhu Dajian Institute for Sustainability and")


")

 comparison: US and China United States GPD/Capita: $47, 000 GDP")


 Resources consumption in 2003 Coal Irion Steel Cement GDP")


")


")


 instead of degrowth (Plan B)")
HDI/EF: US , EU or China model? Low HDI (< 0. 8) High HDI(≥")

: ≥ World Average Wealth GDP")

CO 2: Three scenarios for China Developed Countries High Energy")

")
Direction: smart growth vs de-growth Quality of life Plan C: Short stock Plan B:")


 GDP New Chinese Consumerism Eco-footprint")


 ⊿ RP=1/T ⊿ I (%year) (%")

")


 scenario approach")


 Commercial Breakeven with carbon pricing and subsidies Cost of")


- Slides: 88
Green Economy and China’s Development Transition (Plan C) Zhu Dajian Institute for Sustainability and Governance Tongji University
Three points and messages p Why: How big will the impact of China’s development be in next decades and particularly in next 10 years ? China’s green transition is a must. p What: What is the meaning of China’s green transition? China should decouple its development from resource use and environmental impact in terms of Plan C. p How: What are ways for China to go towards green development? China has some key decoupling potentials in three fields such as new-type urbanization, new-type industrialization and new-type consumerism.
1. Why: Conflict between economy and environment Supply capacity supply of life supporting resources declining Green economy Economic demand consumption of life supporting resources rising
1950 -2050: Three stages of New China Environmental Impact Brown Economy China 3. 0 China 2. 0 Green Economy China 1. 0 1950 1980 2010 2050
Environment Impact of Economic Growth • I=Impact: Resource consumption and pollution impact • P=Population: How many people will we have ? • A=Affluence: What’s the consumption level? • T=Technology and Management: How fast and big do we consume ?
1. 1 Population: How many people China will have • China has about 1. 26 billion people in 2000 and 1. 34 in 2010 • Increasing about 8 -10 million persons per year • 1. 4 billion till 2020 in China (1. 1 times of the year 2000) • 10 million persons for urbanization per year • About 60% urbanization rate till 2020 in China
2030:the peak year for China’s population (UN)
1. 2 Affluence: Growth in terms of GDP per capita • Beginning of Reform and Opening: $250 person (A year growth rate is about 9 -10% since then) • 1981 -1990: $500 per capita in 1990 • 1991 -2000: $800 per capita in 2000 • 2001 -2010: $4000 per capita in 2010 • 2011 -2020: $8000 person in 2020 (about 10 times of the year 2000) • 2021 -2050: above $20000 person in 2050 (about 25 times of the year 2000)
GDP per capita (PPP) comparison: US and China United States GPD/Capita: $47, 000 GDP Growth: 1. 3% China GDP/Capita: $6, 000 GDP Growth: 9. 8%
Per Capita Income In terms of PPP, China will surpass US in 25 years?
Economic size of China in 2050
Economic Scale of China in History
1. 3 Technology: Material intensity and resource productivity
China’s Technology Efficiency ( 2000) Resources consumption in 2003 Coal Irion Steel Cement GDP The percentage to the world (%) 31 31 30 40 4 Canad Japan a Countries USA SO 2 kg/1000 GDP 2. 3 3. 7 NOxkg/1000 GDP 2. 7 2. 9 Austr alia Franc e 0. 3 4. 7 0. 8 0. 7 2. 0 18. 5 0. 6 5. 5 1. 4 1. 0 2. 1 16. 6 USA Cana da China 2. 17 2. 67 3. 50 11. 50 Countries Japan Italy France Germa ny Energy consumption/ GDP =1. 00 1. 33 1. 50 UK Germ OECD any China
1. 4 Impact: How big for China in the next decades? (According to the formula: I=PAT, when T=1) Year Population Affluence (billion) (GDP per capita) Technology Environment impact (how ( Impact/GD many times) P) 2000 1. 26(1. 0) 800(1. 0) 1 1. 0 2020 1. 40(1. 1) 8000(10) 1(1/5) 11. 0(2. 2) 2050 1. 3(1. 00) 20000(25) 1(1/5) 25. 0(5. 0)
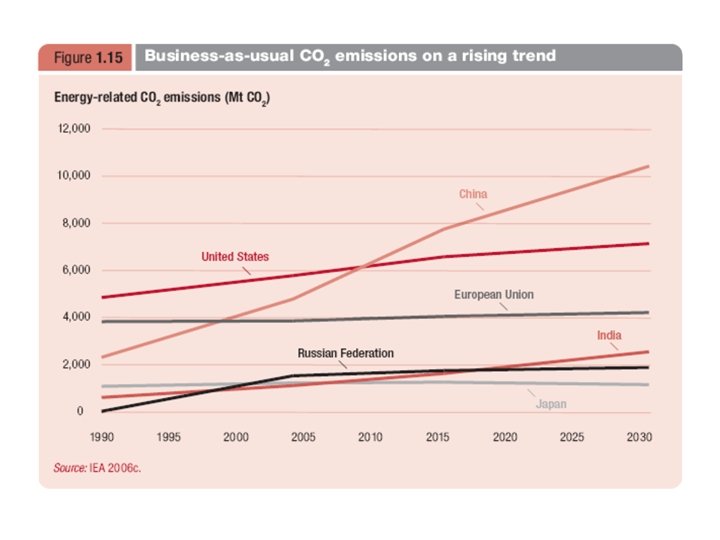
China coal power plants are increasing Europe, number of 500 MW equivalent coal plants 2005 2030 32% 519 394 China, number of 500 MW equivalent coal plants 2005 2030 239 % US, number of 500 MW equivalent coal plants 2005 2030 51% 668 614 India, number of 500 MW equivalent coal plants 2005 2030 1008 249 % 144 Source: World Energy Outlook 2006 502 2082
2. What: China’s green transition and Plan C
2. 1 Green Economy and Decoupling (UNEP, 2012)
Economic growth within ecological limits $$$ $ Resources Waste $ products $$$ Wast e Waste Only a crazy or an economist would believe that an unlimited growth will keep on within a limited planet. Waste ——Kenneth Boulding
To decouple development with resource consumption and environment impact Increase of well-being Decoupling Decrease of natural cost Brown economy Green economy
Development curves of green economy Quality of life Economic growth Use of nature
To live better beyond more GDP consumption well-being rich Conventional mode throughput Dematerialization and sustainable production Im-materialization and sustainable lifestyle dematerialization wedge lifestyle wedge dematerialization wedge poor poverty gap poverty spring equity clamp
The concept of decoupling (UNEP,2011)
Potentials and challenges for green transition US Europe China /Japan Stock of goods Developed Developing Government initiative Weak Strongest Green culture Weak or ideology Strong Developing
Key issues for China’s Plan C • Model:Smart growth instead of de-growth ( towards growth within the limit of natural capitals) • Innovation: technology innovation with social innovation (to strengthen a socialtechnology integrated policy system • Capacity building: top-down initiative and bottom-up involvement (from government initiatives to collaboration governance)
2. 2 Model: Smart growth (Plan C) instead of degrowth (Plan B)
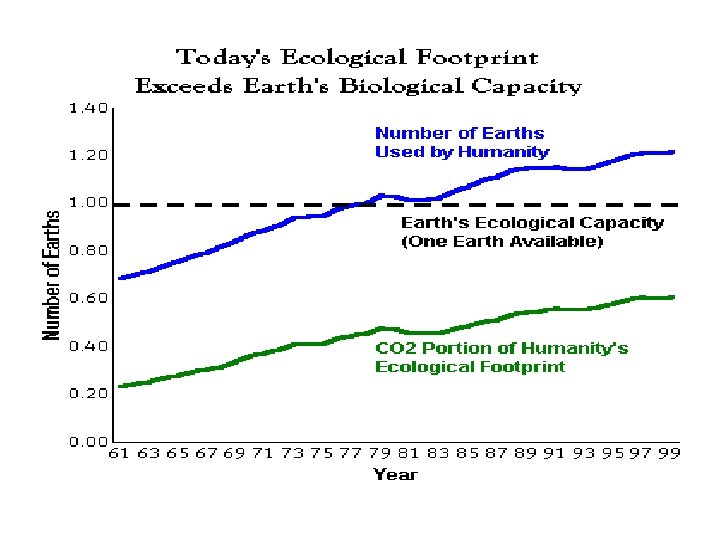
(1)HDI/EF: US , EU or China model? Low HDI (< 0. 8) High HDI(≥ 0. 8) High Eco-footprint( US level ≥ 2. 7) EU level Leapfrogging Low Eco-footprint ( < 2. 7) China SD
poor medium OK good Source: http: //www. footprintnetwork. org and http: //hdr. undp. org/en/statistics/data/hdi 2008
Three pillars for China’s green development Economic growth (↑): ≥ World Average Wealth GDP per capita China’s green future Environmental impact (↓): ≤ OECD Average Impact Ecofootprint and CO 2 per capita Social Development(↑↑): ≥ World Average HDI Education years and life years per capita
Targets of Green Economy of China Developing Economic phase growth General 1978 well-off 2000 $800 per capita Entire Well-off $15000 per capita 20012020 General 2021 moderniz 2050 ation Human development Environment impact HDI 0. 7 HDI 0. 8 Low Ecofootprint >$20000 HDI Per capita >0. 9 A little Higher ecofootprint Ecofootprint of the world average
GHG emissions per capita (2)CO 2: Three scenarios for China Developed Countries High Energy Locked Development Leapfrogdevelopment China World average emission 2020 Low Carbon World 2050 Time
GDP, Energy and CO 2 in China 2005 2020 2030 2050 129. 1 299. 1 GDP(2005 18. 3 Trillion RMB) 65. 0 GDP growth 9. 8 (%) 8. 38 7. 11 4. 98(2030(2010 -2020) (2020 -2030) 2040) 3. 60(20402050) Energy/GDP CO 2/GDP Energy(Gt) 21. 9 40 -42 45 -46 55 -56 CO 2 (Gt) 51. 0 84 -88 78 -84 77 -83 20052050 6. 40
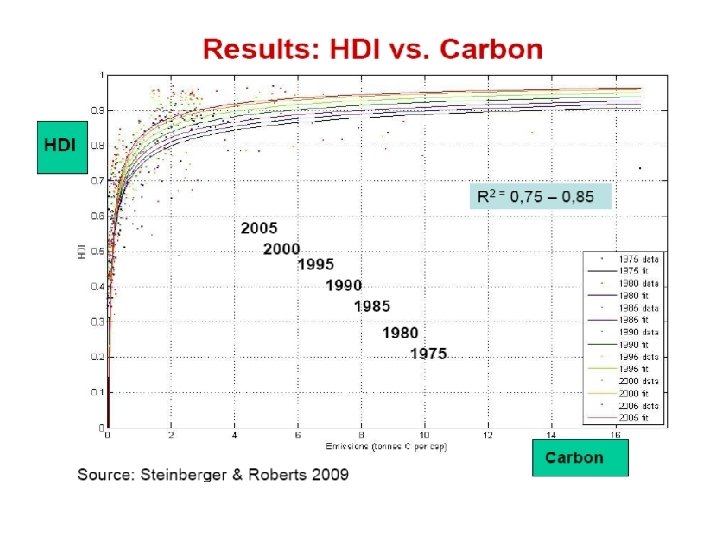
Carbon threshold for HDI is decreasing(1 t CO 2=0. 27 t. C)
(3)Direction: smart growth vs de-growth Quality of life Plan C: Short stock Plan B: Overshot threshold space Eco footprint
Plan B Plan C Plan A
Basic needs is a must for developing countries 5000 10000 -20000
New consumerism: developed vs. developing China Green Economy (RP) GDP New Chinese Consumerism Eco-footprint New Western Consumerism = West
Absolute decoupling vs relative decoupling Growth of economy Decoupling Factor 1 Growth of resource use Relative decoupling Growth of environmental impact Time Decrease of resource use Absolute decoupling Decrease of environmental impact
Absolute decoupling only at low economic growth rates E U 15 E U 27 Source: Social Ecology DB; averages 2000 -2005
2. 3 Innovation: Technology progress vs behavior change
Four factors determine CO 2 emission CO 2 emission/e nergy
Efficiency improvement is not enough for decoupling Table 3: CO 2 emissions and driving forces in China (growth in %) Years I P A T 1979 -1988 49 14 118 -63 1989 -1998 44 11 130 -69 1999 -2008 87 6 128 -22 1979 -2008 180 31 376 -154
China’s scenarios based on IPAT Scenario ⊿ GDP(%year) ⊿ RP=1/T ⊿ I (%year) (% ⊿P ⊿ (%year)GDP/P (%year) CO 2 (2030) year) BAU 0. 5 (Plan A) 9. 5 -3. 0 7. 0 24 GT (60× 4. 0) Current Plan Higher Plan 0. 5 6. 5 -3. 5 0. 5 6. 5 -5. 3 1. 7 (or 5. 0) (or -4. 0) 12 GT (60× 2. 0) 9 GT (60× 1. 5)
? ? ? all 5 previous global growth periods were able to access cheap primary resources 18 -19 March 2009 47
Mobility models from Shanghai Expo 2010 Incremental Car energy label: 10 -20% Eco-efficiency (Production) Car sharing system: factor 4 I II IV Car with new energy: factor 2 Eco-effectiveness (Consumption) Low transport-need city: Factor 10 Radical
System innovation instead of gradual improvement
Incremental improvement vs system innovation Factor 20 System innovation Eco-efficiency Product replacement Factor 10 Product improvement Factor 4 Process improvement Factor 2 Within sectors Cross sectors
From efficiency to sufficiency solutions
To raise the value-per-weight ratio € / kg sufficency and consumption goods system solutions durables physical asset management smartness and SCIENCE
2. 4 Governance: active government or civil society Institutional capital Government Active government Green Economy Capacity Governance achievement building Social capital Civil Society Voluntary participation
The important is to get the green paradigm accepted by policy–makers and the society
Different modes of governance Plan B Institutional capacity higher lower Social higher Dynamic Voluntary capaci governance: participation: ty High success Low success lower Plan C Active government: Low success Passive governance: Failure
How to realize energy and CO 2 indicators in 2006 -2020
Example:water-saving society and collaboration governance
Policy-making:forecasting or backcasting • Forecasting scenario approach • Backcasting (landing place) scenario approach
Types of futures studies Futures studies consider one or more of the three P’s: 1. Possible futures. What may happen? 2. Probable futures. What is most likely to happen? 3. Preferable futures. What we would prefer to happen? • backcasting concerns the latter – identifying preferable futures “The major distinguishing characteristic of backcasting analysis is a concern, not with what futures are likely to happen, but with how desirable futures can be attained. It is thus explicitly normative, involving working backwards from a particular desirable future end -point to the present in order to determine the physical feasibility of that future and what policy measures would be required to reach that point. ” (Robinson, 1990)
Forecasting and backcasting FUTURE VISION OF THE FUTURE Forecasting Backcasting PRESENT
Forecasting and backcasting trend Tp forecast Xf 1 backcast Xf 2 X 0 T 0 = now Tf
2030:China’s carbon emission peak?
Policy cycle based on a cap-sharetrade system
Levelized Cost of Energy (LCOE) Commercial Breakeven with carbon pricing and subsidies Cost of alternatives 1 Commercial break. Learning rates Carbon price Incentives to make technologies economically viable diminish over time 2 Commercial break- 3 even with carbon pricing and subsidies e. g: EU 2 4 Cost of fossil fuel production (oil, gas, coal prices) even with subsidies without carbon pricing e. g: some US states 5 3 Commercial breakeven with carbon pricing without subsidies 4 Commercial breakeven without carbon pricing or subsidies 1 Time Source: De. AM analysis, 2008. 5 Beyond Breakeven
Labour productivity or materials & energy productivity
To raise carbon tax for higher carbon productivity Source: Weizsacker, WRF, 2007
3. How: Policy and action into three major developing fields Better life Less resource input Compact urbanization Circular sharing-oriented economy consumerism Less waste output
Factor analysis for decoupling Limiting element Growing element Performance Measurement Approach or Model New urbanisation Land Population /Land New industrializati on Resource GDP /Resource Circular Economy New consumerism Resource Service /Resource Sharingoriented Life Compact City
3. 1 Decoupling#1:Sprawled or compact urbanization 干旱半干旱区占 52% 黄土高原 64万km 2 青藏高原 200万km 2 岩溶地区 90万km 2
Sustainable Urbanization will be sharp Issues:Crowd People, Flat Economy, Hot Environment Approaches:To raise density, to reduce distance, to break division
Resource consumption per capita by development status and population density Share of world population 13% 6% industrial Source: UNEP Decoupling Report 2010 62% 6% developing Metab. rates: DMC t/cap in yr 2000
New urbanisation #1:in the east vs across the country 重点开 发区域
New urbanisation #2:city-regions vs noclustered cities
China’s high speed railway plan by 2020 North-South lines 京 京 京 杭 - - 沪 圳 哈 深 East-West lines 徐 杭 宁 青 - - 兰 湘 蓉 并
New urbaniztion #3: high denstiy cities within eco-around vs low density cities Built area Agricultu ral area Conservation area
New urbanisation #4: mixed functions vs separate functions Living Working Leisure Distance of driving Separate functions Within the walk and bicycle Mixed functions
CO 2 emission reduction by compact city • Compact urban: Reduction from transportation such as – Railways – Short trips • Compact district: Reduction from building such as – Effective heating/cooling by district heating system Compact district Energy consumption Passenger traffic (MJ/personkm) Car 2. 46 train 0. 21 Japanese values (2002)
3. 2 Decoupling#2: Linear or circular economy for industrialization Eco-efficiency Selling of service Reuse of goods Jump #3 Recycling of wastes Jump #2 End of pipe treatment Jump #1 1980 s 1960 s time 1990 s 2000 s
Economy: from cradle to grave or cradle?
Level #1:from end-pipe treatment to waste recycling Recycling & recovering wastes
A hotel plan on the wasted land Songjiang, Shanghai
Level #2:from throwaway to reusing of products manufacture resource materials Loop 1 product use Loop 2 waste Loop 1:to close the loop of goods (reusing of products) Loop 2:to close the loop of materials (recycling of waste)
Reusing old buildings in urban transition of Shanghai Left:An old power plant as an Shanghai Expo site Right:Old warehouses become the sites of creative industries
Level#3: from selling product to providing service Circular economy emphasizes on value add-on Low value High-value Value add-on Substance transform material product Linear economy emphasizes on substance production
Public transit system for sharing vs. private cars for ownership
To increase resource productivity radically Source: R. Ayres, Tongji University, 2007
3. 3 Decoupling#3:Ownership-oriented or sharingoriented consumerism TOOL HIRE degree of ownership none rental of product per unit time as required,eg taxi individual use per unit time as required; product not owned by group, eg public transit shared ownership of consumer durables,eg private cars CONSUMER GOODS LEASING/SERVICE full ownership degree of sharing specified share of time use of product owned by group,eg company bus CO-OPERATIVE
Energy service instead of energy consumption