
Great Lakes Research Session 233 rd ACS National

- Slides: 38
Great Lakes Research Session 233 rd ACS National Meeting Chicago, IL March 28, 2007 Mass Balance Models for Persistent, Toxic Bioaccumulative Chemicals (PBTs) in the Great Lakes: Application to Lake Ontario Joseph V. De. Pinto Limno. Tech Ann Arbor, MI Russell G. Kreis, Jr. U. S. EPA Grosse Ile, MI
Outline u Overview of PBTs in Great Lakes – – Legacy chemicals Chemicals of emerging concern Chemical Mass Balance Models u PBT management in Lake Ontario (La. MP) u – – Development, Calibration/Confirmation of LOTOX 2 Application of LOTOX 2
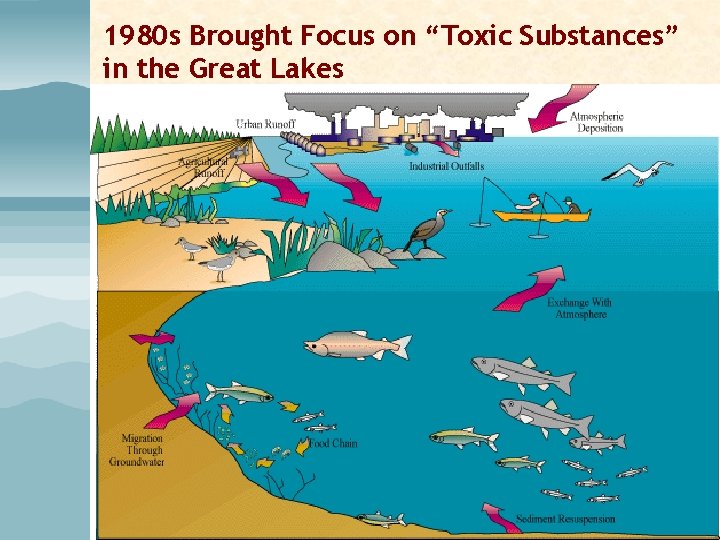
1980 s Brought Focus on “Toxic Substances” in the Great Lakes
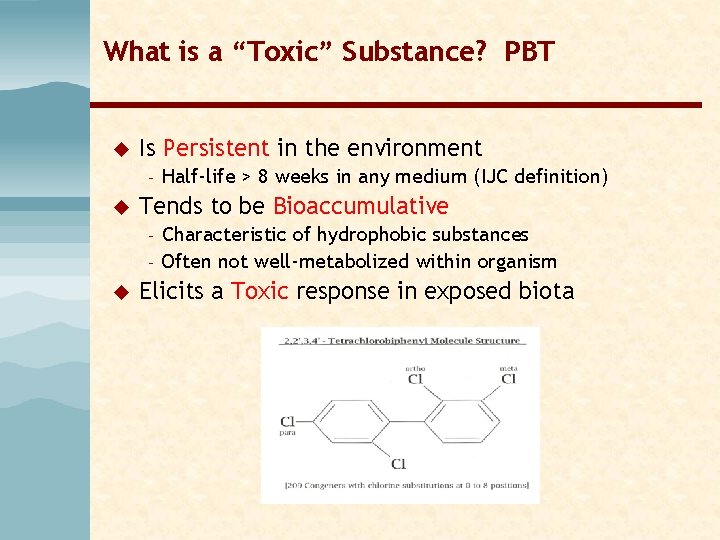
What is a “Toxic” Substance? PBT u Is Persistent in the environment – u Tends to be Bioaccumulative – – u Half-life > 8 weeks in any medium (IJC definition) Characteristic of hydrophobic substances Often not well-metabolized within organism Elicits a Toxic response in exposed biota
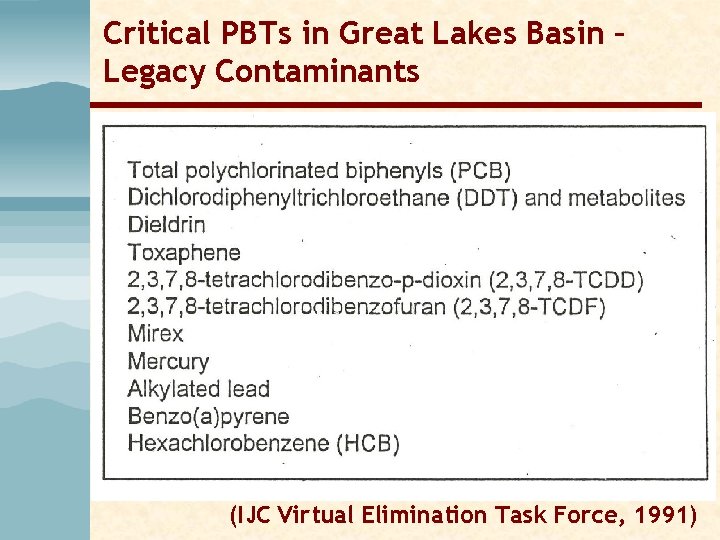
Critical PBTs in Great Lakes Basin – Legacy Contaminants (IJC Virtual Elimination Task Force, 1991)
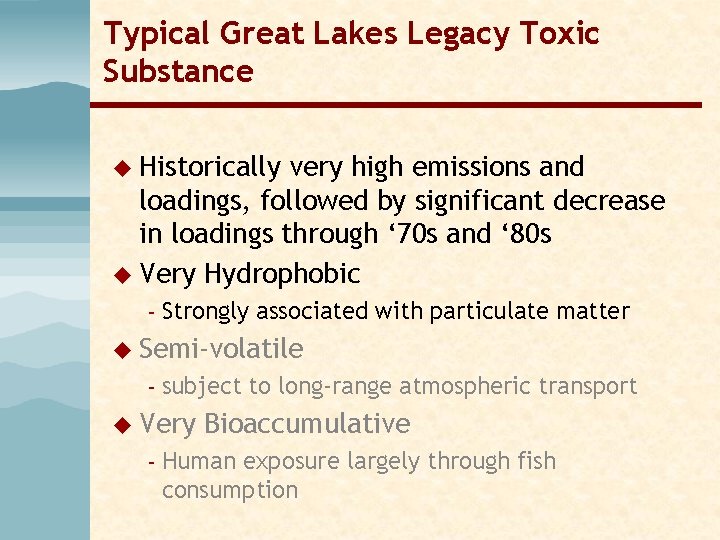
Typical Great Lakes Legacy Toxic Substance u Historically very high emissions and loadings, followed by significant decrease in loadings through ‘ 70 s and ‘ 80 s u Very Hydrophobic – Strongly associated with particulate matter u Semi-volatile – subject to long-range atmospheric transport u Very – Bioaccumulative Human exposure largely through fish consumption
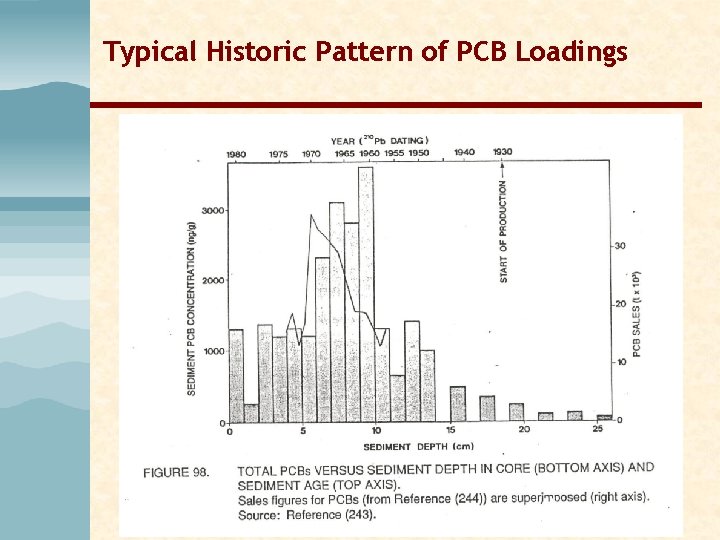
Typical Historic Pattern of PCB Loadings
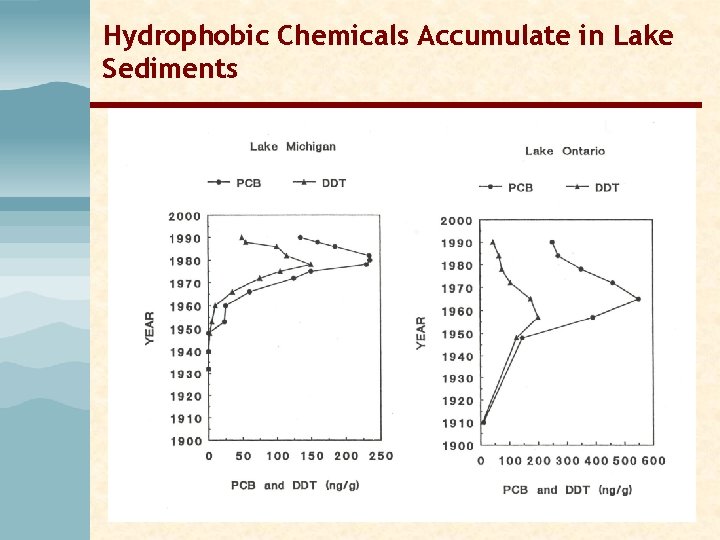
Hydrophobic Chemicals Accumulate in Lake Sediments
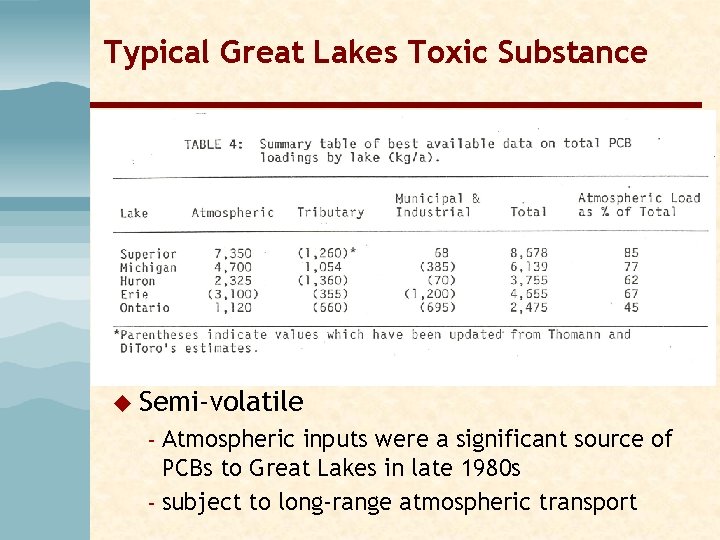
Typical Great Lakes Toxic Substance u Historically very high emissions and loadings, followed by significant decrease in loadings through ‘ 80 s and ‘ 90 s u Very Hydrophobic – Strongly associated with particulate matter u Semi-volatile Atmospheric inputs were a significant source of PCBs to Great Lakes in late 1980 s – subject to long-range atmospheric transport –
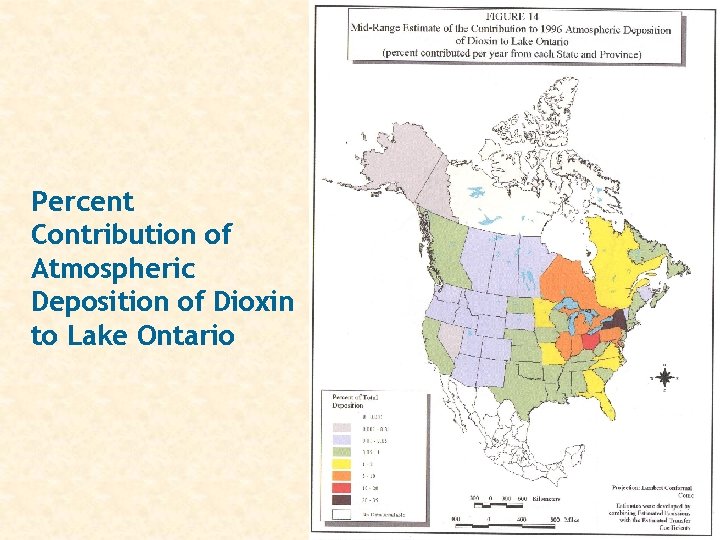
Percent Contribution of Atmospheric Deposition of Dioxin to Lake Ontario
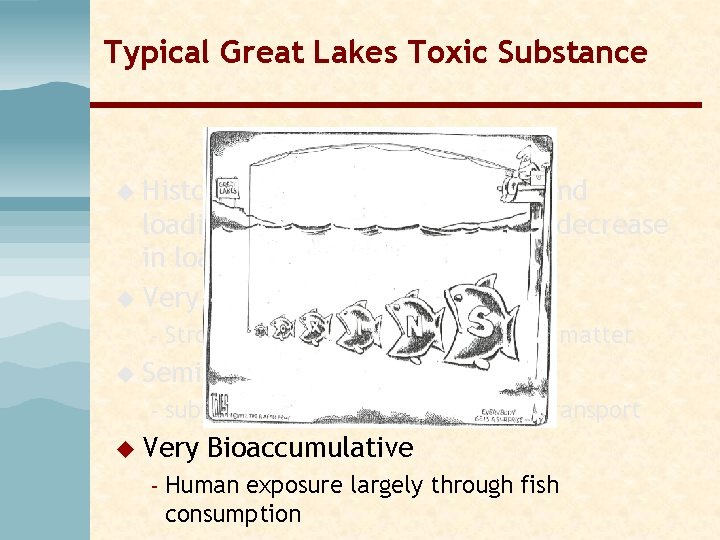
Typical Great Lakes Toxic Substance u Historically very high emissions and loadings, followed by significant decrease in loadings through ‘ 80 s and ‘ 90 s u Very Hydrophobic – Strongly associated with particulate matter u Semi-volatile – subject to long-range atmospheric transport u Very – Bioaccumulative Human exposure largely through fish consumption
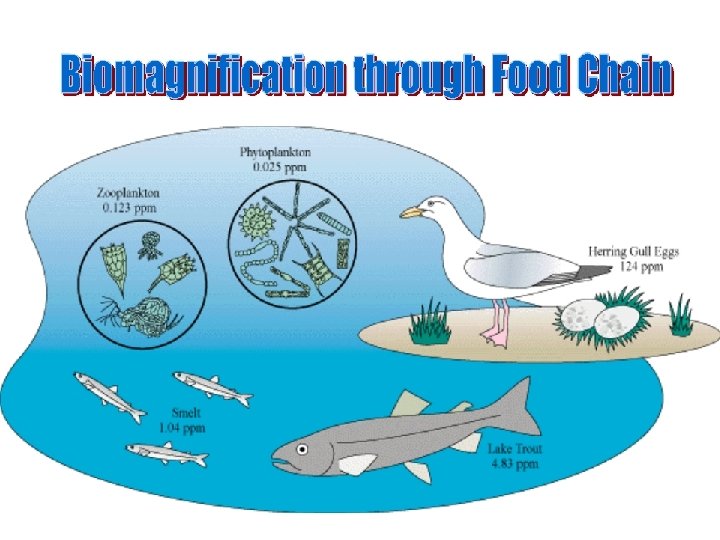
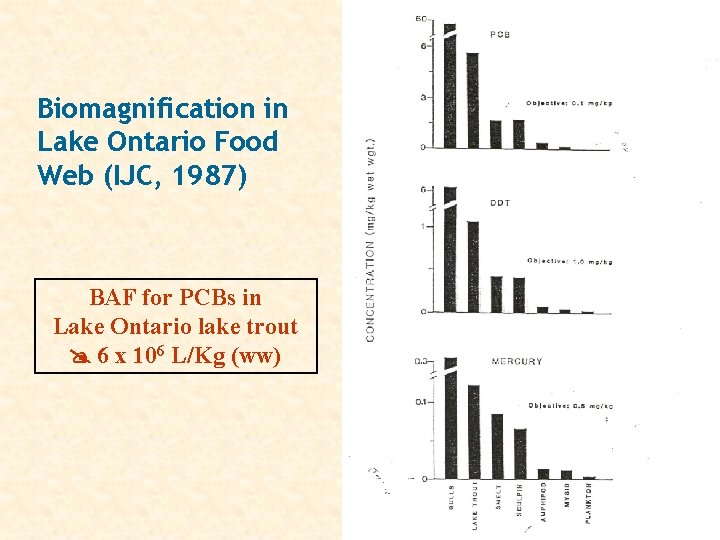
Food Web Bioaccumulation
Biomagnification in Lake Ontario Food Web (IJC, 1987) BAF for PCBs in Lake Ontario lake trout 6 x 10⁶ L/Kg (ww)
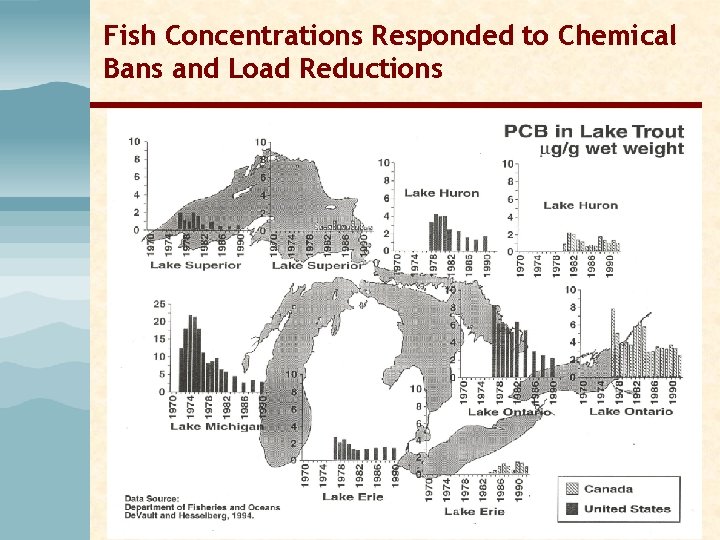
Fish Concentrations Responded to Chemical Bans and Load Reductions
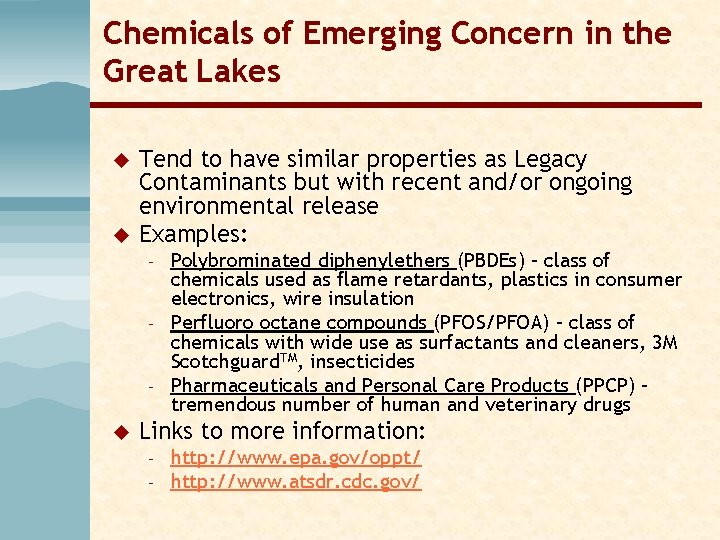
Chemicals of Emerging Concern in the Great Lakes u u Tend to have similar properties as Legacy Contaminants but with recent and/or ongoing environmental release Examples: – – – u Polybrominated diphenylethers (PBDEs) – class of chemicals used as flame retardants, plastics in consumer electronics, wire insulation Perfluoro octane compounds (PFOS/PFOA) – class of chemicals with wide use as surfactants and cleaners, 3 M Scotchguard. TM, insecticides Pharmaceuticals and Personal Care Products (PPCP) – tremendous number of human and veterinary drugs Links to more information: – – http: //www. epa. gov/oppt/ http: //www. atsdr. cdc. gov/
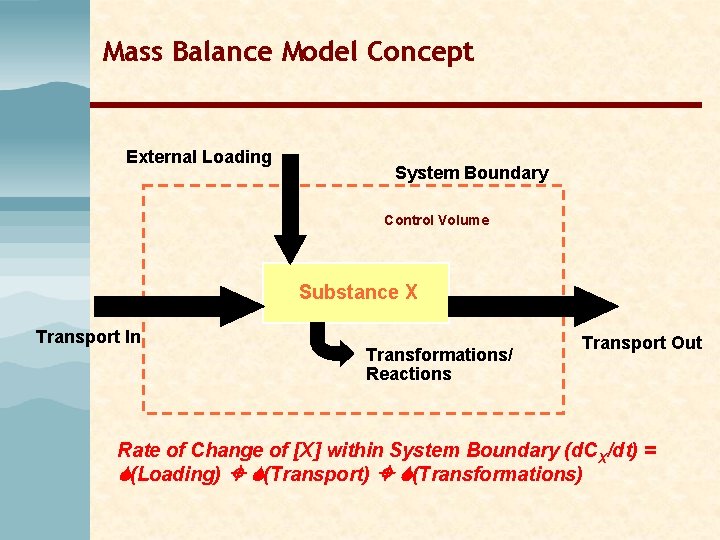
Mass Balance Model Concept External Loading System Boundary Control Volume Substance X Transport In Transformations/ Reactions Transport Out Rate of Change of [X] within System Boundary (d. CX/dt) = (Loading) (Transport) (Transformations)
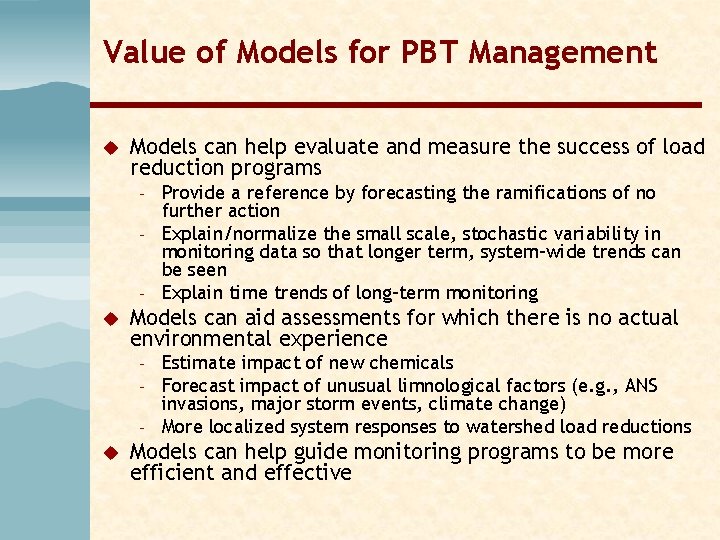
Value of Models for PBT Management u Models can help evaluate and measure the success of load reduction programs – – – u Models can aid assessments for which there is no actual environmental experience – – – u Provide a reference by forecasting the ramifications of no further action Explain/normalize the small scale, stochastic variability in monitoring data so that longer term, system-wide trends can be seen Explain time trends of long-term monitoring Estimate impact of new chemicals Forecast impact of unusual limnological factors (e. g. , ANS invasions, major storm events, climate change) More localized system responses to watershed load reductions Models can help guide monitoring programs to be more efficient and effective
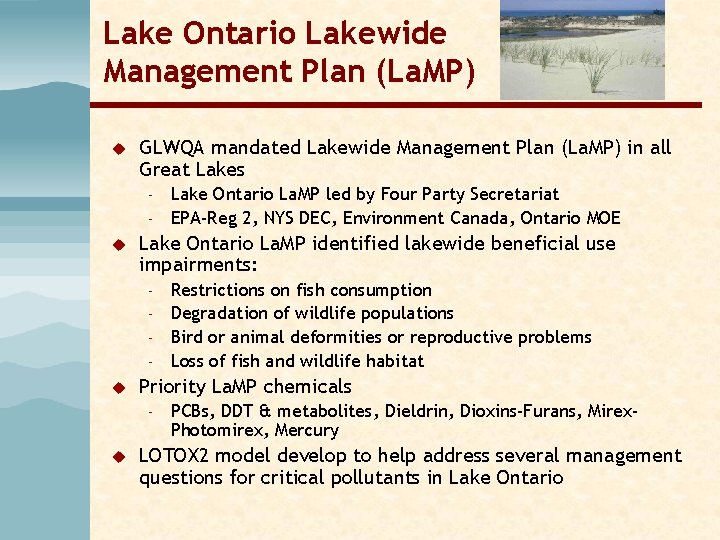
Lake Ontario Lakewide Management Plan (La. MP) u GLWQA mandated Lakewide Management Plan (La. MP) in all Great Lakes – – u Lake Ontario La. MP identified lakewide beneficial use impairments: – – u Restrictions on fish consumption Degradation of wildlife populations Bird or animal deformities or reproductive problems Loss of fish and wildlife habitat Priority La. MP chemicals – u Lake Ontario La. MP led by Four Party Secretariat EPA-Reg 2, NYS DEC, Environment Canada, Ontario MOE PCBs, DDT & metabolites, Dieldrin, Dioxins-Furans, Mirex. Photomirex, Mercury LOTOX 2 model develop to help address several management questions for critical pollutants in Lake Ontario
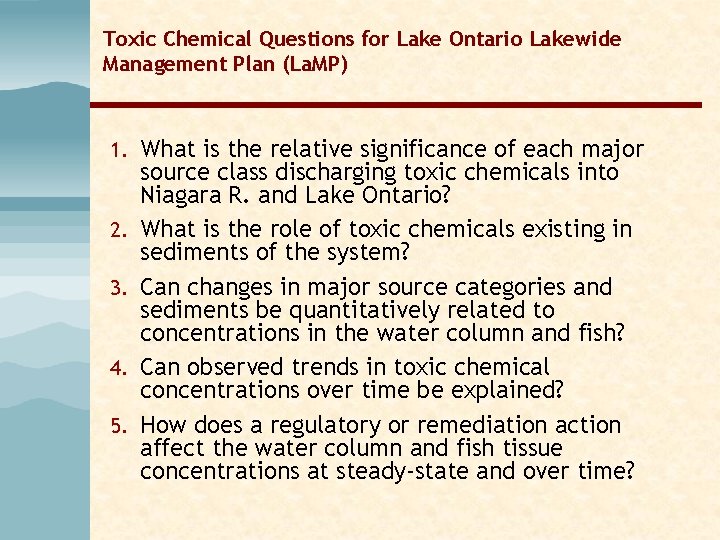
Toxic Chemical Questions for Lake Ontario Lakewide Management Plan (La. MP) 1. What is the relative significance of each major 2. 3. 4. 5. source class discharging toxic chemicals into Niagara R. and Lake Ontario? What is the role of toxic chemicals existing in sediments of the system? Can changes in major source categories and sediments be quantitatively related to concentrations in the water column and fish? Can observed trends in toxic chemical concentrations over time be explained? How does a regulatory or remediation action affect the water column and fish tissue concentrations at steady-state and over time?
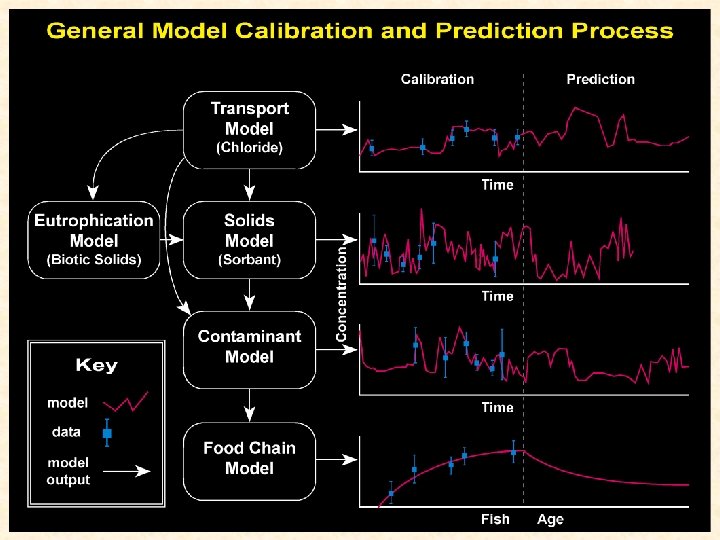
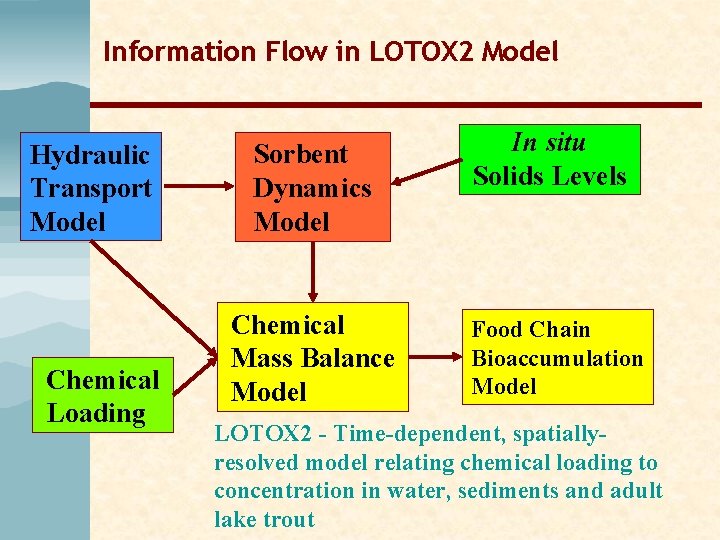
Information Flow in LOTOX 2 Model Hydraulic Transport Model Chemical Loading Sorbent Dynamics Model Chemical Mass Balance Model In situ Solids Levels Food Chain Bioaccumulation Model LOTOX 2 - Time-dependent, spatiallyresolved model relating chemical loading to concentration in water, sediments and adult lake trout
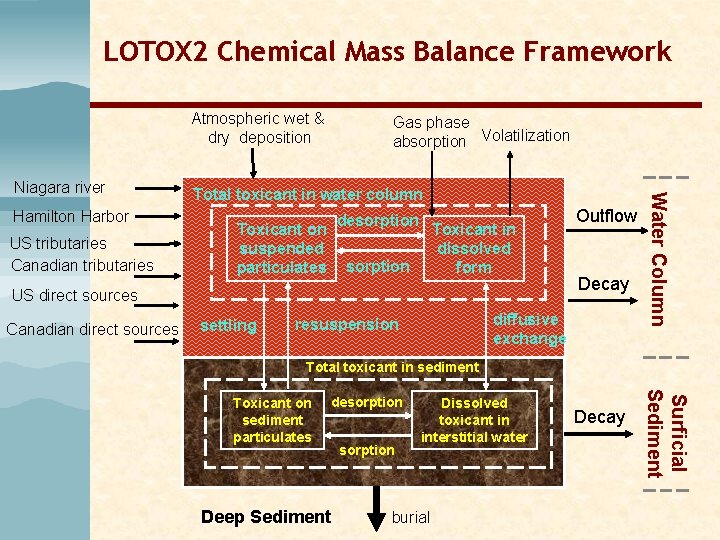
LOTOX 2 Chemical Mass Balance Framework Atmospheric wet & dry deposition Hamilton Harbor US tributaries Canadian tributaries Total toxicant in water column desorption Toxicant on suspended particulates Toxicant in dissolved form sorption US direct sources Canadian direct sources settling Outflow Decay diffusive exchange resuspension Water Column Niagara river Gas phase absorption Volatilization Total toxicant in sediment desorption Deep Sediment sorption Dissolved toxicant in interstitial water burial Decay Surficial Sediment Toxicant on sediment particulates
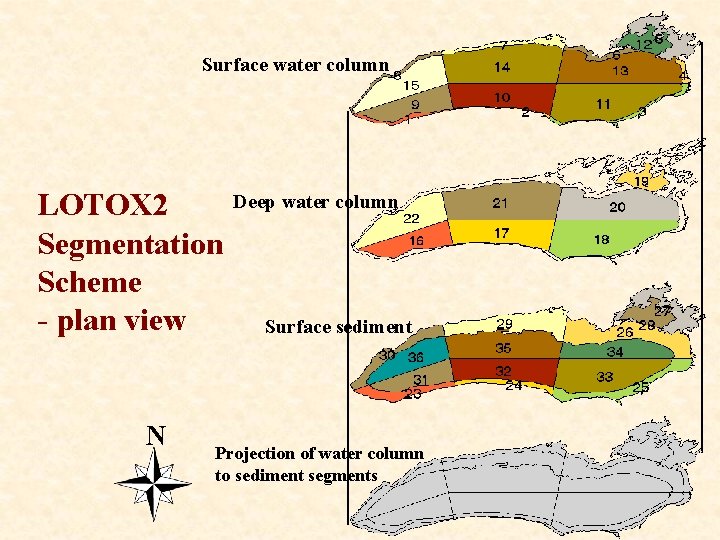
Surface water column Deep water column LOTOX 2 Segmentation Scheme - plan view Surface sediment N Projection of water column to sediment segments
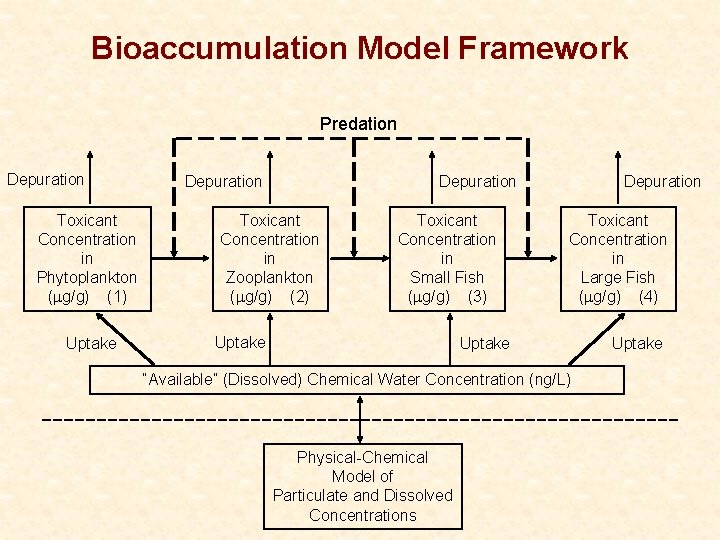
Bioaccumulation Model Framework Predation Depuration Toxicant Concentration in Phytoplankton (mg/g) (1) Uptake Depuration Toxicant Concentration in Zooplankton (mg/g) (2) Toxicant Concentration in Small Fish (mg/g) (3) Uptake Depuration Toxicant Concentration in Large Fish (mg/g) (4) Uptake “Available” (Dissolved) Chemical Water Concentration (ng/L) Physical-Chemical Model of Particulate and Dissolved Concentrations Uptake
PCB Calibration/Confirmation: Historical Simulation
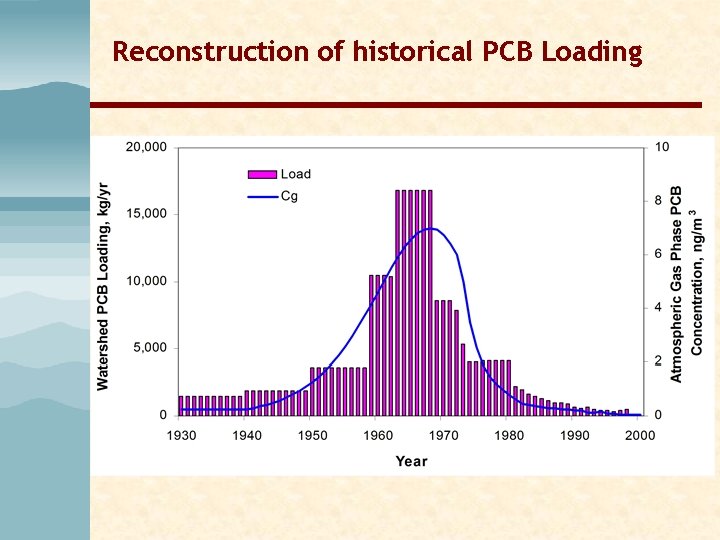
Reconstruction of historical PCB Loading
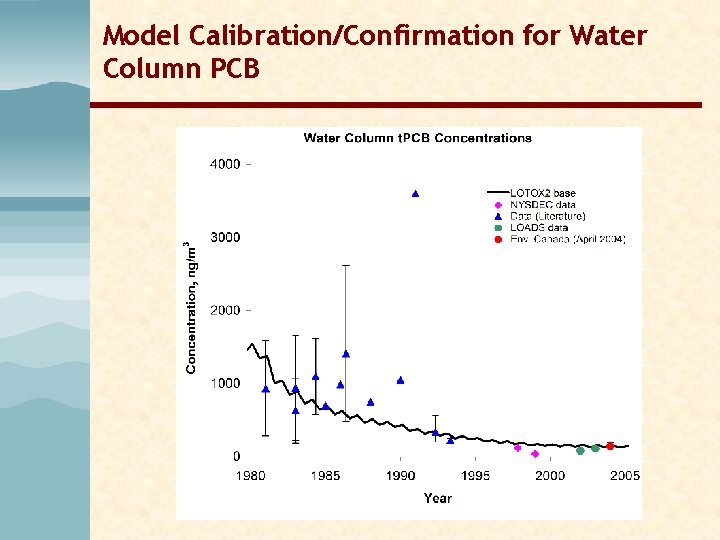
Model Calibration/Confirmation for Water Column PCB
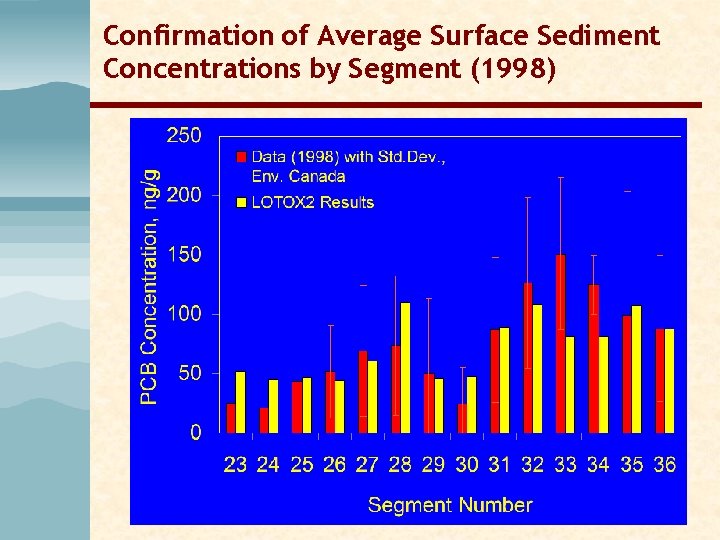
Confirmation of Average Surface Sediment Concentrations by Segment (1998)
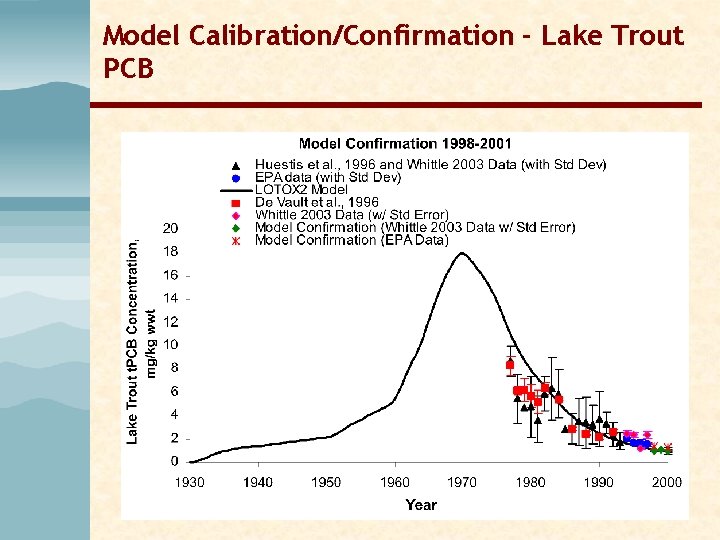
Model Calibration/Confirmation - Lake Trout PCB
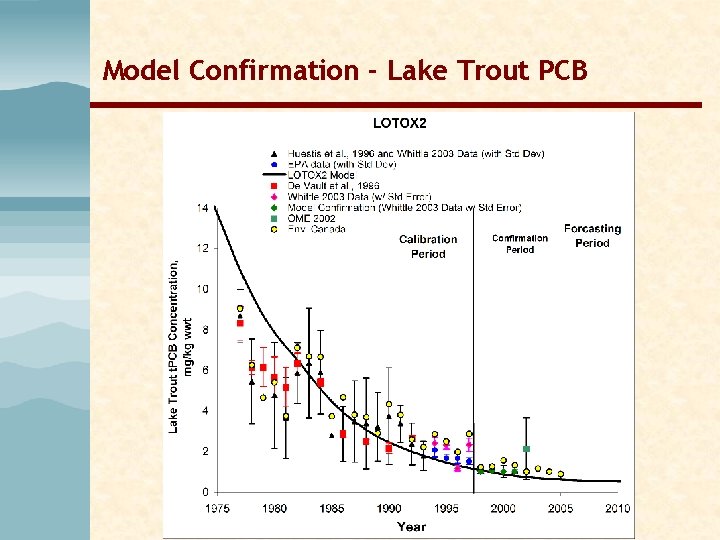
Model Confirmation - Lake Trout PCB
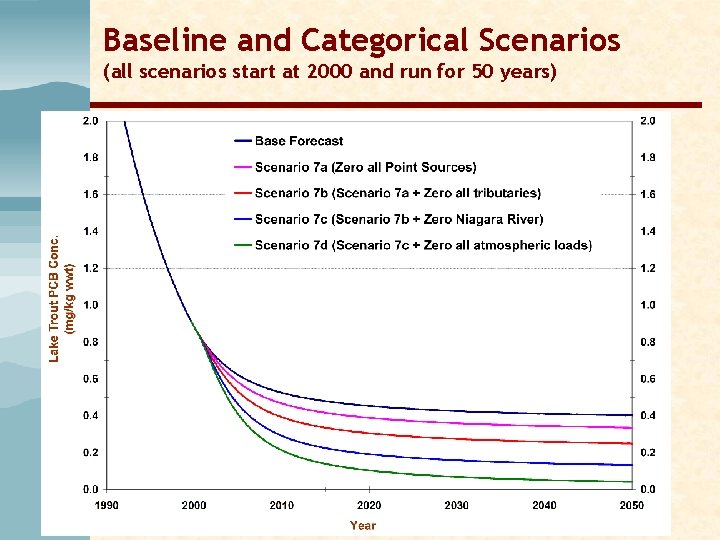
Management Application of LOTOX 2: Source Category and System Response Time
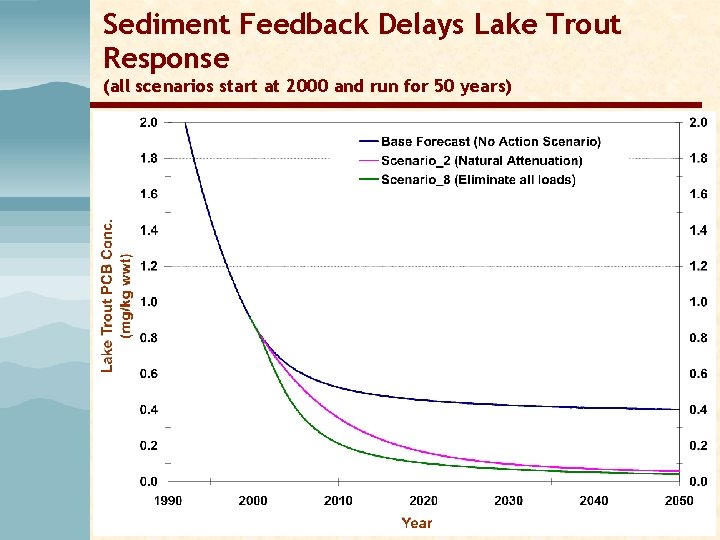
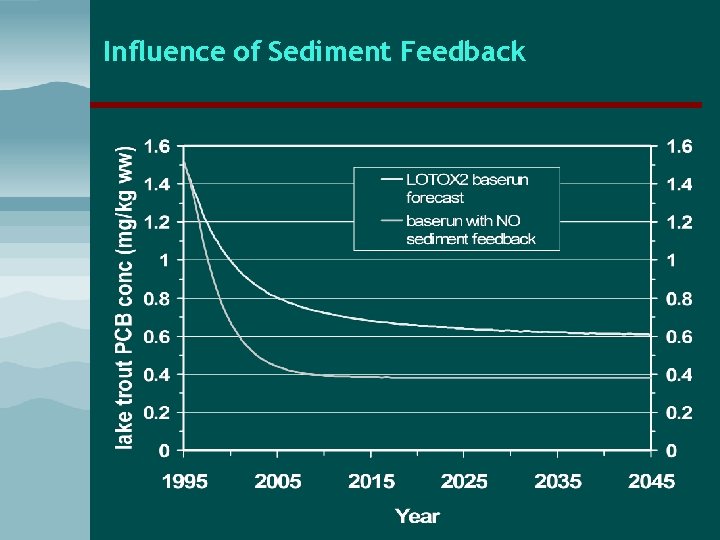
Sediment Feedback Delays Lake Trout Response (all scenarios start at 2000 and run for 50 years)
Influence of Sediment Feedback
Baseline and Categorical Scenarios (all scenarios start at 2000 and run for 50 years)
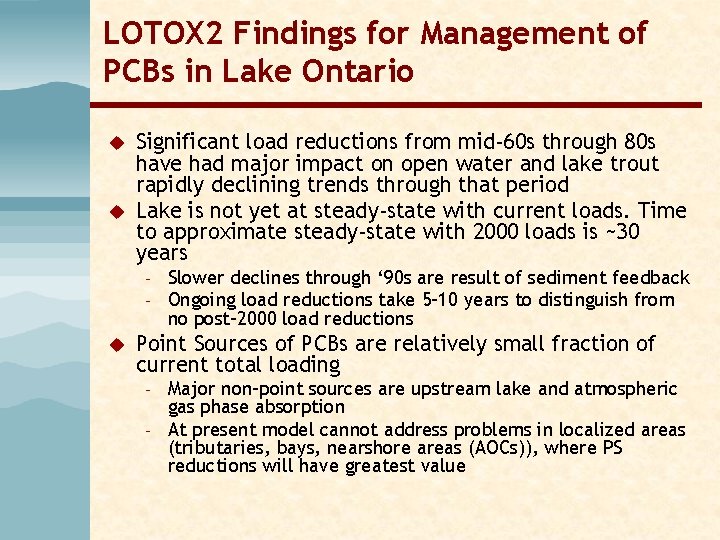
LOTOX 2 Findings for Management of PCBs in Lake Ontario u u Significant load reductions from mid-60 s through 80 s have had major impact on open water and lake trout rapidly declining trends through that period Lake is not yet at steady-state with current loads. Time to approximate steady-state with 2000 loads is ~30 years – – u Slower declines through ‘ 90 s are result of sediment feedback Ongoing load reductions take 5 -10 years to distinguish from no post-2000 load reductions Point Sources of PCBs are relatively small fraction of current total loading – – Major non-point sources are upstream lake and atmospheric gas phase absorption At present model cannot address problems in localized areas (tributaries, bays, nearshore areas (AOCs)), where PS reductions will have greatest value
Acknowledgements u u u USEPA – Region 2 for providing most of the funding for this modeling program and for providing guidance and coordination with data collection activities Lake Ontario La. MP Workgroup members and other Four Party participants for continued support and input, including data collection and sharing Other collaborative investigators during model development process, especially: – – – u Dr. Joseph Atkinson, University at Buffalo Dr. Thomas Young, Clarkson University Dr. William Booty, NWRI – Canada USEPA – GLNPO for providing funding for the POM-LOTOX 2 linkage project and for providing guidance based on experiences with mass balance modeling programs for other Great Lakes systems
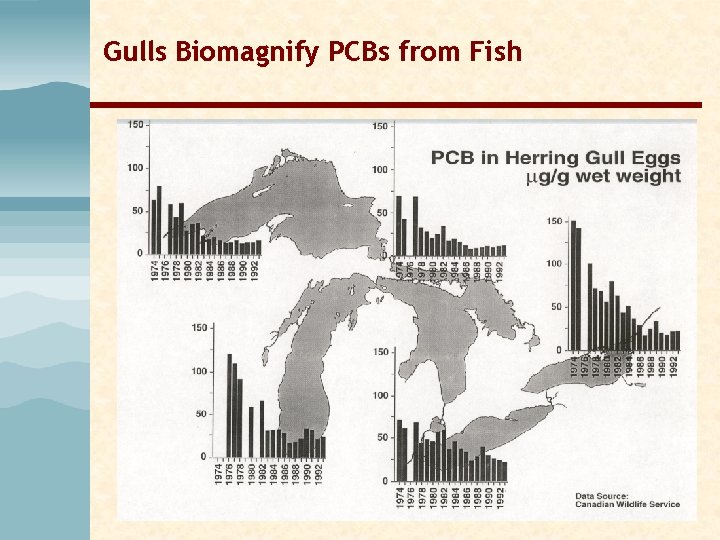
Gulls Biomagnify PCBs from Fish