Great Depression and New Deal Great Depression is


, clearing")


 contribute to the aggregate")


 created temporary jobs")


- Slides: 40
Great Depression and New Deal
• Great Depression is unique in US economic history – Large fall in GDP – Length of depression. – It takes a decade for per capita GDP to exceed 1929 level
year Real gdp Gdp deflator Real gdp per capita 1929 $977. 0 10. 61 $8, 016 1930 $892. 8 10. 22 $7, 247 1931 $834. 9 9. 16 $6, 725 1932 $725. 8 8. 09 $5, 809 1933 $716. 4 7. 87 $5, 700 1934 $794. 4 8. 31 $6, 281 1935 $865. 0 8. 48 $6, 792 1936 $977. 9 8. 57 $7, 629 1937 $1, 028. 0 8. 94 $7, 971 1938 $992. 6 8. 68 $7, 637 1939 $1, 072. 8 8. 59 $8, 188 1940 $1, 166. 9 8. 69 $8, 832 Between 1929 and 1933, real GDP had fallen 29%. By 1932 investment had fallen to 1% of GDP.
Events of the Great Depression • NBER dates beginning in August 1929 • From August to Oct, industrial production fell from 114 (1935– 39 = 100) to 110 for a decline of 3. 5 percent (annualized percentage decline = 14. 7 percent) • Stock Market Crash October 1929 • Recession of 1929 -30 was not unusual by historical standards
Events of Great Depression • Banking panics and failures started in Oct 1930 and continued to Dec 1930 – Harvest failure in Midwest • Failure of Bank of United States in New York – Dec 1930 • 2 nd Wave June 1931 -December 1931 – Bank failure in Europe, Britain goes off gold standard. ( Great Depression is world wide event. )
• 3 rd Wave- December 1932 –March 1933 • President Roosevelt declares national bank holiday, March 6, 1933 • Result is decrease in money supply and faith in banking system • Unemployment is 25 % by March 1933
Response to Bank Failure • Before Fed, banks would suspend payments, (bank holiday), clearing house banks would lend money to failing banks • Fed was suppose to do this but did not – Argument made was speculative ventures should not be bailed out
• Treasury Secretary Andrew Mellon, advised President Hoover to “Liquidate labor, liquidate stocks, liquidate the farmers, liquidate real estate. ” “It will purge the rottenness out of the system. High costs of living and high living will come down. People will work harder, live a more moral life. Values will be adjusted, and enterprising people will pick up the wrecks from less competent people”
• This did not happen. Economy did not rebound. • Causes of Great Depression – Monetary explanation – Non-Monetary
Monetary Explanations • Friedman and Schwartz • When Fed did not step in as “Lender as Last Resort” in Banking Panics result was huge decrease in money supply – Banks hold more reserves – People put less money in banks • Each banking panic makes this worse
Quantity Theory of Money • Monetary theory tells us what effect changes in money supply have an economy • The basis of the quantity theory is the equation of exchange: • MV=PY
Quantity Theory of Money • M=money supply • V=velocity – Velocity is how often money is turned over or used • P=price level • Y= real income
Quantity Theory • If we assume just V is constant or stable, • The equation of exchange (MV=PY) that if M increases, PY (nominal income )will increase. • If deflation is anticipated, when M falls, P will fall • If deflation is not anticipated Y will also fall – In this case, money supply is not falling because of direct action by Fed, panics difficult to anticipate
Nominal vs Real interest rates • Fisher equation R= r+∆P/P or r=R- ∆P/P • In deflation real rate is higher than the nominal rate • Nominal interest rates are low, but the real rates were high • Firms make investment decisions based on real rates
Why didn’t the Fed act? • Fed felt bank failures were due to poor management, not panics • No statistics available for economy as a whole.
• Fed did not understand this, did not attempt to lower real rates • Result was reduction in output – Reduced investment – Opportunity cost of holding money is negative, i. e. make money by simply holding it because prices are decreasing.
• Not clear Fed’s understanding of Monetary policy was great enough to act in the was FS said they should
Non-Monetary Views • Most can be explained in context of simple AD AS model
The Long-Run and Short Run Equilibrium Price Level Long-run aggregate supply Short-run aggregate supply A Equilibrium price Aggregate demand 0 Natural rate of output Quantity of Output Copyright © 2004 South-Western
Shifts in AD • The four components of GDP (Y) contribute to the aggregate demand for goods and services. Y = C + I + G + NX • Consumption – Expected future income or wealth, taxes • Investment – Investors confidences, taxes, lower interest rates • Government Purchases – Government decides to spend more or less • Net Exports – Recession abroad
A Fall in Aggregate Demand in LR and SR 2. . causes output to fall in the short run. . . Price Level Long-run aggregate supply Short-run aggregate supply, AS A P B P 2 1. A decrease in aggregate demand. . . Aggregate demand, AD AD 2 0 Y 2 Y Quantity of Output Copyright © 2004 South-Western
Possible causes of Decrease of AD • Consumption – Decline in wealth due to stock market crash – Pessimistic expectations as depression drags on – Credit market problems (Fisher, Bernanke) • Deflation increases value of debt from 1920 s • Reduces the value of banks assets • Increased cost of credit intermediation because of information problems
Gold Standard Problems cause decline in Net Exports • Britain is no longer dominant economy, US is unwilling to be the leader • European countries are indebted to US, to pay loans must export more than they import, means US must import but will not do this – Smoot- Hawley Tariff passed in June 1930 – Exports and imports are less than 10% of GDP
Decline in Investment • Firms loose confidence • Real interest rates are high • Keynes- “Animal Spirits”
A Fall in Aggregate Demand in LR 2. . causes output to fall in the short run. . . Price Level Long-run aggregate supply Short-run aggregate supply, AS AS 2 3. . but over time, the short-run aggregate-supply curve shifts. . . A P B P 2 P 3 1. A decrease in aggregate demand. . . C Aggregate demand, AD AD 2 0 Y 2 Y 4. . and output returns to its natural rate. Quantity of Output Copyright © 2004 South-Western
Why does AS not shift back? • AD keeps shifting down (more than one reason for the shift) • Adjustment in AS comes when people’s expectations adjust. Too much uncertainty prevents this • Something prevents prices from adjusting
Recovery • Economy hit its trough in March 1933, month FDR took office • New Deal – National Industrial Recovery Act (NIRA )passed June 1933 – Agricultural Adjustment Act (AAA) – Both were designed to increase prices by allowing firms to collude and paying farmers not to produce
• Other new deal programs – Works Progress Administration (WPA) created temporary jobs • New Deal spending is large by standards of the time, but no consensus in the literature that it had a large effect • Roosevelt was not a Keynesian, felt the problem was with the structure of the economy.
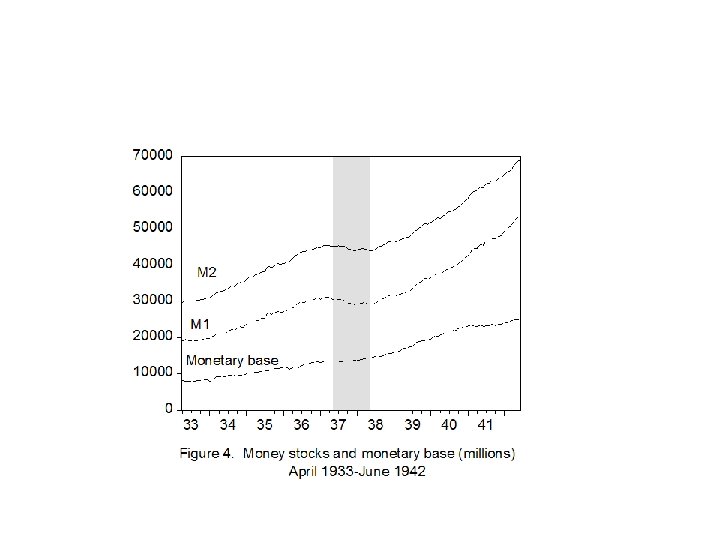
• 1933 US goes off the gold standard, begins to increase money supply • Friedman and Schwartz identify this as crucial change • FDIC created in 1934 to insure bank deposits
Why is recovery so slow? • Ohanian and Cole , JPE, August 2004 • Go back to NIRA – Allowed business to collude to raise prices without any prosecution from antitrust as long as workers had a collective bargaining agreement – Allowed workers to demand 25% increase in wages
Unemployment • Unemployment goes down, but official rate is still high in the 1940 s
Adjusted rate includes temporary jobs
• If wages are higher than equilibrium, unemployment will increase • If prices are higher than equilibrium, surplus • NIRA was declared unconstitutional in 1935 • FDR found ways to get around it – Antitrust cases dropped 50% – Increase in collective bargaining • Find wages and prices 25% higher than they should have been
Other New Deal Issues • What explains pattern of New Deal Spending? • Roosevelt stated goals were relief, recovery and reform • More aid does not go to states with lowest per capita income. – South does not get as much • Some evidence of political motivation
Recovery is underway by the time US enters WWII
WWII • Recovery is underway by the time US enters WWII in 1941 • Major changes to the Economy – Increase in government intervention (Private industry mobilized in support of war effort) – Wage and Price controls – Increase labor force participation of women • Concern about economic performance after war ends in 1945.
What happens? This is real gdp with a log scale. Increase in economic growth.
Why do we see increase in growth rate after WWII? • Different international institutions. – Bretton Woods conference results in instituitions to make multilateral economic cooperation easier. • GATT, World Bank, IMF etc • US does not attempt to collect war debts • Increase in rate of technological change
Application of science to technological problems • Starts during WWII • Variety of different institutions involved – Government – Universities – Private firms and research labs • Lots of diversity