Gravity The concept of Gravity was introduced to


- Slides: 54

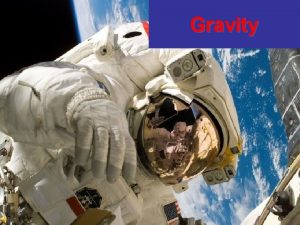
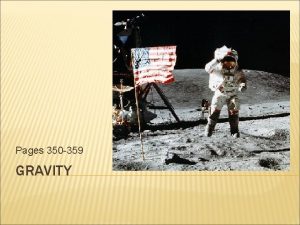
Gravity The concept of Gravity was introduced to science by Sir Isaac Newton in his Philosophiae Naturalis Principia Mathematica in 1687. He recognized that he could explain the periodic orbits of then-known planets about the Sun by introducing a very simple concept: the planets are attracted toward the Sun by a gravitational force that is inversely proportional to the square of their momentary distance from the Sun.

Force balance Let us assign m 1 = M ⦿ to the coordinate origin centred on our Sun. The force acting on an orbiting planet, mass m 2 = mp is simply: which balances the gravitational attraction of the Sun so This a non-linear differential equation that describes the evolution of the orbital position of the planet in time.

Elliptical orbit mp b M⦿

Circular orbit Orbits are generally elliptical but we, here, simplify the analysis to describe the special case of circular orbits (eccentricity e = 0) If this orbit is to be stable, the centripetal force, required to maintain the circular orbit is just that provided by gravity

Period of orbit

Orbits and eccentricity

High e orbits Halley’s comet (1910 and 1986) has a relatively short, 76 -year, period orbit confined to the Solar System. Most of the recent spectacular comets enter the inner regions of the Solar System on highly eccentric (some on nearly parabolic) orbits

The central mass

Dark matter? Using just this knowledge and measuring the tangential speeds of stars in orbit about galaxies, Vera Rubin, in 1973, obtained confirming evidence of “dark matter”. Current astrophysical theories of cosmology, the Λ-CDM model, determine that dark matter comprises about 26. 8% of all the “stuff” of the Universe. Ordinary matter and electromagnetic energy equivalents accounts for somewhat more than 4. 9% of the mass and the mass equivalent of mysterious “dark energy” for 68. 3%.

More on Earth’s orbit Wikipedia: Milankovic Cycles

Earth’s Moon orbits the Earth in 1 month but what is the length of that month? The Moon’s period of orbit depends on our perspective. Phases of the Moon repeat on an average cycle of about 29. 3 days… the period of revolution (inertial reference frame) is 27. 321582241 days of 86400 seconds. This period is known to be increasing by 0. 00001506 days (1. 301184× 10− 4 seconds) every year as the Moon takes angular momentum from the Earth and retreats from us by about 3. 83 cm/yr. As the Earth loses angular momentum to the Moon’s orbit, the rotation rate slows and the length of day (LOD) continually increases by about 17 ms/century.

Tidal forcing The Moon and Sun exert differential tidal forces on the body, water and atmosphere of Earth. On that side of the Earth closest to the Moon or Sun, the gravitational pull towards the Moon or Sun is greater than it is on the opposite. This creates a differential force across the body of Earth and the body of the Earth, its oceans and atmosphere adjust through what we observe as “tides”. There are body, ocean and atmospheric tides. Ocean and atmospheric tides involve movable fluids and are, thus, more difficult to calculate than is Earth’s body tide. Let us look into the body tide.

Earth’s Body Tide The solar bulge is always directed towards the Sun (noon) or nadir (midnight). It follows a 24 hour cycle. The lunar tidal bulge is delayed by an average of 51 minutes per day. The tide we feel is the sum of the two effects at any time.

Tidal deformation of Earth At periods of tidal deformation, the body of the Earth is not rigid. It is also not perfectly elastic in its behaviour. That is, the internal strains (deformations) are not simply proportional to the local total stress. To deal with this problem, Augustus Love introduced a series of corrective dimensionless numbers, the “Love numbers” that apply to the global Earth’s response to body tidal deformations. These numbers simplify the geodetic analyses of the shape and long period deformation of the body of the Earth, Moon, planets. On Love numbers of Earth and Terrestrial Planets

The Love numbers for Earth •

Tidal beating The 24 -hour Solar tide, with two high tides and 2 low tides each day, beats with the 24 hour 51 minute lunar tide. The lunar tide is not exactly periodic at 24 hour 51 minute because the Lunar orbit is inclined relative to Earth’s spin axis. The two tidal forcings add together to produce the measureable body tide.

The Slowing Earth Rotation (LOD) The slowing rotation of the Earth is primarily due to “friction” within and on the Earth due to lunar tides. Part of that friction is due to ocean tidal action on coasts eroding rocks and displacing sands. A greater part is due to the internal friction of the body of the Earth. The friction-like viscosity of the Earth doesn’t allow the Earth to adjust its shape to be in exact accord with the lunar tidal force. The adjustment of the “bulge” raised is delayed by about 12 minutes relative to the Earth-Moon vector.

Earth rotation: wobbles, nutation, precession, time The axis of rotation of the Earth is “nearly” space fixed and aligned with the geographical coordinate system so that ± 90 o latitude approximately coincides with the rotation axis. Actually, the Earth’s rotation is a very complex subject. There are hundreds of effects that disturb this simple model of rotation. The IERS, International Earth Rotation (and Reference Systems) Service, obtains accurate measurements of the Earth’s rotation period (LOD) and current orientation and publishes them on various intervals, typically, averaged over a period of 5 days.

48 years of time Redacted from EOC published data sets

20 years of wobbles EOC, Paris

Recent Earth Orientation Plots The Earth Orientation Center, Paris What are these “times? ” See: USNO: Systems of Time 1 mas = 3. 09 cm

110 years of Polar Motion

Periods of the wobbles We can spectrally decompose the history of relative motion of the rotation axis… to reveal a 1 -year annual component and the 435 -day Chandler component

Precession On a longer time scale, the Moon applies a torque on the rotating Earth that contributes to the “precession”, that is, the drifting orientation of the “mean rotation axis”. The precession cycle has a period of 25772 years. In about 13000 years, Vega, a very bright star now in the mid-latitude of the sky will become our “North Star”. At the same time, the Earth’s orbit will have taken us to “aphelion” in January. That suggests marginally less solar radiation in the winter of the northern hemisphere and marginally more in the summer. Many other gravitational/tidal interactions between the Earth and the other planets also force orbital and rotation variations.

Shape of the Earth If the Earth were isolated, homogeneous, at least layer by layer, non-rotating and in equilibrium, it would be pulled into a perfectly spherical shape through gravity. Gravitational acceleration on the surface would then be It is in fact almost spherical but it is rotating once every 86164. 092 seconds relative to the inertial system of the distant “fixed stars”.

Shape of the Earth II On the rotating Earth, Newtonian gravity provides a centripetal acceleration, Directed radially toward the axis of rotation. The vector of “gravitation acceleration” on the surface becomes: Note that this acceleration vector is not directed toward the centre of mass of the Earth.

Clairault’s Theorem Alexis Claude Clairault, in 1743, obtained the first correct, though still approximate analysis of the ellipsoidal shape of Earth. He obtained where and where m is the ratio of the centripetal acceleration to the Newtonian gravitational acceleration at the equator.

Reference Ellipsoid •

The Geoid The “geoid” is the gravitational “equipotential surface” is that most closely corresponds to the “reference ellipsoid”. Recall that the gravitational potential relates locally to the gravitational acceleration as Where is the scalar gravitational potential of the Earth relative to the Earth’s centre of mass. We shall see that if we can measure the field at altitude, we can “downward continue” to obtain the field and it gradient (acceleration) at the surface.

Continuation? In absence of local contributions to gravity, Laplace’s equation for the gravitational potential holds: and We obtain the second derivative of the vertical component of the gravitational potential as the negative residual to the sum of the two horizontal components. Noting that this holds throughout the vector field, we can downward continue the geopotential or, similarly, the free-air gravitational acceleration anomaly.

Continuation? Satellite measurements of the gravitational potential field at elevation allow us to obtain the horizontal components of the field to be used in the gradient calculation. This is now better done by GRACE and GOCE by direct “horizontal” gradient measurement. With the horizontal gradient measures, we can simply (in principle) integrate from the satellite elevation to the surface to obtain the “free-air gravity anomaly”:

The Geoid and its gradient We map the geoid via satellite geodesy. The orbit of a satellite is affected by the distribution of the mass about which it orbits. We deconvolve the detail of the orbit to obtain mass distribution in terms of the gravitational potential field and in recent years, the gravitational gradient. NASA’s GRACE (Gravity Recovery and Climate Experiment – and here. ) and ESA’s GOCE (Gravity field and steady-state Ocean Circulation Explorer) both employed dual satellites, obtaining their gradient measures by laser ranging between them. A recent, high resolution geoid model from UTexas and GFZ-Potsdam.

Some geoid models Animations and images by GFZ Potsdam… • • Geoid from GRACE and GOCE surveys Surface “free air” gravity anomaly Both together Free-air gravity (high resolution static)

The Geoid and Isostasy Recognizing that the geoid is an equipotential surface and that the gravitational potential function due to a mass decreases as we approach the mass according to convention, we note that where the geoid surface is low and hence closer to the Earth’s centre, it adjusts to that level because mass is deficient in the sectoral column. The geoid sits high over mass excess and low over mass deficits.

Isostasy By the mid-1800 s, the reasons for topography – differences in elevation – on the Earth were not yet understood. George Everest had by 1830 recognized that there was something odd about the mass of the Himalayan Plateau when he was correcting his survey measurements across India. Members of the Royal Society were asked “What is the explanation for the elevation of the Himalayan Plateau and the Andes Mountain chain? ”.

Isostasy Archdeacon J. H. Pratt suggested that the reason for high elevations is that light materials ”float” higher than do dense materials and that the rock of areas of high elevation are of low density. G. B. Airy proposed another model: the high-standing regions are compensated by deeper roots but their densities are similar to those of low stands.

Gravity acceleration measurements •

Free-air Corrections If we were to measure gravity at elevation above the reference ellipsoid, gravitational acceleration would less by than on the reference datum. We correct to the datum by adding in this amount to our observation of gravity at elevation through the free-air correction. On the geoid, that equipotential surface most closely fitting the reference ellipsoid, This is really just the continuation of the potential field and its gradient in absence of mass. But…

Bouguer Corrections The reason we might be measuring the field at elevation might well be because the ground elevation is above (or below) the datum level. The ground mass between datum and our elevation contributes to the gravity measurement as where is the so-called Bouguer density appropriate to the ground mass. Often, we use which is appropriate for average crustal density. This correction subtracts from the Free air correction whether one is above or below the datum. You might convince yourself of this.

Bouguer gravity map Canada This map presents Bouguer gravity anomalies on land freeair gravity anomalies offshore. The data were compiled from the holdings of the Canadian Geodetic Survey, Surveyor General Branch. They were collected to map the gravitational attraction over the Canadian landmass and offshore areas. Variations in the force of gravity are due to differences in the mass of underlying materials. These data are useful for geological interpretation and have applications in oil, gas, and mineral exploration. The gravity field is also used to define the geoid, which is the ideal shape of Earth, or mean sea level if Earth were completely covered with water. From Geoscan Data Centre: NRCanada

Local terrain correction Using gravity instruments in mineral or petroleum exploration, we typically obtain our measurements on the ground surface. We apply the appropriate free-air and Bouguer corrections to take our measurements to a chosen datum elevation. But there may still be a problem in traversing uneven ground. We may have to correct for the near-to-measurement terrain masses or deficits. We calculate the effect of highlands and low valleys on our measurement and correct that effect away so effectively reducing our measurements as if obtained on a flat plane.

Modelling gravity anomalies We are usually looking for anomalous variations in gravity as evidence of anomalous nearby mass distribution. We often employ “standard” models to describe the anomalous mass. Consider the contribution due to a rectangular parellelipiped.

Modelling gravity anomalies Just as the gravitational potential contributions due to each elemental brick add up to give us the full potential, so the gravitational acceleration contributions also add up brickby-brick. Unfortunately, though, is a vector quantity and so would have to solve for each of the components of the vector

George Everest’s India survey Colonel Sir George Everest was Surveyor-General of India from 1830 to 1843. He completed the Great Trigonometric Survey of India along a meridian arc from the far south of the subcontinent north to Dehradun and Nepal. He very accurately chained the distance along the meridian, about 2400 kilometres. He also employed navigation by the stars to measure the meridianal distance. He found a discrepancy of 5. 24” of latitude!

Pratt, Airy and Isostasy Everest correctly attributed the discrepancy to a small difference to a deflection of the plumb bob that defined the local vertical as he approached Kaliana, near Dehradun, and the Himalayan Plateau. Pratt calculated that the gravitational attraction to the Himalayan Plateau should have deflected the plumb line by 15. 885”, three times as much. Airy recognized that the overestimate was due to mass-deficient roots of the mountains in accord with his model for isostasy.

Modelling anomalies: a buried sphere The gravitational acceleration due to a subsurface volume with mass density anomaly with perfectly spherical distribution can be exactly replaced by a point mass model with that mass centred on the sphere’s centre of mass. Suppose we were to have a spherical mass of density contrast . with the host rock, having a radius and buried at depth The mass contrast with the host rock would be

Modelling anomalies: a buried sphere

Anomaly: buried sphere At the measurement point , the magnitude of the anomalous gravitational acceleration directed from the measurement point to the body’s centre of mass is simply and its vertical component, that which we would usually measure with a gravity meter, would be scaled by

Anomaly: buried sphere

Modelling anomalies: a buried sphere The maximum value of the anomaly at would be At some separation , the half-width at half-height (point ), the anomaly would be A simple calculation obtains and we have a simple method for determining the depth to the centre of mass from our measurement datum plane.

Modelling anomalies: a buried horizontal cylinder We calculate, rather directly, the gravity acceleration toward the cylinder along a line parallel to the -axis. If represents the mass per unit length along the axis of the cylinder, at distance from the cylinder’s axis, the gravitational acceleration due to the element of unit length separated by distance from the -origin line contributes where

Modelling anomalies: a buried horizontal cylinder We calculate, rather directly, the gravity acceleration toward the cylinder along a line parallel to the -axis. If represents the mass per unit length along the axis of the cylinder, at distance from the cylinder’s axis, the gravitational acceleration due to the element of unit length separated by distance from the -origin line contributes where

Modelling anomalies: a buried horizontal cylinder Integrating, we find the vertical component gravity anomaly. The half-height half-width is simply calculated: This applied to a cylinder of infinite length; for a cylinder truncated at , along the line above the cylinder,

Modelling anomalies Classical textbooks in Applied Geophysics devote much time to the formalism of gravity anomalies. Now, with easy access to digital computers and “canned” codes, we often iteratively calculate the anomaly forms. Rather than extend these modelling gymnastics, let’s turn to Interpreting Gravity.
 First generation right
 Gravity for dummies and dummies for gravity equations
 Mpls basics introduction
 Peter introduced me to jack
 Dewey classification system
 He introduced the ppft
 Administrative reforms of cornwallis
 They introduced me to her husband passive voice
 Tea drinking in england
 History of tourism 4000 bce
 Yuppie meaning
 French course menu
 How is the weather in spring?
 Archibald maclaren contribution in physical education
 Non operating dental auxiliaries
 C introduced by
 Schools of psychology structuralism
 Nsw tertiary admissions centre
 It was introduced by chen in 1976
 Republic act no. 821
 Flag football history
 What is the theme of the story zoo by edward hoch
 Ulugh khan
 Shakespeare sonnet structure
 Inter bank participation certificate example
 File formats in multimedia
 Mandate of heaven drawing
 Chen diagram
 Define extended metaphor
 Term biodiversity was given by
 20 points program
 Picture of steve jobs
 Glucose introduction
 Who introduce the house bill 393?
 Thế nào là hệ số cao nhất
 Trời xanh đây là của chúng ta thể thơ
 Lp html
 Hệ hô hấp
 Thế nào là số nguyên tố
 đặc điểm cơ thể của người tối cổ
 Các châu lục và đại dương trên thế giới
 Tư thế worm breton là gì
 ưu thế lai là gì
 Tư thế ngồi viết
 Bàn tay mà dây bẩn
 Mật thư tọa độ 5x5
 Các châu lục và đại dương trên thế giới
 Bổ thể
 Từ ngữ thể hiện lòng nhân hậu
 Tư thế ngồi viết
 V cc
V cc Thẻ vin
 Thể thơ truyền thống
 Bài hát chúa yêu trần thế alleluia
 Khi nào hổ con có thể sống độc lập

