GRAVITATIONAL WAVE NOISE HUNTING IN THE CLASSROOM Emmanuel


, a giant laser interferometer designed to detect gravitational")


- Slides: 23
GRAVITATIONAL WAVE NOISE HUNTING IN THE CLASSROOM Emmanuel Chaniotakis, Research and Development Department, Ellinogermaniki Agogi FRONTIERS Winter School 29/1 -7/2 2020
A QUICK REMINDER ABOUT GRAVITATIONAL WAVES. . https: //www. youtube. com/watch? v=4 Gb. Wf. NHt. HRg
VIRGO (http: //www. virgo-gw. eu/ ), a giant laser interferometer designed to detect gravitational waves located in Italy
LET’S FOLLOW AN ANALOGY Imagine a gravitational wave detector as an “ear”
Your friend is humming a tune at some distance from your “ear”. The ear will listen to the tune. Similarly, a gravitational wave detector’s sensitivity corresponds to how far in the universe it can reach and thus to its discovery potential! Your friend keeps his voice level the same. The farther he is, the weaker the sound you hear. A more sensitive ear will be able to listen to your friend humming from a greater distance. Therefore: “more sensitive ears” “can identify signals from larger distances”
WHAT AFFECTS A GRAVITATIONAL WAVE DETECTOR’S SENSITIVITY? LET’S GO BACK TO OUR ANALOGY WITH THE EAR. . Trying to detect gravitational waves is like trying to identify a song your friend is humming (signal) in a very noisy party (noise).
To detect gravitational waves even from the strongest events in the Universe, VIRGO needs to be able to know when the length of its 3 -kilometer arms change by a distance 10, 000 times smaller than the diameter of a proton! This makes VIRGO susceptible to a great deal of instrumental and environmental sources of noise. These sources of noise need to be understood and controlled. There are sources of noise that are understood…
DIFFERENT SOURCES OF “NOISE” AFFECT THE GRAVITATIONAL WAVE DETECTOR’S SENSITIVITY Adapted from : Laser Labs’ Spacetime Quest: https: //www. laserlabs. org/spacetimequest. php
LET’S PLAY WITH NOISE IN GRAVITATIONAL WAVE DETECTORS! A SCHOOL ACTIVITY https: //cloud. graasp. eu/en/pages/5 bd 9 b 6190 d 7 f 5 d 27 c a 8 c 339 f/subpages/5 bd 9 b 61 b 0 d 7 f 5 d 27 ca 8 c 33 aa
A FEW EXAMPLES OF ENVIRONMENTAL NOISE. .
*A measure of How far in the Universe can the detector “hear” Due to the earthquake in Magoula, the horizon of the Virgo detector dropped by a factor of 3! HAVE YOU EVER WONDERED HOW AN EARTHQUAKE IN MAGOULA/ GREECE AFFECTS THE VIRGO GRAVITATIONAL WAVE DETECTOR IN PISA? (19 JULY 2019) * BNS range is defined as the distance up to which a single detector could observe the coalescence of a pair of 1. 4 solar masses neutron stars with signal to noise ratio of 8.
DOES THE WIND BLOWING, AFFECT A GRAVITATIONAL WAVE DETECTOR? On March 22, from 20. 00 UTC and on, the wind speed jumped from a few to >40 km/hr and exceeded 60 km/hr around 08. 00 in the morning. This induced seismic noise both to the ground and to the building where the VIRGO detectors are housed, thus affecting its performance. What does this plot tell us? "If two neutron stars with mass equal to 1. 4 solar masses merged in distance higher than 50 MPc and a signal arrived to our detector around 08. 00 A. M, we wouldn't be able to detect it because the wind was blowing furiously!"
GLITCH HUNTING!
INTRODUCING SPECTROGRAMS. . As we said, gravitational wave detectors resemble very sensitive “ears”. One of our most important visualizations to understand the signals coming from GW detectors are spectrograms. Connecting gravitational wave noise hunting with sound!! Assume that you observe a complex waveform, such as the waveform of an earthquake. The frequencies of which the waveform consists may contribute in different proportions over time. In order to visualize this attribute, we use the spectrogram. The spectrogram shows both frequency and amplitude with respect to time. A spectrogram is essentially a 3 D plot: It is a graph with x-axis representing time, y-axis representing frequency and the z-axis representing amplitude. Usually, the z-axis is replaced by a color code.
This picture shows the spectrogram of a sound consisting of three frequencies. Can you say which frequency sounds the loudest at t=2 s? At which time does frequency equal to 500 Hz sound louder than the others?
LET’S PLAY WITH SPECTROGRAMS https: //academo. org/demos/spectrum-analyzer/
THE SOUND OF A GRAVITATIONAL WAVE https: //www. youtube. com/watch? v=TWqh. UANNFXw
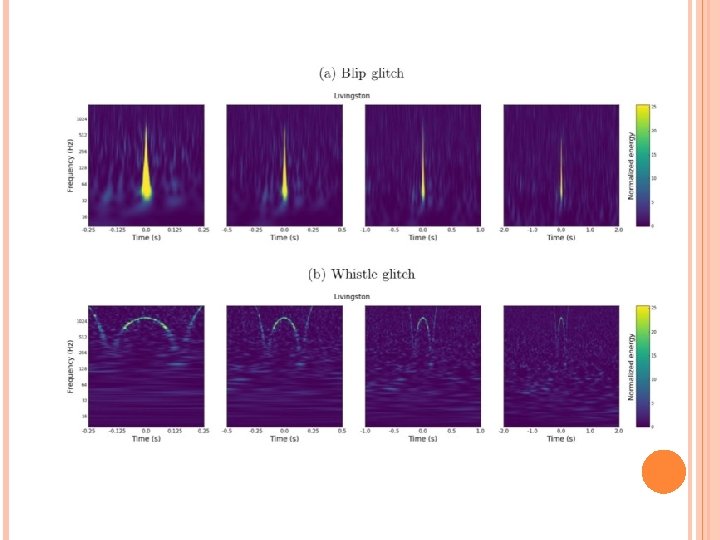
There are sources of “noise” in Gravitational Wave detectors that are poorly understood. . The so called “Glitches”!
How far in the Universe can a Gravitational Wave Detector “reach” The frequency spectrum of a class of glitches “Glitches”: Noise “triggers” that make their way in the GW data and introduce dead time in the detector and mimic GW signals.
Classifying glitches using computers has proven to be an exceedingly difficult task. A family of data analysis algorithms known as machine learning have made huge strides over the past decade in classification problems, though they usually require a large preclassified dataset to operate effectively. However, human intuition has proven time and time again to be a useful tool in pattern recognition problems such as this. This is where your help is needed!
LET’S DO SOME GLITCH HUNTING WITH: GRAVITY SPY https: //www. zooniverse. org/projects/zooniverse/gravity-spy Citizens help LIGO and VIRGO scientists identify typologies of glitches and advance their machine learning algorithms
LET’S HUNT SOME GLITCHES!