Graphs of Sine and Cosine Functions Section 4


 The phase shift is a right or left shift of")


. Rewrite the")


 Vertical Shift (Up or down)")
 + d Vertical shift is the amount")

. The graph of y")


 The phase shift is a right or left shift of")
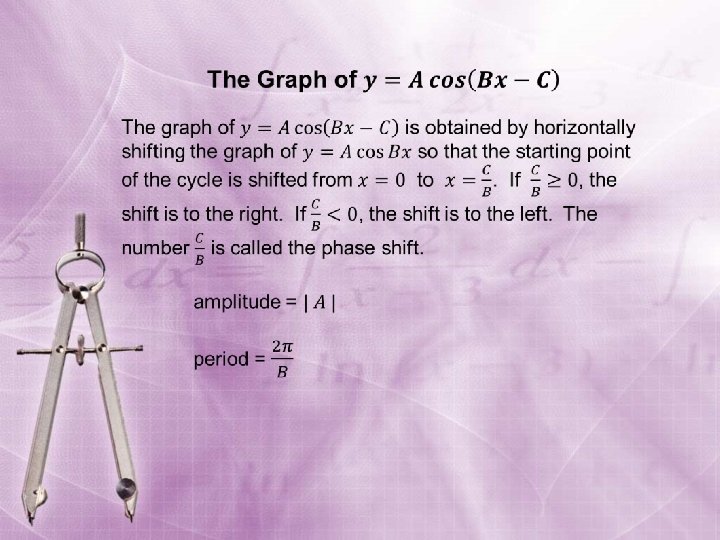


. The graph of y = cos")

- Slides: 39
Graphs of Sine and Cosine Functions Section 4. 5
Objectives • Sketch the graphs of sine and cosine functions and their variations. • Use amplitude and period to help sketch the graphs of sine and cosine functions. • Sketch translations of graphs of sine and cosine.
http: //www. youtube. com/watch? v=n. Xx 2 Psg. Mj. YA
120° 90° 135° y = sin x 1 – 1 45° 150° 30° 180° 0° 330° 210° 225° 240° 90° 180° 60° 270° 315° 300° 360°
120° 90° 135° 60° 45° 150° y = sin x 30° 180° 0° 330° 210° 225° 240° 90° 180° 270° 315° 300° 360°
Sine starts at the sea shore
Graph of the Sine Function To sketch the graph of y = sin x we don’t need many points, just the key points. These are the maximum points, the minimum points, and the intercepts. x 0 sin x 0 1 0 -1 0 y = sin x y x
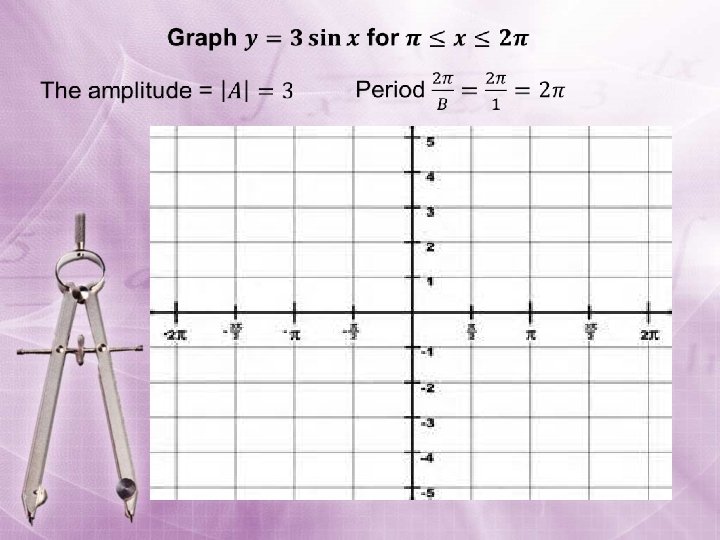
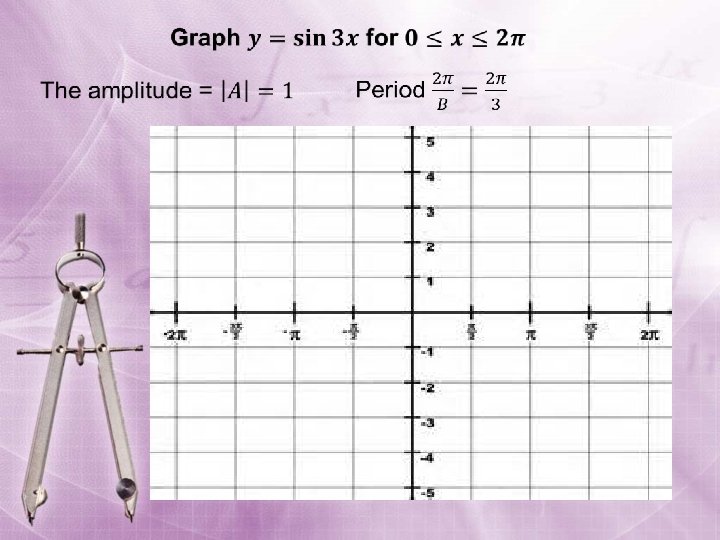
Amplitude • Amplitude
Period • Period
Amplitude (the height) The phase shift is a right or left shift of the graph.
§ § § Identify the amplitude and the period. Find the values of x for the five key parts---the x-intercepts (3 for sine), the maximum point, and the minimum point. Divide the period into 4 quarter-periods. Plot the five key points. Connect the key points with a smooth graph and graph one complete cycle. Extend the graph in step 4 to the left or right as desired. (phase shift) y y = 2 sin x x y = sin x y = – 4 sin x reflection of y = 4 sin x
Free Graph Paper for Graphing Trig Functions http: //mathbits. com/Math. Bits/Student. Resources/Graph. Paper. ht m
§ Identify the amplitude and the period. § Find the values of x for the five key parts---the xintercepts (3 for sine), the maximum point, and the minimum point. Divide the period into 4 quarter-periods. § Plot the five key points. § Connect the key points with a smooth graph and graph one complete cycle. § Extend the graph in step 4 to the left or right as desired.
Example: Sketch the graph of y = 2 sin (– 3 x). Rewrite the function in the form y = a sin bx with b > 0 Use the identity sin (– x) = – sin x: y = 2 sin (– 3 x) = – 2 sin 3 x amplitude: |a| = |– 2| = 2 period: 2 = 2 3 Calculate the five key points. x 0 y = – 2 sin 3 x 0 y 0 – 2 2 0 ( , 2) x (0, 0) ( , -2) ( , 0)
y y = A sin Bx Amplitude: | A| x Starting point: x = C/B Period: 2 /B
Maximum height One cycle Starting point to the right
Amp = 2
Amplitude (height) Vertical Shift (Up or down)
y = a sin(bx – c) + d Vertical shift is the amount that the red curve is moved up (or down) compared to the reference (black) curve. A positive shift means an upward displacement while a negative shift means a downward displacement. vertical shift This black curve is for reference.
§ § § Identify the amplitude and the period, the phase shift, and the vertical shift. Find the values of x for the five key parts---the xintercepts (3 for sine), the maximum point, and the minimum point. Divide the period into 4 quarterperiods. Find and plot the five key points. Connect the key points with a smooth graph and graph one complete cycle. Extend the graph in step 4 to the left or right and up or down as desired Graph of Sine Applet
Example 1: Sketch the graph of y = sin (–x). The graph of y = sin (–x) is the graph of y = sin x reflected in the x-axis. y Use the identity sin (–x) = – sin x y = sin (–x) x
Cosine starts on the cliff
Graph of the Cosine Function To sketch the graph of y = cos x first locate the key points. These are the maximum points, the minimum points, and the intercepts. x 0 cos x 1 0 -1 0 1 Then, connect the points on the graph with a smooth curve that extends in both directions beyond the five points. A single cycle is called a period. y y = cos x x
§ Identify the amplitude and the period. § Find the intercepts (one y-intercept and two xintercepts, the maximum point, and the minimum point. Divide the period into 4 quarter-periods. § Plot the five key points. § Connect the key points with a smooth graph and graph one complete cycle. § Extend the graph in step 4 to the left or right as desired.
Amplitude Period 1
Example: Sketch the graph of y = 3 cos x Partition the interval [0, 2 ] into four equal parts. Find the five key points; graph one cycle; then repeat the cycle over the interval. x 0 y = 3 cos x 3 0 -3 0 3 max x-int min x-int max y 2 ( , , 3) (0, 3) x ( , 0) ( , – 3)
Amplitude (the height) The phase shift is a right or left shift of the graph.
http: //www. youtube. com/watch? v=ij. TIr-ayk. Uk
§ § § Identify the amplitude and the period. Find the intercepts (one y-intercept and two x-intercepts, the maximum point, and the minimum point. Divide the period into 4 quarter-periods. Plot the five key points. Connect the key points with a smooth graph and graph one complete cycle. Extend the graph in step 4 to the left or right as desired. Graph of Cosine Applet
http: //www. analyzemath. com/cosine_applet. html
Graph one period of the function. § § § Identify the amplitude, the period, and the phase shift. Find the intercepts (one y-intercept and two x-intercepts, the maximum point, and the minimum point. Divide the period into 4 quarter-periods. Plot the five key points. Connect the key points with a smooth graph and graph one complete cycle. Extend the graph in step 4 to the left or right as desired. Graph of Cosine Applet
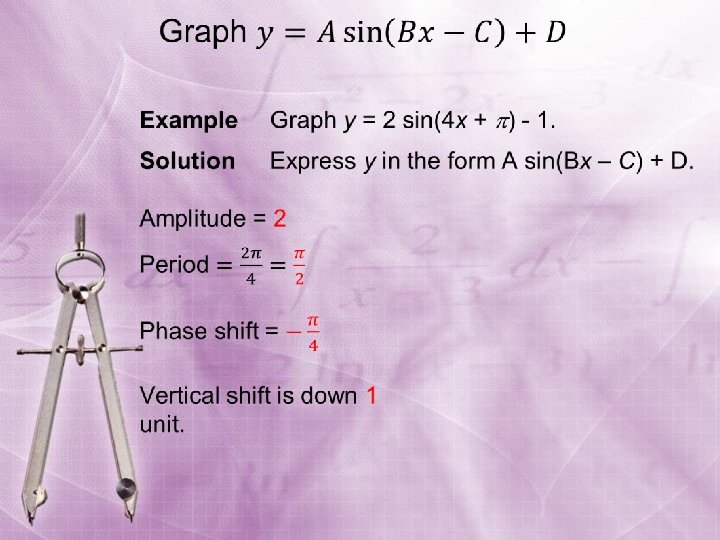
Amplitude Period: 2π/b Phase Shift: c/b Vertical Shift
Vertical Translation - Example Vertical Translation = 3 units upward, since d > 0 2 0 -2 30˚ 60˚ 90˚ 120˚
Sketch the graph of y = cos (–x). The graph of y = cos (–x) is identical to the graph of y = cos x. Use the identity cos (–x) = cos x y Cosine is an even function. x y = cos (–x)