Graphs Data Tables Data Tables Data tables are

Graphs & Data Tables

Data Tables Data tables are used to organize & analyze information collected during a lab

Making a Data Table Title Effects of Various Fertilizers on Plant Growth Fertilizer Brand Plant Height Trial 1 Plant Height Trial 2 Plant Height Trial 3 A 5 cm 6 cm 4 cm B 4 cm 3 cm C 3 cm 1 cm 2 cm

Graphing Basics All graphs need: A Title Label axis Appropriate Scale Data Points

Review Which of the following is required on a graph? a. b. c. d. Title Labeled axis Scale ALL of the Above

Labeling Axis The Independent Variable always goes on the X axis The Dependent Variable always goes on the Y axis X axis

Review The independent variable goes on which axis? a. b. c. d. Y X P Z

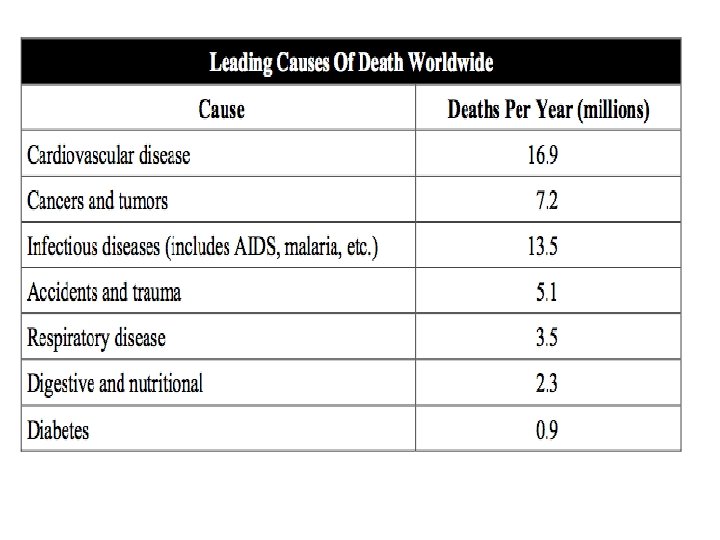
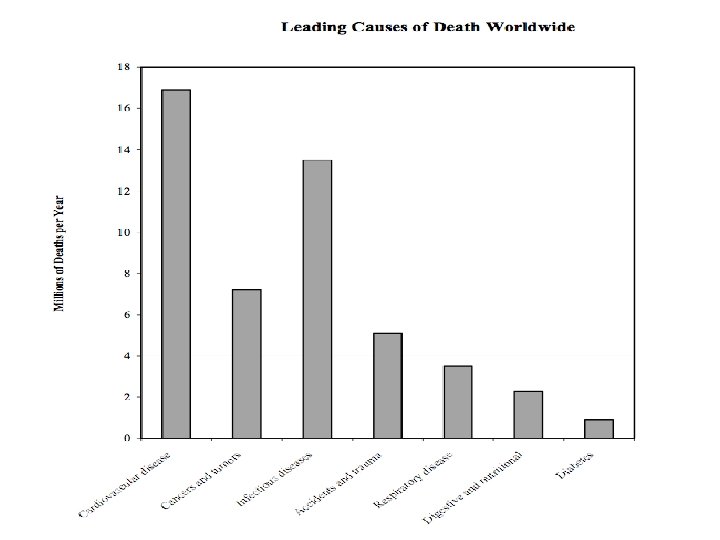
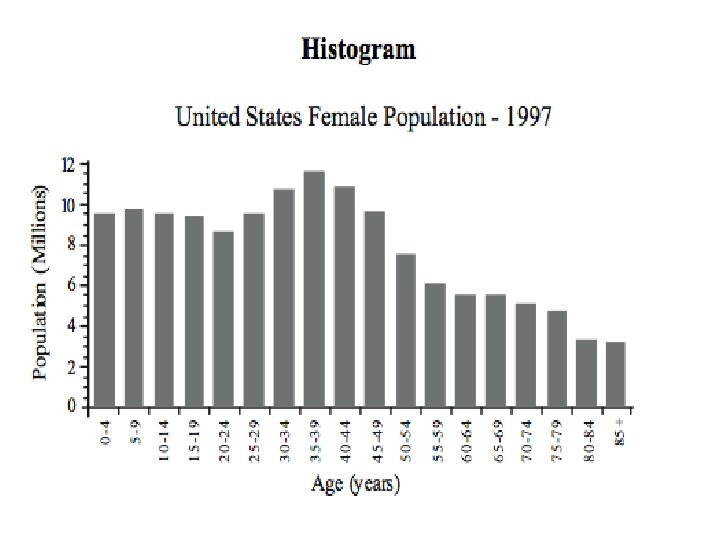
Types of Graphs Bar Graph Compares one or more set categories Histogram Uses ranges of data to compare

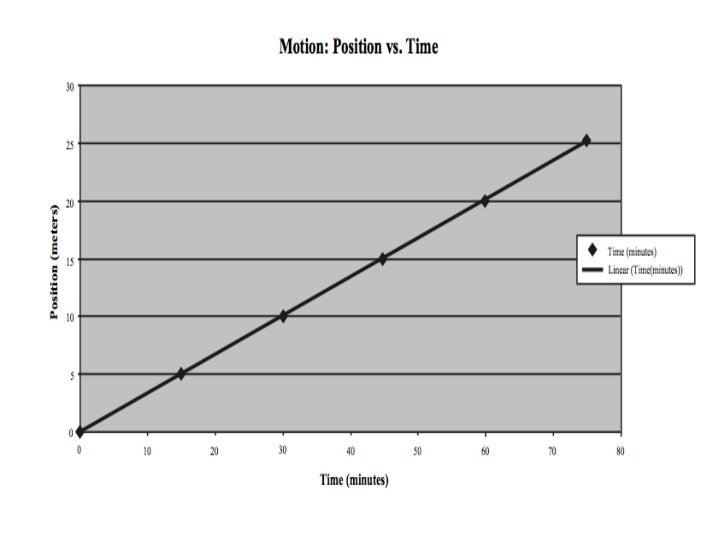
Types of Graphs Line Graphs Shows how things change over time or cause & effects Pie Charts Shows percentages or parts of a whole

Which type of graph would you use? 1. To compare the height of boys vs. girls in you class? Bar graph 2. To show plant height changes over time? Live graph 3. To show what percent of money your school gives to after school programs? Pie chart 4. To show temperature affects the activity level of fish? Line graph 5. To compare volume and length of green beans? Bar graph 6. Which variable goes on the x- axis? Independent Variable 7. Which variable goes on the y-axis? Dependent Variable

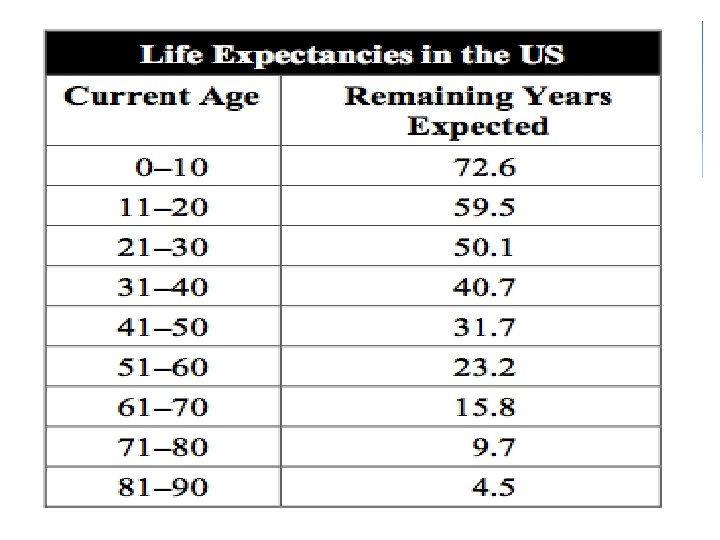
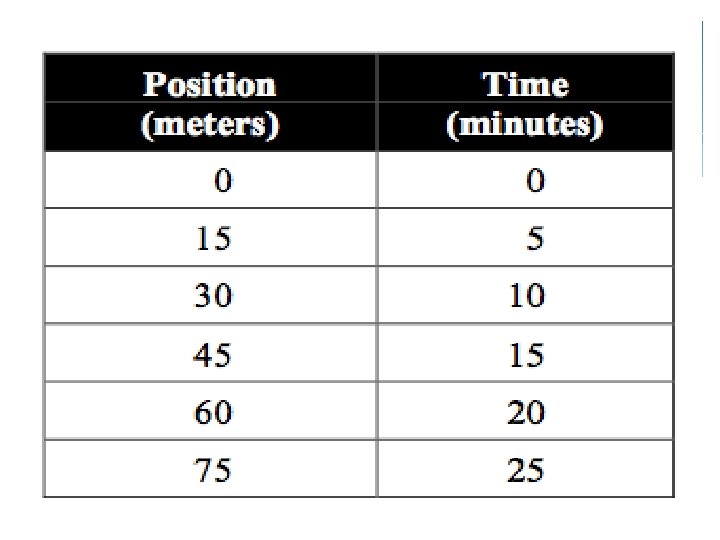
Interpreting Graphs & Data Tables Examples

Pie Charts
- Slides: 18