Graphing Techniques and Interpreting Graphs Learning Objectives I

Graphing Techniques and Interpreting Graphs

Learning Objectives • I can explain the reasons/functions for using graphs. • I can interpret data on a scientific graph • I can describe data trends/relationships shown on a graph. • I can predict data using interpolation and extrapolation.

Why are graphs important? What is the functions for graphs?

Introduction A graph of your data allows you to see the following: • Patterns • Trends • Shows Relationships between the independent and dependent variables. • Shows visual representation of data

Numbering/Scaling
 • Something the experimenter changes and is placed")
Variables Independent Variable (I. V. ) • Something the experimenter changes and is placed on the X – Axis. Dependent Variable (D. V. ) • Measured during the experiment and is placed on the Y – Axis.

Types of Data Relationships • Directly Related • Inversely Related

Directly Related or Direct Relationship • IV increases, DV increases or as IV decreases, DV decreases. • Positive trend on a graph • Math calls this a positive correlation

Inversely Related or Inverse Relationship • IV increases, DV decreases or as IV decreases, DV increases. • Negative trend on a graph • Math calls this a negative correlation

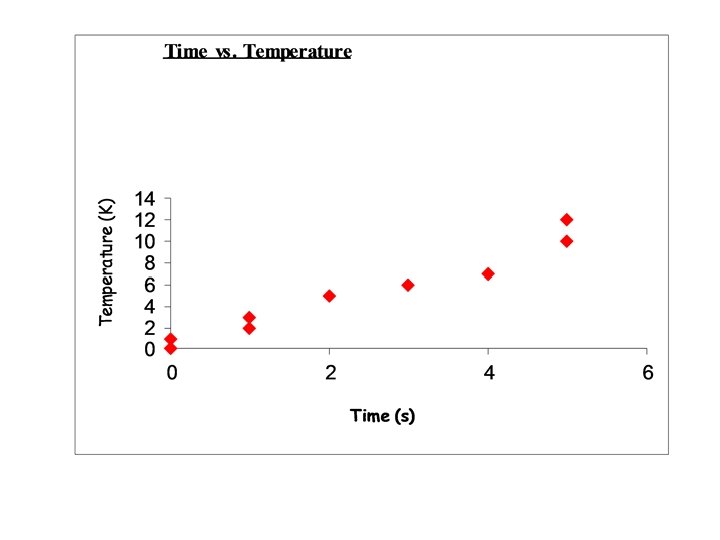
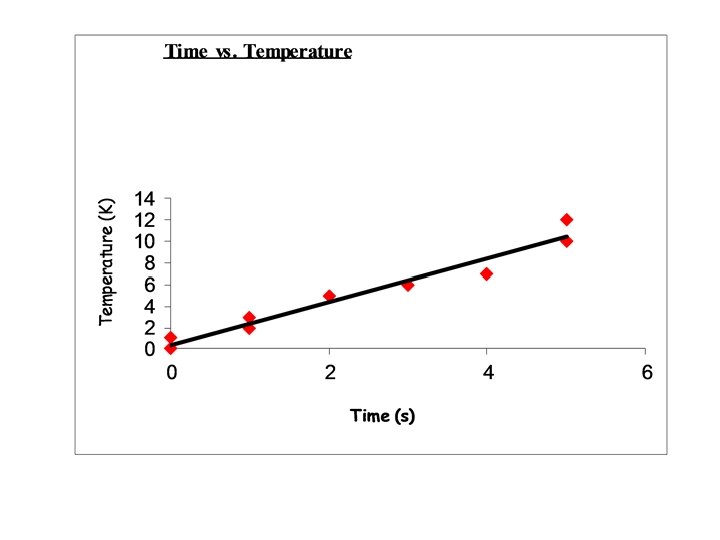
Trend Line or Line of Best Fit A line that summarizes the data. This is sometimes called a best-fit line. • • The line of best fit is drawn so that the points are evenly distributed on either side of the line Data points do not have to be on this line or the line DOES NOT need to go through each point. The data points are NOT connected with a line. It DOES NOT have to go through the origin.

Ways to predict data • Interpolation - Predicting data that is inside the range of data (between 2 existing data points) • Extrapolation - Predicting values that are outside of the range of data. Trend line is often extended to make extrapolation easier.

Interpolation • Predict data that is inside the range of data (between 2 existing data points)

Extrapolation • Predicting values that are outside of the range of data. Trend line is often extended to make extrapolation easier.
 Example – Predict the time at temperature 90. Did you interpolate")
Temperature (0 C) Example – Predict the time at temperature 90. Did you interpolate or extrapolate? Why did you use this process? Time (Min)
 Example – Predict the time at temperure 90. 87 min Did")
Temperature (0 C) Example – Predict the time at temperure 90. 87 min Did you interpolate or extrapolate? Extrapolate Why did you use this process? Outside the data 87 min Time (Min)
 Example – Predict the temperature at time 30. Did you interpolate")
Temperature (0 C) Example – Predict the temperature at time 30. Did you interpolate or extrapolate? Why did you use this process? Time (Min)
 Example – Predict the temperature at time 30.")
28 o. C Temperature (0 C) Example – Predict the temperature at time 30. 280 C Did you interpolate or extrapolate? Interpolate Why did you use this process? Between 2 Points Point 1 Point 2 Time (Min)

Big Ideas • Trend line or best fit line – A line that summarizes the data. Data points do not need to be on this line. The data points are NOT connected with a line • Data Relationships • Directly Related – IV increases , DV increases ; and vice versa • Inversely related – IV increases , DV decreases ; and vice versa • Data Prediction • Interpolation – predicting values that are within the range of available data (between existing data points) • Extrapolation – predicting values that are outside the range of data; a trend line is often extended.
- Slides: 20