Graphing SWBAT Determine the four different types of

Graphing

SWBAT • Determine the four different types of graphing relationships.

Do Now • Place 5, 280 in scientific notation.

Direct Relationship: As one variable increases, the other _________.

Examples
 Relationship: As one variable increases, the other _________")
Indirect (Inverse) Relationship: As one variable increases, the other _________

Examples

Cyclic Relationship: As one variable increases, the other Events that are cyclic are also __________

Examples

No Relationship: As one variable increases, the other _________

Examples • Density vs. amount of material

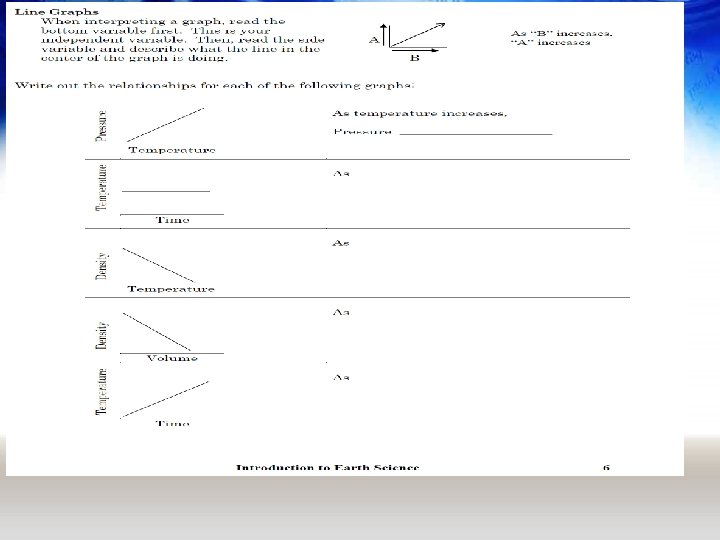
State in words the relationship between relief and the average rate of erosion as shown in the graph. As relief increases, the average rate of erosion increases

State in words the relationship between air temperature and relative humidity. As the air temperature increases, the relative humidity decreases

Exit • Thumbs up/down • Begin: Graphing handout. • Homework: Complete class handout.

True or False Thumbs Up or Thumbs Down Graphing involves an independent and dependent variable. True

Day 2 • SWBAT: Set up and interpret graphs. Interpolate and extrapolate graphical data. • Do Now:

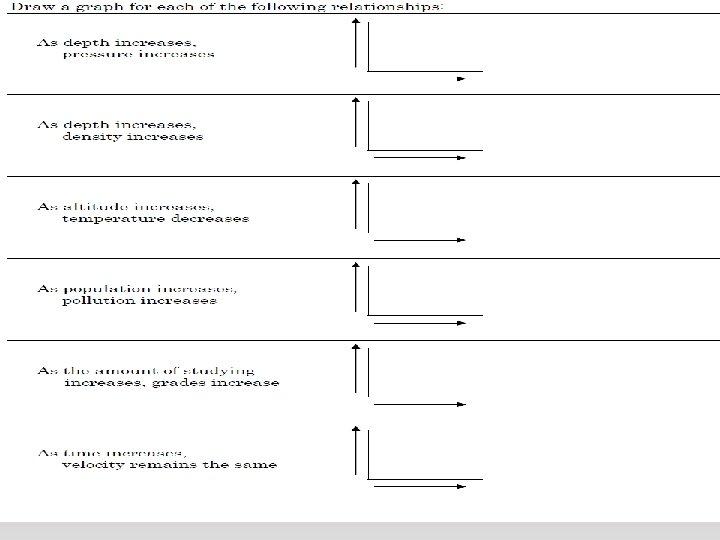
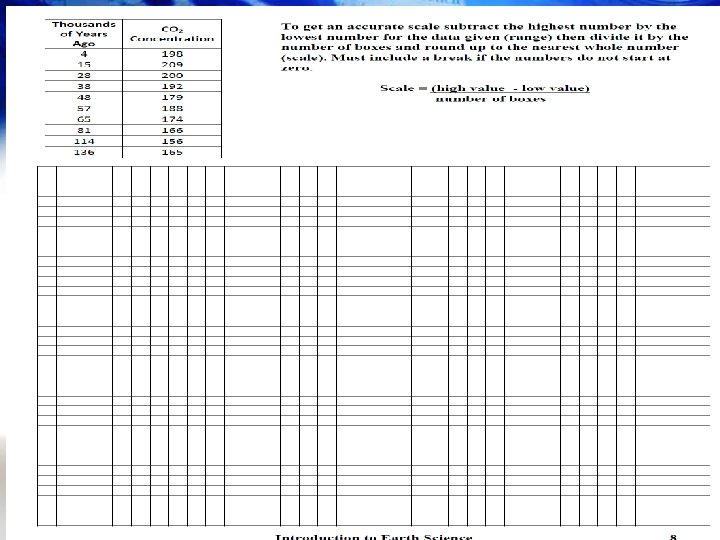
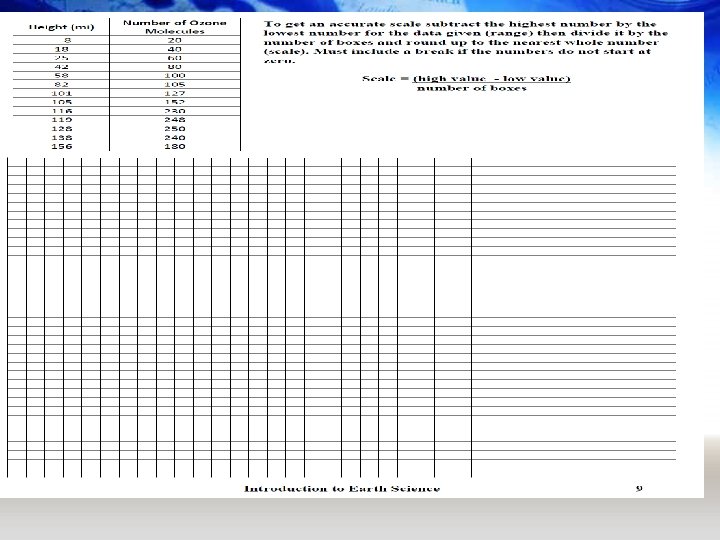
Begin working in your packet on pg. 8 -9

Exit • Begin: Graphing handout. • Homework: Complete class handout.
- Slides: 22