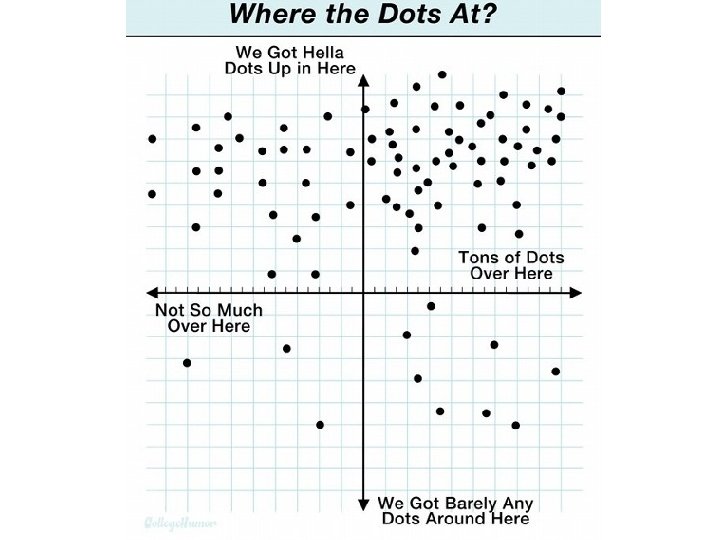
Graphing Skills Scatterplot vs Line Graph Data points


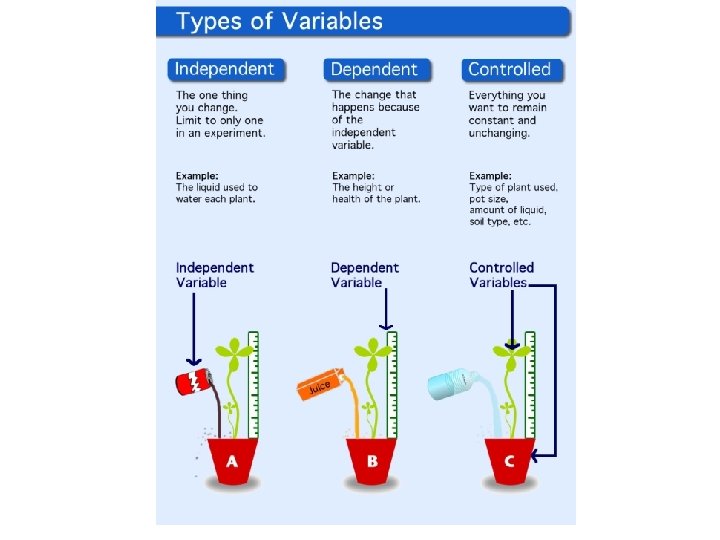
 variable is the X axis 2. The dependent")


- Slides: 29
Graphing Skills
Scatterplot vs Line Graph • Data points independent of each other • The next value does not depend on the previous
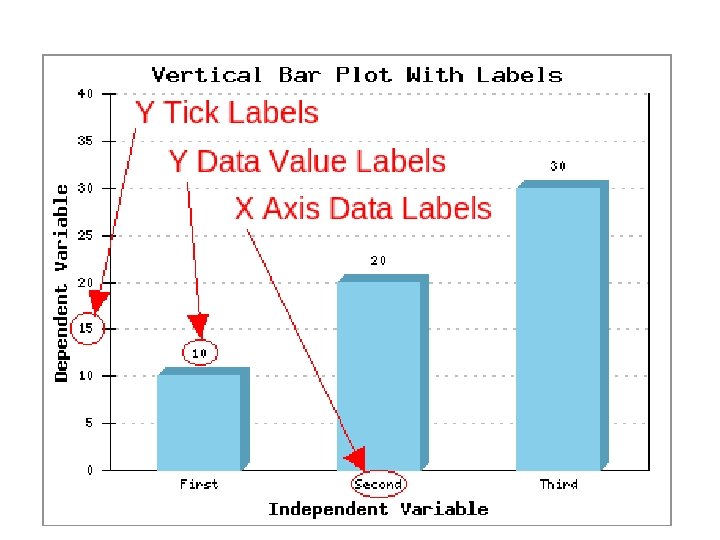
Labeling Axes 1. The independent (manipulated) variable is the X axis 2. The dependent (responding variable) is written along the vertical axis 3. Units on any variables should be included in () following the axis title
Scaling Axes • THIS IS THE MOST IMPORTANT!!! – Step 1: Find the range for the variables (biggest – smallest) – Step 2: divide the range by the # of intervals you want • You don’t want your data smooshed – spread it out! – Step 3: Use the rounded number to mark off intervals along the axis
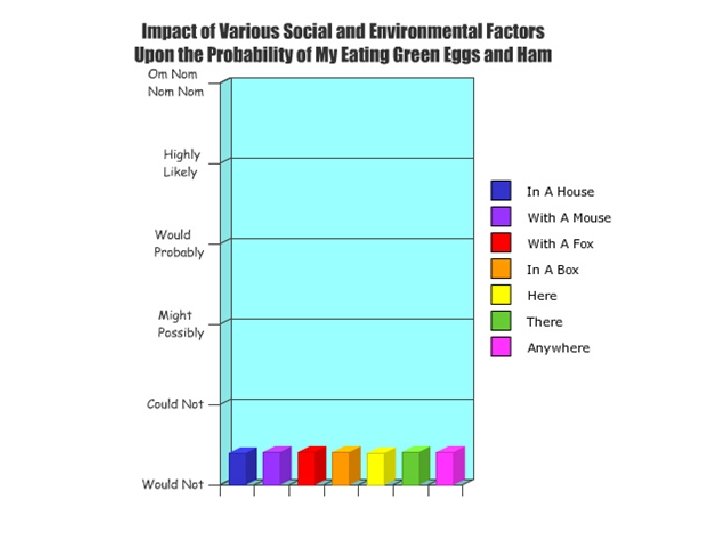
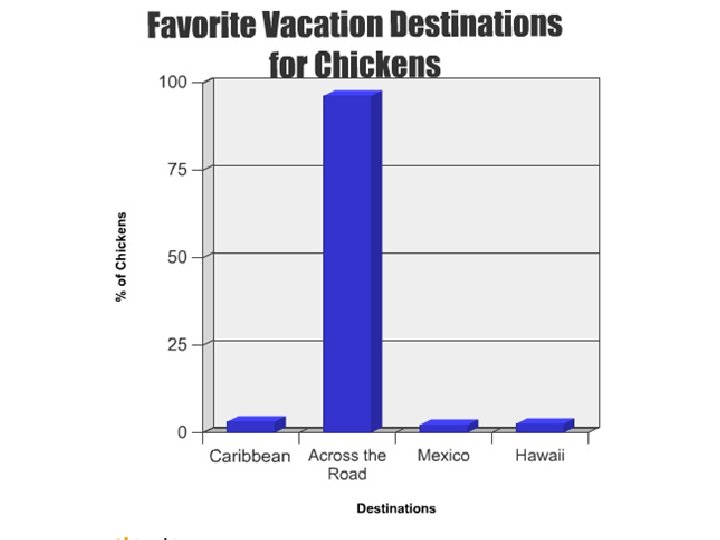
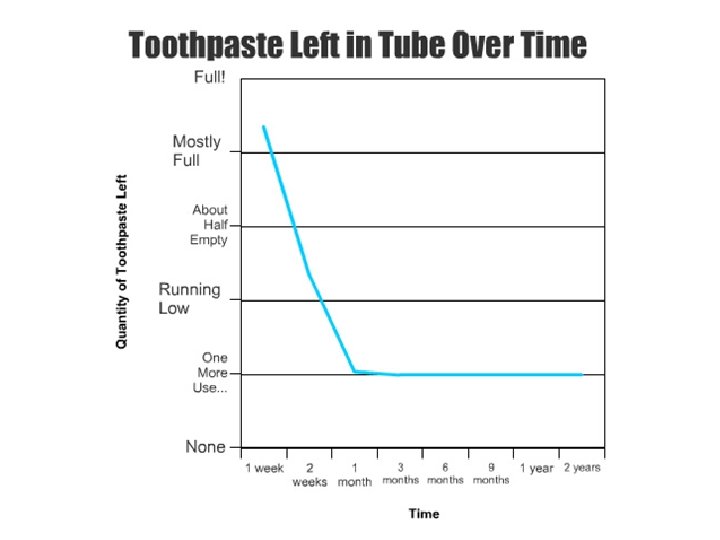
Would this get credit?
Plotting Points • Step 1: Select the first pair of values from the data (X and Y – they are not always zero!!) • Step 2: Draw a light dashed line from the number on the X axis and over from the number on the Y axis • Step 3: where these dotted lines cross, put a dark point. Repeat for all points.
Best Fit or Curve • Look for a pattern or trend • If so – draw a STRAIGHT LINE (do not connect the dots) that represents that trend • All points should lie near or on the line • For points not on the line – about ½ should fall above and ½ below • Your line should NOT extend beyond your range of data (extrapolation)
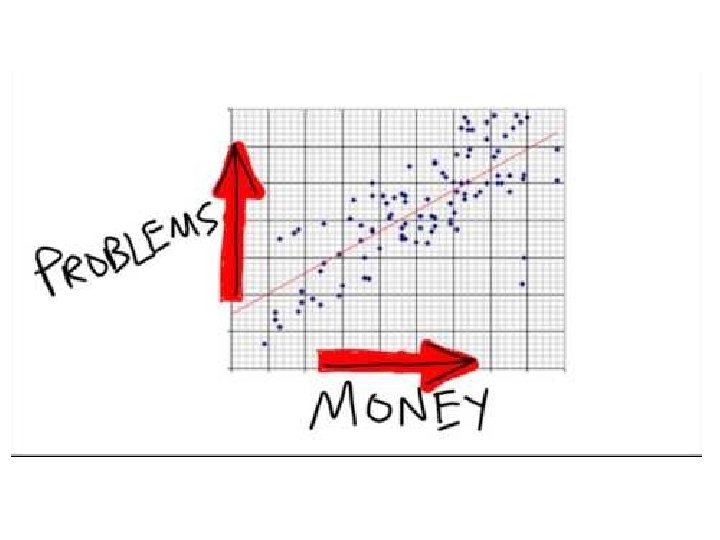
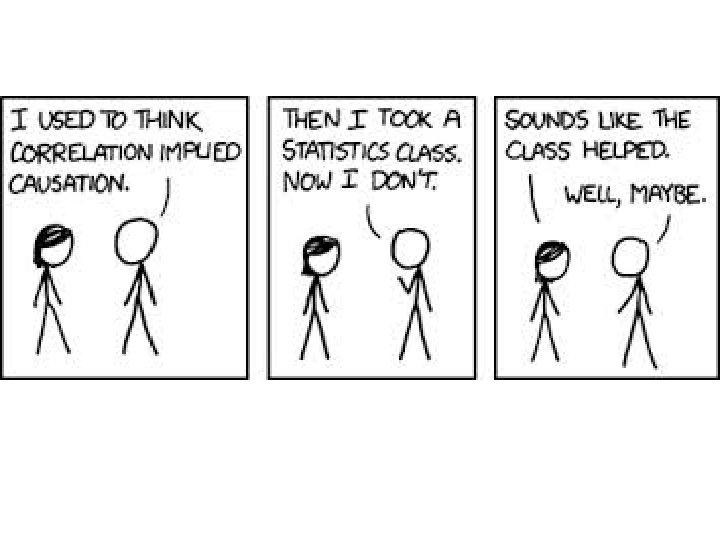
Correlation does not imply causation
Correlation does not imply causation