GRAPHING Reading Constructing and Analyzing Graphs Graphs are


 Shoe size (US #)")
- Slides: 38
GRAPHING Reading, Constructing, and Analyzing Graphs
Graphs are: • pictures that show two variables are related • easier to read than tables of numbers • often used to display experimental data When making a graph: • Put independent variable (IV) on x-axis (horizontal) • Put dependent variable (DV) on y-axis (vertical)
Ex: Distance vs. Time Graph Distance traveled at a given speed can be plotted as a dependent variable, because the distance traveled DEPENDS on the time interval chosen.
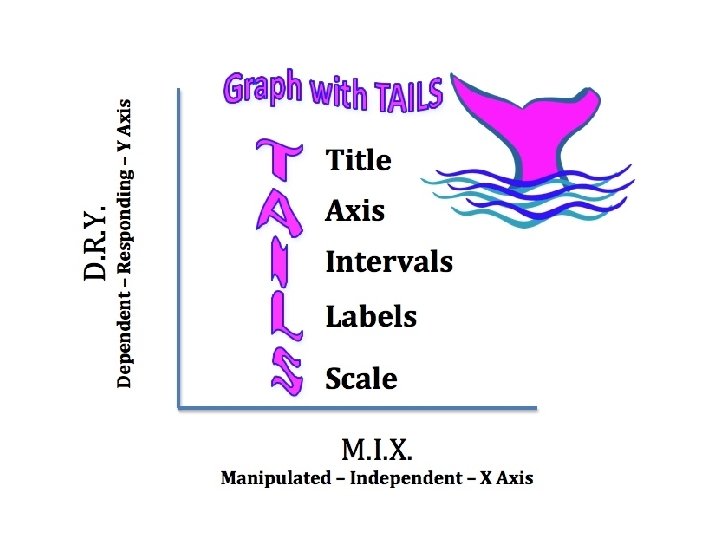
Title Remember “TAILS” when you graph! DV vs IV is a good format Axis x – axis: IV , y – axis: DV Increments even spacing; don’t always have to be increments of 1 Label Everything labeled and units included Scale appropriate range; use enough space so easy to read
Line Graphs • can show change over time • can show a relationship between two quantities • are NOT simply connected plotted points • should be a “Line of Best Fit” or “Curve of Best Fit” • Using plotted points, draw the best smooth line that passes through as many points as possible while keeping approximately the same number of unconnected points on either side of the line.
Here are some examples of best fit lines: Notice: It is NOT connect the dots!
Here are some examples of best fit lines:
Sometimes, you will be instructed to draw a best fit curve, rather than a line: Still not connect the dots. . . Make a smooth curve
Bar Graphs * easily read * used to graph categories of things * usually have spaces between the bars
Histograms * similar to bar graphs * bars represent a range of values, not a single value * bars touch each other * intervals should be equal (1 -10, 10 -20, etc. ) * width of bars should all be the same
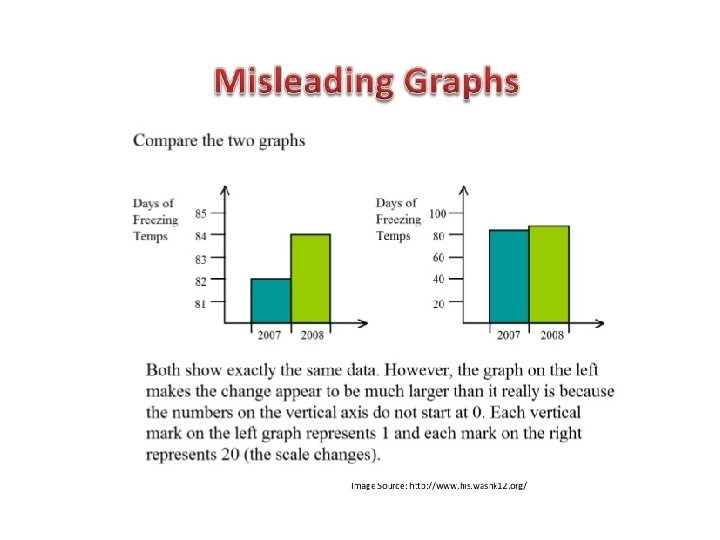
What’s wrong?
What’s wrong?
What’s wrong?
What’s wrong?
What’s wrong?
What’s wrong?
What’s wrong?
What’s wrong?
What’s wrong?
What’s wrong?
What’s wrong?
What’s wrong?
What’s wrong?
What’s wrong?
What’s wrong?
What’s Wrong?
Analyzing Graphs Interpolation: finding a value on the graph between data points - It may not be one of the data points, but the best fit line can be used to find it. Extrapolation: finding a value BEYOND the actual data on the graph - Extend the best fit line to estimate this data.
LINE GRAPH PRACTICE Use the following data to create a graph: REMEMBER: Your graph should include all of “TAILS”! “Plant Growth: Height Vs Time” Time (days) 5 10 15 20 25 30 Height (cm) 3 8 11 13 19 25
Line Graph Questions • What is the independent variable for this graph? • What is the dependent variable? Interpolation: • How tall was the plant after 12 days? Explain. Extrapolation: • How tall will the plant be after day 40? Explain.
Histogram Practice Use the following data to create a histogram: REMEMBER: Your graph should include all of “TAILS”! “Life Expectancies in the US” Current Age (yrs. ) Remaining Years Expected 0 -10 72. 6 11 -20 59. 5 21 -30 50. 1 31 -40 40. 7 41 -50 31. 7 51 -60 23. 2 61 -70 15. 8 71 -80 9. 7 81 -90 4. 5
Histogram Questions Interpretation: Mrs. Parker is 38 years old. • About how many more years can she expect to live according to the graph? Extrapolation: • Predict the remaining years of life expected for someone in the age category of 91 -100. Justify your answer. (Give specific information!)
More Line Graph Practice Use the following data to create a line graph and use the points to draw a “Line of Best Fit” or “Curve of Best Fit”. REMEMBER: Your graph should include all of “TAILS”! “Position vs. Time: Mini Motor Car on a Straight Track” Time (minutes) 0 5 10 15 20 25 Position (meters) 0 16 30 44 61 75
Line Graph Questions • What is the independent variable for this graph? • What is the dependent variable for this graph? Interpolation: • Determine the position of the car after 2. 5 minutes. Extrapolation: • If the experiment was conducted for 35 minutes, what would the car’s position be? • How many minutes will it take the car to reach the position of 180 meters?
Scientific Graphs Scientists usually use line graphs instead of bar graphs. Unless instructed otherwise, we will use line graphs in science. You are too young for bars, anyway!!!
Time allowing: Your turn! On grid paper, graph the following data (remembering T. A. I. L. S!) Time (seconds) Temperature (o. C) 0 16 16 23 31 32 44 43 60 54 75 60 92 68 102 75 120 80 136 86 150 91 167 96 181 100
Time allowing: Graph Class Survey Results Height (cm) Shoe size (US #)